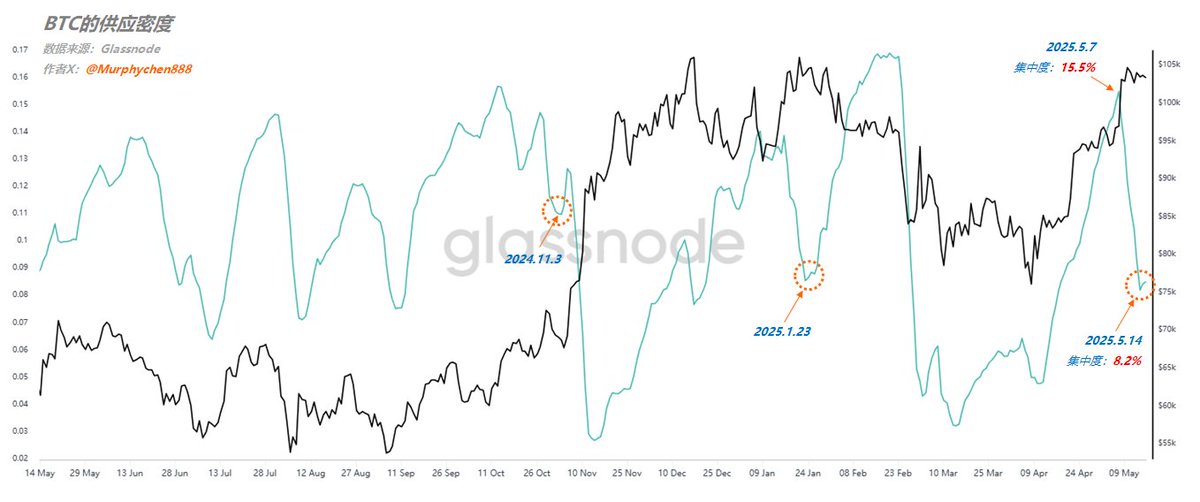
From May 7th to May 14th, BTC's chip concentration dropped from a high of 15.5% to 8.2% within just 7 days. This indicates that as the price rose, it gradually moved away from the chip concentration area.
If the concentration curve continues to decline, the price is likely to continue rising. However, we noticed that after May 14th, the concentration curve suddenly stopped declining around 8.2% and seemed to be about to turn upward again. An 8.2% density is neither high nor low. If the price falls back to the concentration area, the concentration curve will quickly rise and brew greater volatility. Similar to the annotation on the chart on 2025.1.23, where the price correction caused the concentration to drop from a high position and then turn upward midway, subsequently amplifying price volatility. Another possibility is that the price continues to rise, and the concentration curve simply pauses briefly before continuing to decline. Similar to the situation annotated on the chart on 2024.11.3.
In summary, the current concentration curve does not smoothly decline but instead pauses midway, bringing uncertainty to market direction. Through this indicator, we can hardly guess whether to go long or short; it only tells us that the market may be about to choose a direction. However, when the concentration rises to a certain height, considering going long on volatility would be a good choice.