Author: Nancy Lubale, CoinTelegraph; Translated by: Bai Shui, Jinse Finance
Summary
Bitcoin price is pulling back, but strong ETF inflows, high network activity, and whale accumulation indicate that BTC is poised to break through $140,000.
Spot Bitcoin ETFs have seen net inflows of $2.9 billion in two weeks, continuing the previous upward trend.
Declining exchange balances and increasing Z-values of trading volume suggest overall demand is growing.
Over the past 24 hours, Bitcoin price has dropped by 1.4%. Its trading price has fallen 6% from the historical high of $109,000 on January 20th. Nevertheless, some fundamental, on-chain data, and technical indicators suggest that Bitcoin's upward potential is not yet exhausted.
Spot Bitcoin ETF Inflows Align with BTC Historical Momentum
Bitcoin's latest rally is accompanied by strong investor demand for spot Bitcoin exchange-traded funds (ETFs), with net inflows reaching $2.9 billion over the past two weeks.
The chart shows that since the launch of US spot Bitcoin ETFs in January 2024, these investment products have seen net inflows of approximately $8.5 billion between February 13, 2024, and March 13, 2024, with a peak daily inflow of $1.045 billion on March 12, 2024.
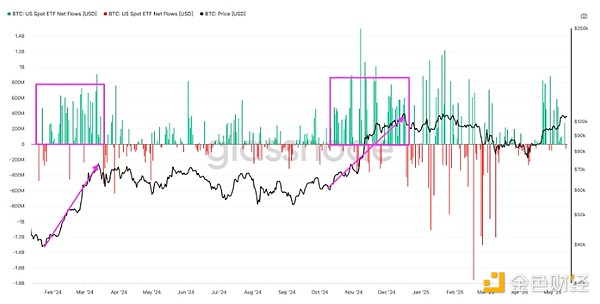
Spot Bitcoin ETF fund flows. Source: glassnode
Similarly, during the period from November 6, 2024, to December 16, 2024, cumulative daily inflows reached $5.7 billion, consistent with Bitcoin's price surge from $67,000 to $108,000, a rise of 60%.
If ETF inflows continue, Bitcoin is likely to resume its upward trend and set new historical highs.
Bitcoin Market Volatility Index: Risk Appetite
Increased funds flowing into spot Bitcoin ETFs indicate high risk appetite sentiment, as evidenced by the decline in the Chicago Board Options Exchange (CBOE) Volatility Index (VIX). This index measures the 30-day market volatility expectation.
Bitcoin network economist Timothy Peterson emphasized that the VIX index has dramatically dropped from 55 to 18 over the past 25 trading days.
A VIX index below 18 signifies a "risk appetite" environment, which is favorable for assets like Bitcoin.
The analyst stated: "This will remain a 'risk appetite' environment in the foreseeable future."
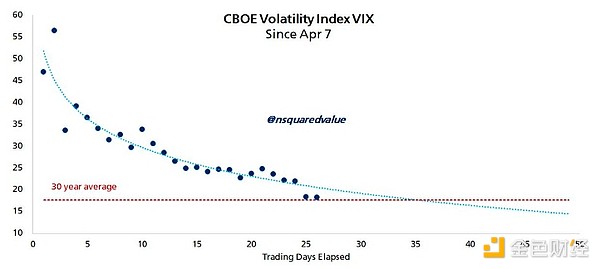
Chicago Board Options Exchange Volatility Index. Source: Timothy Peterson
Peterson's model, with a 95% accuracy rate, predicts a target price of $135,000 within the next 100 days if the VIX remains low.
Continued Strong Bitcoin Accumulation
Bitcoin whales' accumulation behavior reinforces risk appetite sentiment, with continued accumulation even as prices rise. glassnode data shows that the Bitcoin Accumulation Trend Score (ATS) is 1 (see below), indicating that large investors are actively accumulating.
According to glassnode, the surge in trend scores indicates that almost all groups are shifting from distribution to accumulation. This shift is similar to the accumulation pattern observed in October 2024 when Donald Trump was elected president, and Bitcoin's price surged from $67,000 to $108,000.

Bitcoin Cumulative Trend Score. Source: glassnode
Supplementary data from Santiment shows that addresses holding 10 to 10,000 BTC have accumulated a total of 83,105 BTC in the past 30 days.
Santiment posted on the X social platform on May 13th:
"With these large wallets actively accumulating, breaking through the coveted $110,000 historical high for Bitcoin is likely just a matter of time, especially after the temporary suspension of tariffs between China and the US."
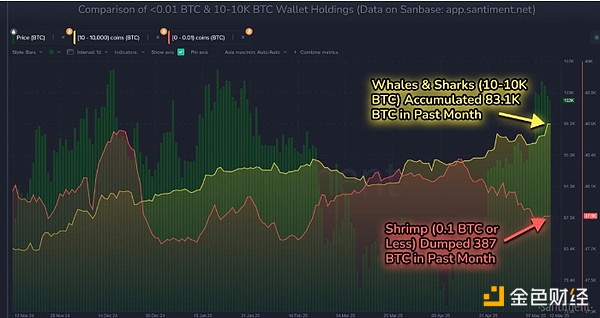
Bitcoin 10-10,000 BTC Holding Chart. Source: Santiment
Overall, this is a positive signal, as continued accumulation indicates bullish sentiment among these investors.
Declining Bitcoin Exchange Balances
On May 15th, exchange Bitcoin balances dropped to 2.44 million coins, the lowest level in six years. According to the chart, over 110,000 Bitcoins have been transferred from exchanges in the past 30 days.
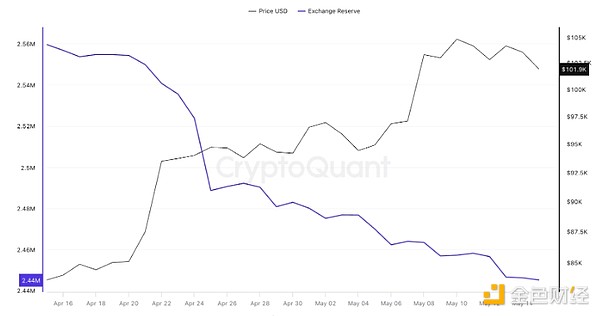
BTC Reserves on Exchanges. Source: CryptoQuant
Decreasing exchange Bitcoin balances suggest that investors may be withdrawing tokens to self-custody wallets, indicating a lack of intention to sell in anticipation of future price increases.
Increased Network Activity
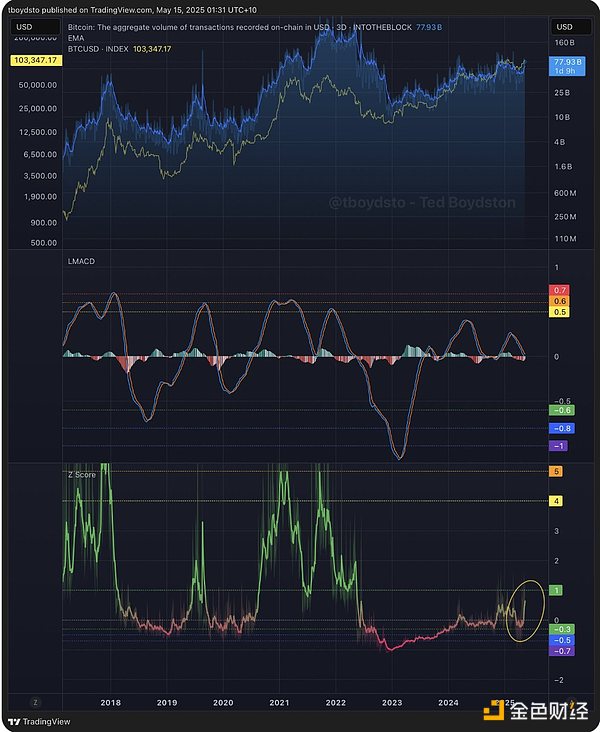
As cryptocurrency investor Ted Boydston highlighted in an X post on May 15th, Bitcoin's upward potential is supported by increased network activity.
The Bitcoin Transaction Volume Z-value measures the difference between current transaction volume and average transaction volume. It is typically used to gauge network activity and market interest.
The chart shows that this indicator has sharply risen from the negative value area, approaching 1. Historically, an increase in the transaction volume Z-value, especially near or above 1, has been associated with Bitcoin price increases.
"This is a good omen for Bitcoin's price acceleration," Boydston commented, adding, "Once the Z-value breaks through 1, Bitcoin should enter a bull market."
BTC Rounded Bottom Formation Target Price of $140,000
From a technical perspective, Bitcoin price has formed a rounded bottom pattern on the daily chart (see below). Bulls are currently focused on pushing the price above the dominant pattern's neckline at $106,660.
If the daily candle closes above this level, it will confirm a bullish breakout of the rounded bottom formation, leading BTC into a price discovery phase with a technical target price of $140,000, a 37% increase from the current level.
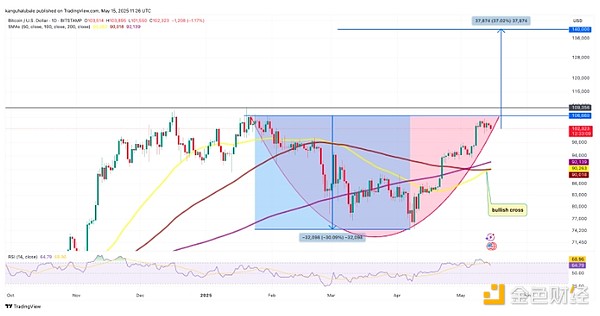
BTC/USD Daily Chart. Source: TradingView
The Relative Strength Index (RSI) is at 70 and shows a bullish crossover with SMA, indicating that the market environment remains favorable for upward movement, with prices potentially breaking through $140,000.
BTC price has broken through the bull flag on the weekly chart, with an expected rebound to $150,000.


