

Author: ChandlerZ, Foresight News
Original Title: Bitcoin Breaks Historical High, Will the Bull Market Cycle Replay?
On May 22, 2025, BTC price surged and broke through 110,000 USDT, refreshing the historical high of 109,599 USDT on January 20. This scene inevitably reminds one of the fragment from November 2021. At that time, Bitcoin quickly fell back after briefly crossing the early-year high point, thereby initiating a long and profound bear market cycle. Now the market seems to be pushed to a turning point of fate again: Will it break through further and open a new round of upward space, or will it, like history repeating itself, fall into a Double Top pattern after a "false breakthrough" and ultimately welcome a deep callback?

This is a question Bitcoin cannot avoid whenever it approaches historical highs. In past bull market cycles, we repeatedly saw similar structures: market emotions become excited, and discussions about whether the "cycle peak has arrived" emerge one after another. In this round, although the rise and rhythm seem familiar, the deeper market structure has significantly changed.
Price is replaying, but the market is no longer the same. In this context, should we continue to believe that the "cycle law" brought by halving still dominates Bitcoin's destiny? Or should we acknowledge that a new rhythm has quietly unfolded in ETF funds, on-chain structures, and macro narratives?
Returning to the most essential observation method, perhaps on-chain data, historical mirrors, and behavioral traces can still provide some cyclical insights. Is this wave of rise the final sprint of cycle inertia, or a new starting point after restructuring the cycle structure? Perhaps the answer is hidden in the context of the data.
Is the Market Repeating Historical Paths?
Bitcoin's historical price trend, though volatile, can roughly be divided into typical cycles of "halving-driven + bull-bear rotation":

Since 2011, Bitcoin's price has always evolved repeatedly following the logic of "halving-driven—supply-demand imbalance—bull market outbreak—top callback", with each cycle ending at a higher price peak. The Double Top structure in 2021 is undoubtedly the most cautionary precedent.
Bitcoin first created a staged high point in April 2021, driven by multiple positive factors like Coinbase's listing, continued loose monetary policy, and ongoing Gray GBTC accumulation. Market sentiment was high, and the price broke through the $60,000 mark for the first time. However, this high point did not last long. After entering May, with the Federal Reserve releasing forward signals of tapering and rate hikes, coupled with China's large-scale policy risks of expelling domestic mining farms, the Bitcoin market quickly fell into callback, dropping to around $30,000 within less than three months, completing a mid-section deep adjustment.
A few months later, the market gradually digested negative emotions and rebounded from the bottom. Driven by positive narratives like El Salvador officially adopting Bitcoin as legal tender, some investors viewing it as a potential hedge tool amid global inflation concerns, and strong optimistic expectations about the first Bitcoin futures ETF in the US, it regathered momentum and briefly peaked at around $69,000 on November 10, then quickly fell back, forming a clear "Double Top structure" spanning several months with the April high point.
Ultimately, this triple resonance of price creating new highs, on-chain active realization, and demand shrinkage constituted a typical "false breakthrough" pattern. Bitcoin quickly fell back after briefly topping, initiating a downward cycle. This structure technically presented as "local new high + volume divergence + instant reversal", a typical Double Top top signal, which provides an important precedent for the current market stage approaching historical highs.
Will History Converge?
The current trend's slope and form are quite similar to the eve of November 2021. More notably, multiple on-chain indicators are releasing structurally convergent signals.
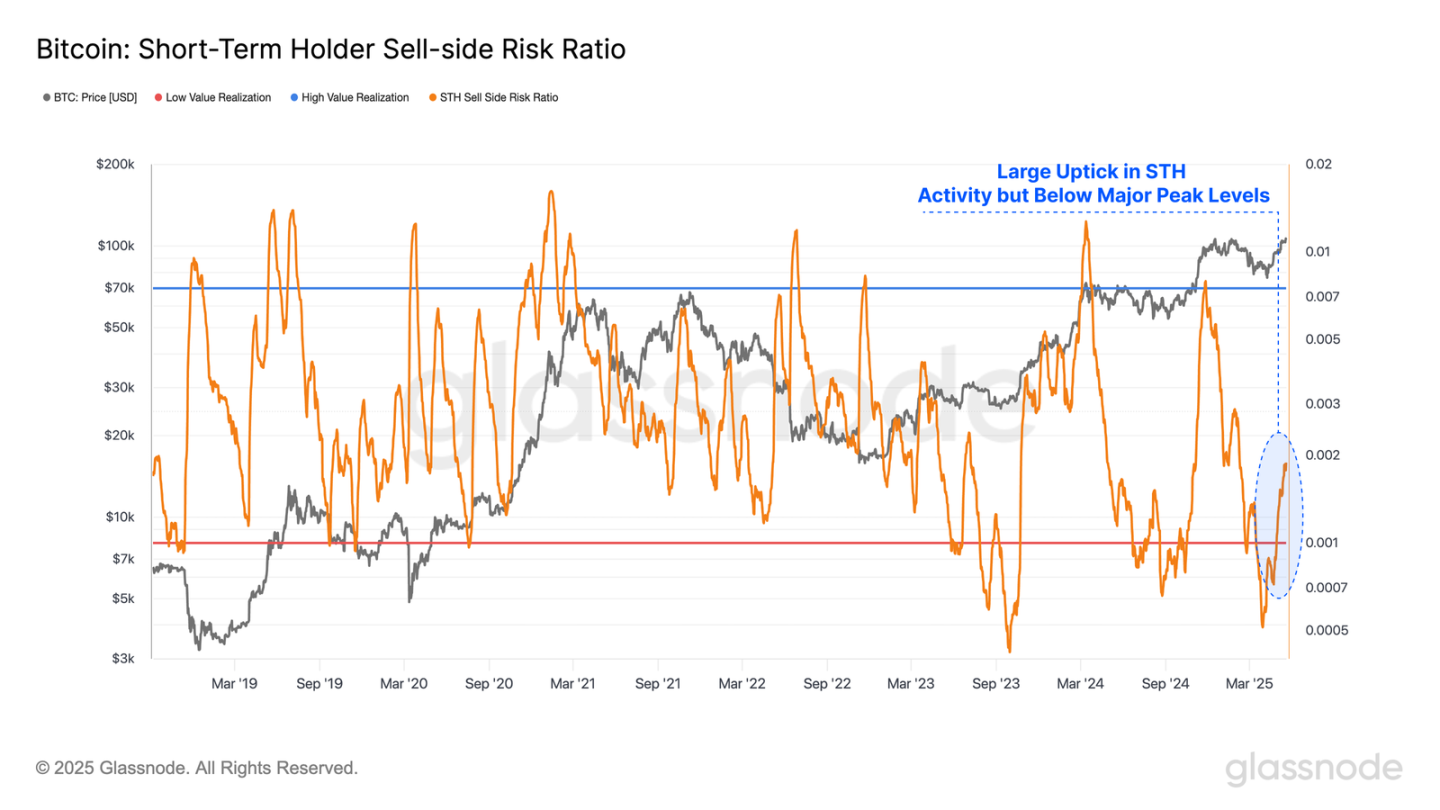
The latest data shows that long-term holders' MVRV has risen to 3.3, approaching Glassnode's defined "greed red zone" (above 3.5); short-term holders' MVRV has also significantly increased from the low point of 0.82 to 1.13, meaning most short-term funds have re-entered the profit zone. From a behavioral finance perspective, this structural change is a necessary condition for forming top pressure: when most investors return to a surplus state, the desire to realize profits often increases simultaneously.

However, from the perspective of on-chain structure's "seller behavior pressure", although the current short-term investors' seller risk ratio shows a significant increase, indicating some profit-taking actions on-chain, the overall value remains at a historically medium-low level. This state reflects that while investor sentiment has warmed up and some funds choose to take profits in the profit zone, the overall market has not yet entered an imbalance state dominated by "collective realization momentum".
This means that while upward space is initially suppressed, the market is not out of control. As long as liquidity remains stable subsequently, the market still has conditions to continue a structural upward trend, rather than being pushed to the ultimate top.
Overall, long-term holders' behavior has always been the most reliable slow variable signal in Bitcoin cycle judgment. Whether in 2013, 2017, or 2021, each bull market's endpoint was almost accompanied by these investors' concentrated distribution, and new bull market cycles often began with their re-accumulation.
The current trend has entered Bitcoin's fifth major cycle. If long-term holders have not yet begun a new round of position replenishment, this might mean the market is still in the top area or still constructing a high-position Double Top structure.

How Will the Future Trend?
According to on-chain analyst @Murphychen's calculation method, using BTC's MVRV for assessment, as MVRV essentially represents the relationship between funds and costs.
Bitcoin has always followed the principle of large-scale MVRV and spot price divergence over the past decade: once a phenomenon of higher prices but lower MVRV appears, the indicator cannot break through the previous high, and the price space will be suppressed.
The logic behind this is that as the turnover cost becomes higher, pushing the price higher requires exponential fund increments.
In this round, the MVRV highest point appeared on March 11, 2024, with BTC price at $72,000 and MVRV at 2.78. Subsequently, whether on December 17 or January 21, even though BTC price created new highs, MVRV never broke through 2.78.
Therefore, for this BTC to reach for the stars, the first and most important step is to break the large-scale MVRV divergence. Based on the current RP dynamic value calculation, it requires BTC price to break through $125,500.


