Written by: Aayush Jindal, News btc
Compiled by: Jessica, Techub News
Bitcoin price is attempting to break through the $120,000 mark and initiate a new round of growth. Currently, BTC is in a consolidation phase and may steadily move towards the $125,000 area.
- Bitcoin launched a new rally from the $115,800 support zone.
- The current price is maintained above $119,000 and is positioned above the 100-hour simple moving average.
- The BTC/USD hourly chart (data source: Kraken) shows that the price has broken through the bearish trend line at $119,000 resistance.
- If successfully breaking the $120,500 resistance area, this currency pair may initiate a new round of growth.

Bitcoin Price Brewing a New Upward Movement
Bitcoin price began a pullback from the historical high of $123,200, falling below the $120,000 mark and dropping to the $115,500 support zone.
After forming a low point at $115,730, the price is attempting to restart its upward trend. Bullish momentum has pushed the price to break through the $118,000 and $118,500 resistance levels and stand above the 50% Fibonacci retracement of the decline from the swing high of $123,140 to the low of $115,730.
Moreover, the BTC/USD hourly chart shows a breakthrough of the bearish trend line at the $119,000 resistance. Bitcoin is currently trading above $119,500 and is positioned above the 100-hour simple moving average.
The initial resistance is near $120,200. The first key resistance is in the $121,400 area, which is close to the 76.4% Fibonacci retracement of the decline from the swing high of $123,140 to the low of $115,730. The next resistance is at $123,150.
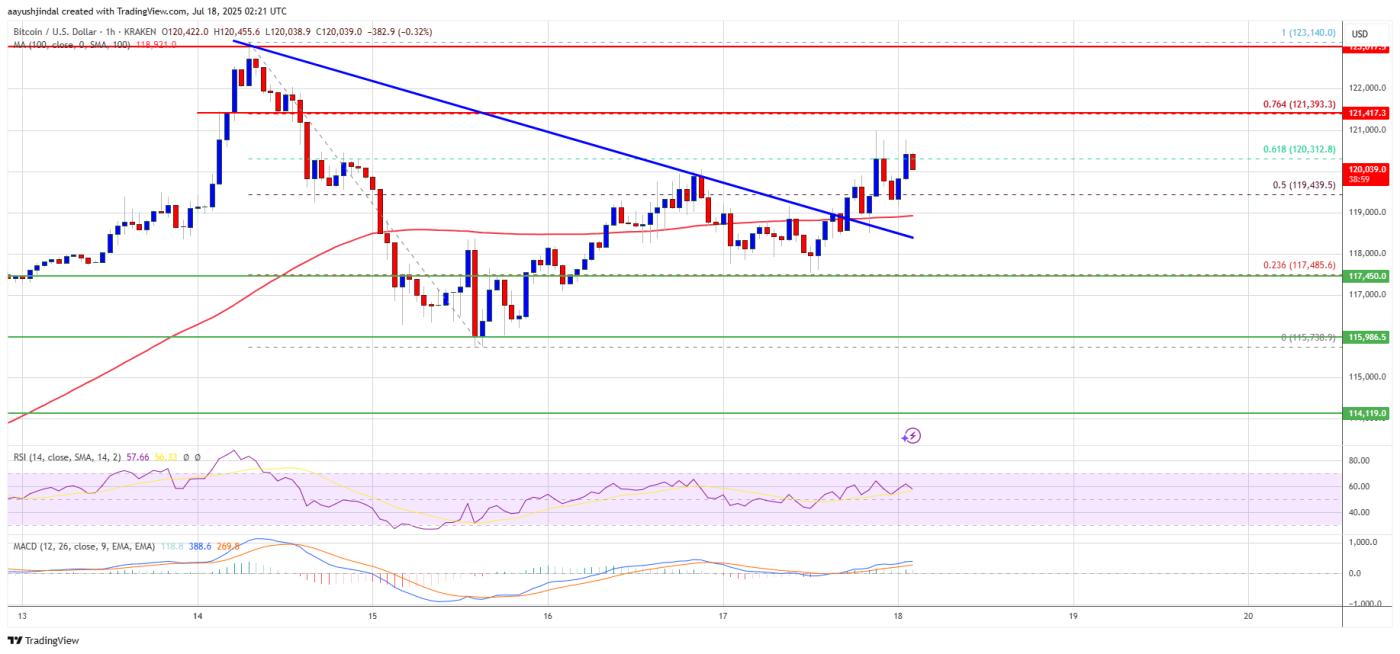
(Chart source: TradingView.com BTCUSD)
If the closing price breaks through the $123,150 resistance, the price may continue to rise. In this case, the price might test the $124,200 resistance. Continued advancement could push the price towards the $125,000 mark, with the main target potentially reaching $126,200.
Will Bitcoin Experience Another Pullback?
If Bitcoin fails to break through the $121,400 resistance area, it may initiate a new round of decline. The current immediate support is at the $119,000 level near the 100-hour moving average, with the primary key support in the $117,500 area.
The next support is currently at the $115,500 zone. If it continues to fall, the price may further test the $113,500 support in the short term. An important support is at $110,500, and if this level is breached, BTC may continue its downward trend.
Technical Indicators Show:
Hourly MACD: The indicator's momentum is weakening in the bullish area
Hourly RSI: The RSI for BTC/USD is currently maintained above the 50 level
Major Support Levels: $117,500, followed by $115,500
Major Resistance Levels: $121,400 and $123,150