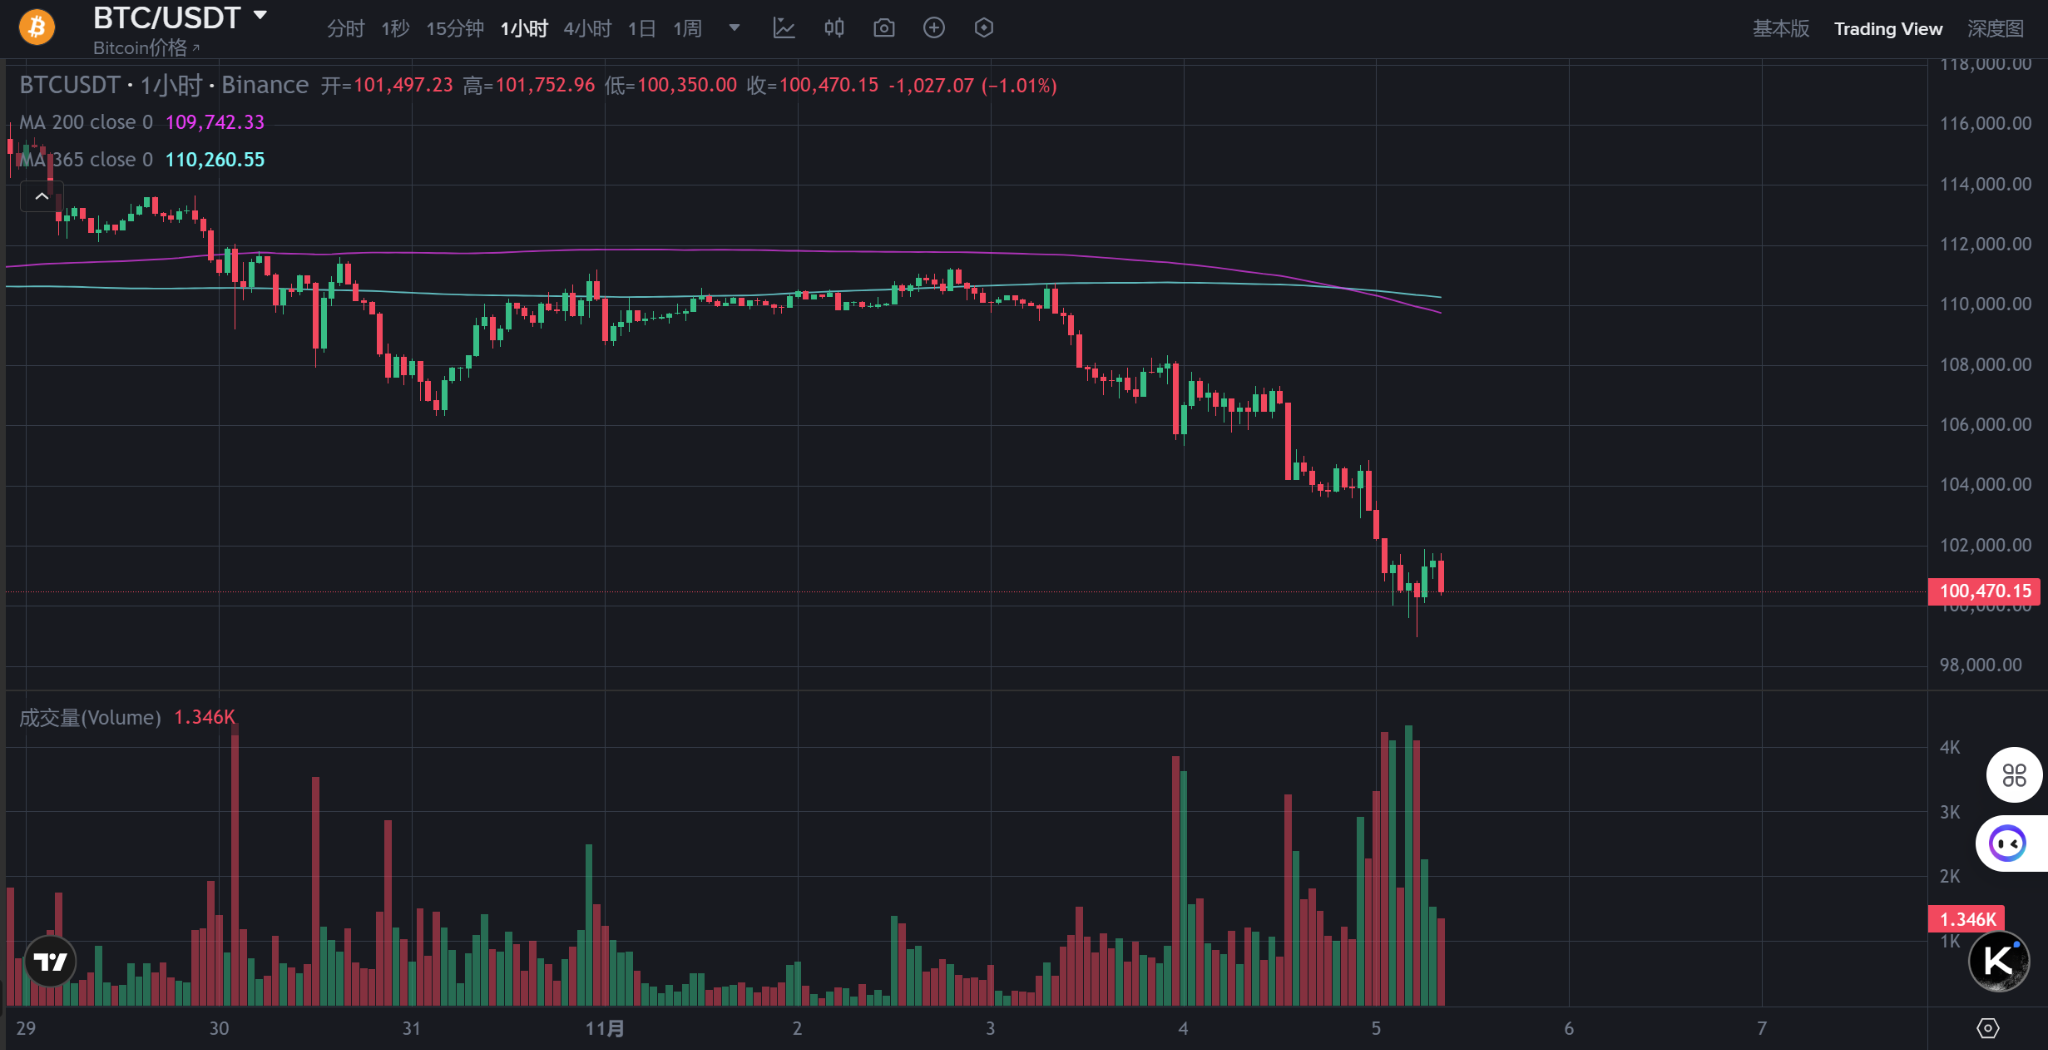
Bitcoin prices briefly fell below the psychological level of $100,000 in the early hours of Wednesday Beijing time, marking the first time this key support level has been breached since June 23.
As of press time, Bitcoin was trading at $100,470, down 6% on the day, while Ethereum was down nearly 10%, trading at $3,236.
This crash resulted in 470,000 people being liquidated across the internet in the past 24 hours, with liquidation amounting to over $2 billion, of which long positions accounted for 85% of the losses.
This wave of liquidations, which began in mid-October, has wiped out billions of dollars in long positions, and traders are still on the sidelines, hesitant to re-enter the market.
The market crash triggered a chain reaction of leveraged liquidation.
Data shows that Bitcoin fell from about $112,000 at the beginning of the week to around $105,000, wiping out hundreds of billions of dollars in market value in 24 hours.
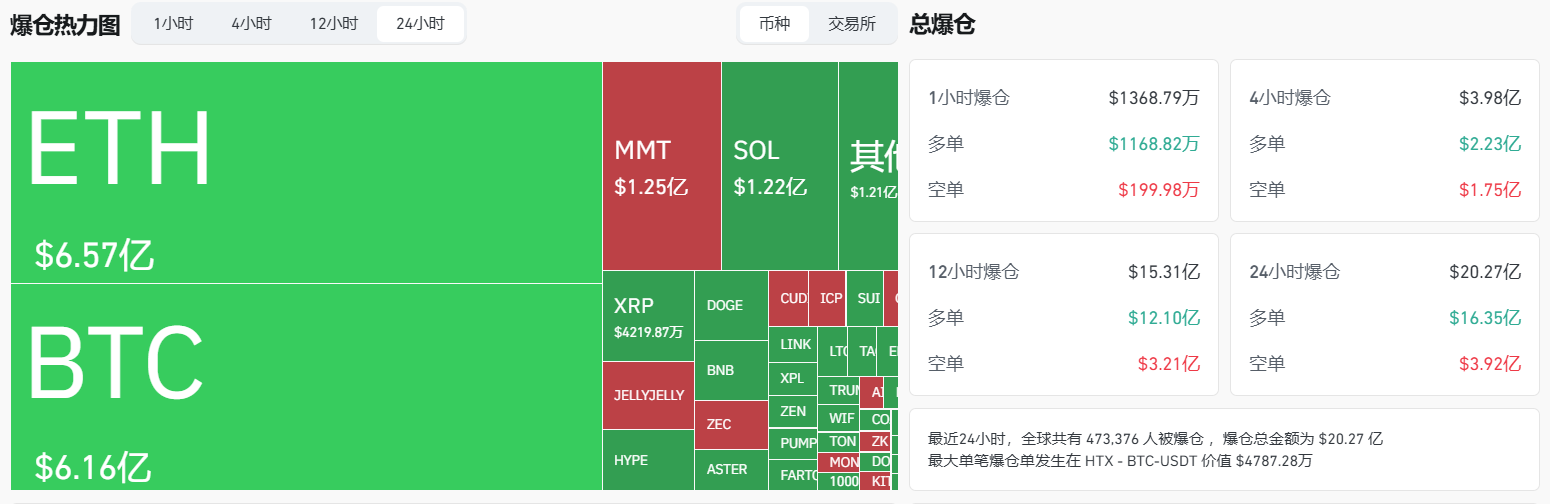
The most direct trigger for this crash was the mass liquidation of leveraged long positions. During Bitcoin's drop from $112,000 to $105,000, approximately $1.1 billion worth of futures contracts were liquidated, 90% of which were long positions.
When a large number of long positions are liquidated, the market is forced to sell off, triggering a chain reaction that amplifies selling pressure and causes prices to fall further, creating a typical "stampede effect." This is not a crash caused by a black swan event, but rather an "automatic liquidation" of the market's own excessive leverage and over-bubbling.
Jordi Alexander, CEO of cryptocurrency trading and market-making firm Selini Capital, pointed out that the crypto market is in a "hangover phase" following the October liquidation shock.
In his view, rebuilding the destroyed capital base will take time, and investor sentiment remains cautious. The market must first demonstrate that a convincing price bottom is about to form before it can attempt to break upwards again.
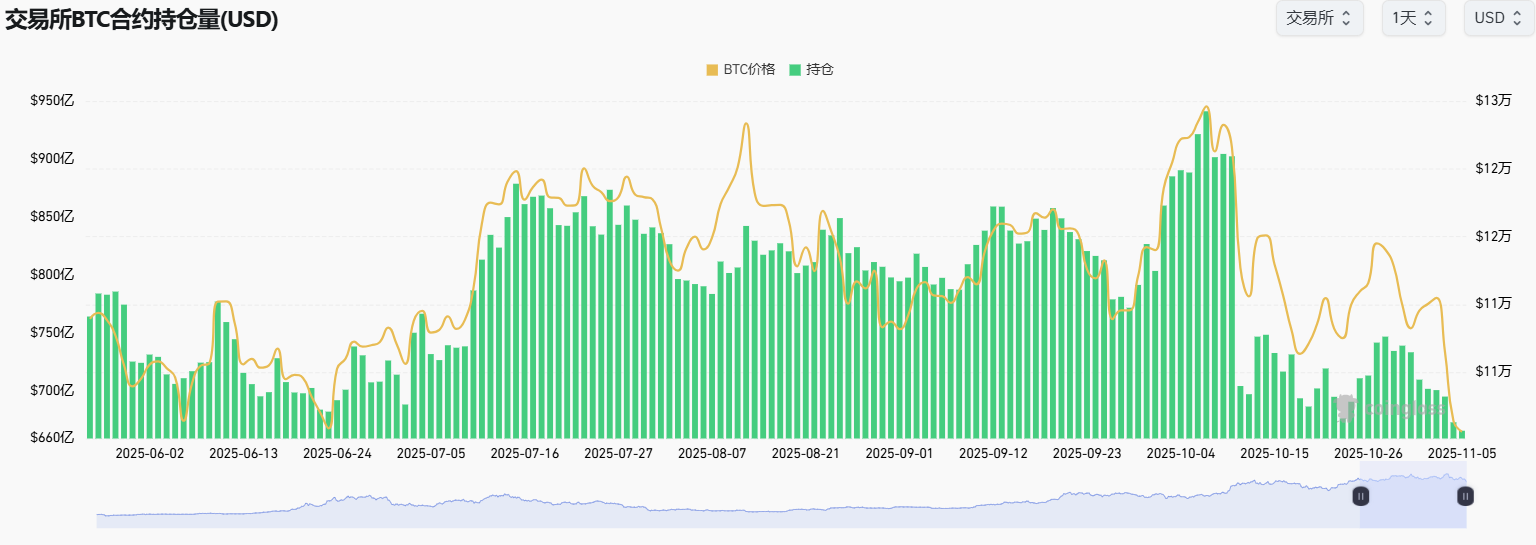
Bitcoin futures open interest remains well below pre-crash levels, and even with improved financing costs, very few people are willing to re-enter the market.
As a result, Bitcoin has risen less than 8% this year, significantly lagging behind stock performance, and its effectiveness as a portfolio hedging tool has been less than satisfactory.
Increased macroeconomic pressures and weakened institutional demand
From a macro perspective, the current decline is underpinned by subtle shifts in Federal Reserve policy. Recent hawkish signals from several Fed officials have rapidly cooled market expectations for a year-end rate cut.
Risk assets generally retreated, with technology stocks and cryptocurrencies bearing the brunt. Lin Tran, market analyst at XS.com, pointed out that expectations for a Fed rate cut in December have fallen significantly, meaning that the high-interest-rate environment may persist for longer. This "drives up the opportunity cost of holding non-yielding assets like Bitcoin, while suppressing short-term speculative momentum."
High interest rates mean tighter liquidity, and investors tend to shift funds back to stable assets such as bonds or cash, naturally drawing "hot money" away from the crypto market. This macroeconomic pressure coincides with signs of weakening institutional demand for Bitcoin.
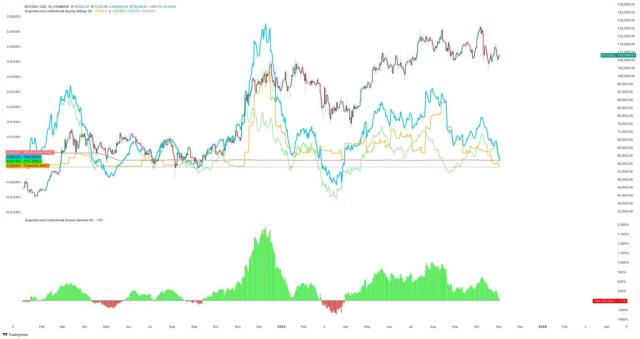
Charles Edwards, founder of Capriole Investments, pointed out that institutional demand for Bitcoin has fallen below the rate of new coin mining for the first time in seven months.
This shift suggests that large buyers may be backing down, and along with other market activity, points to a risk-averse tone across the cryptocurrency market.
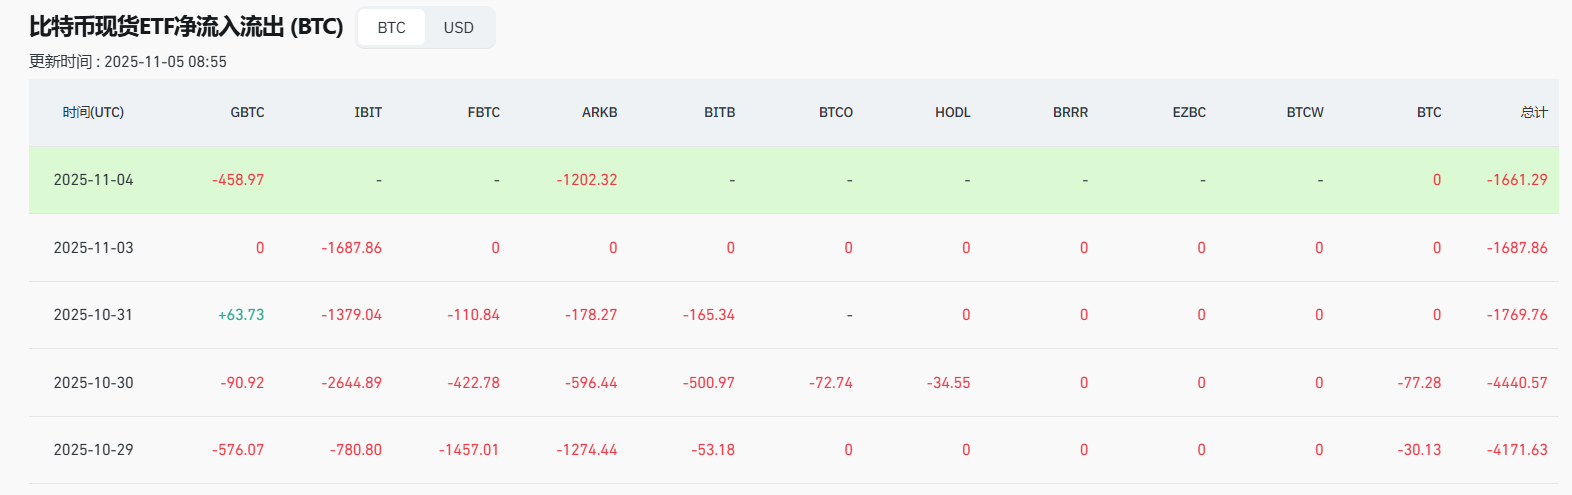
Over the past five trading days, investors have withdrawn more than $1.8 billion from Bitcoin and Ethereum spot ETFs. This outflow highlights temporary weakness in institutional demand, exacerbating downward pressure on the market.
Technical breakdown, key support level breached.

From a technical analysis perspective, Bitcoin consolidated around $110,000 for nearly two weeks, a level that was originally a short-term support zone. However, when the price quickly fell below $110,000, stop-loss orders from technical traders and sell signals from quantitative models were triggered. Market sentiment cooled, and predictions of a drop to $100,000 began circulating on social media, further amplifying the downward trend.
This cycle of "breakdown - stop loss - further decline" is a common accelerated pullback pattern in the later stages of a bull market.
Compass Point analyst Edel Engel stated that retail investors may not be as actively buying on dips as they have in the past. In a report, he noted, "While selling by long-term holders is common in bull markets, retail spot buyer participation is lower than in previous cycles." The analyst believes this decline could further drag down Bitcoin's price, potentially breaking below the key $100,000 support level.
With long-term holders still selling, there is a greater downside risk if short-term holders sell further. Options market data also shows that traders have built substantial hedges against further declines.
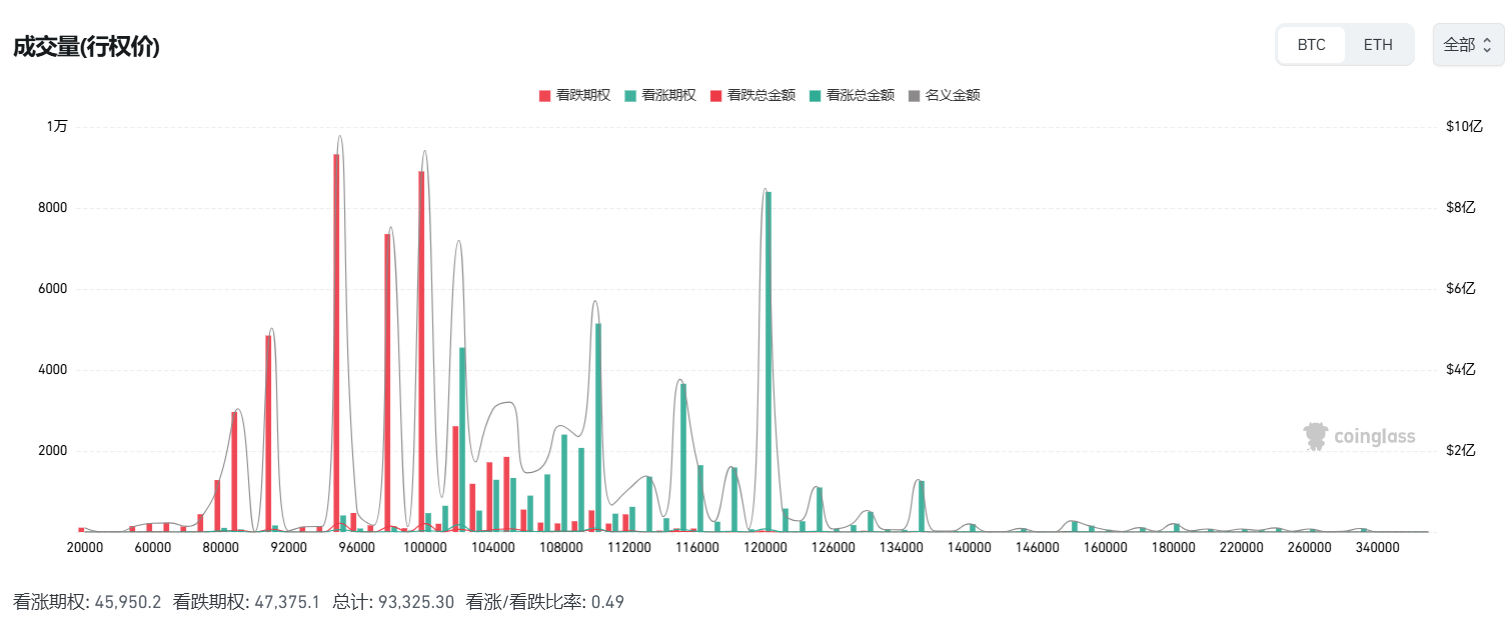
According to Deribit data, demand is strongest for put options contracts with a strike price of $80,000 and expiring in late November. This reflects the market's pessimistic outlook on Bitcoin's short-term prospects.
Historical analogy and market sentiment indicators
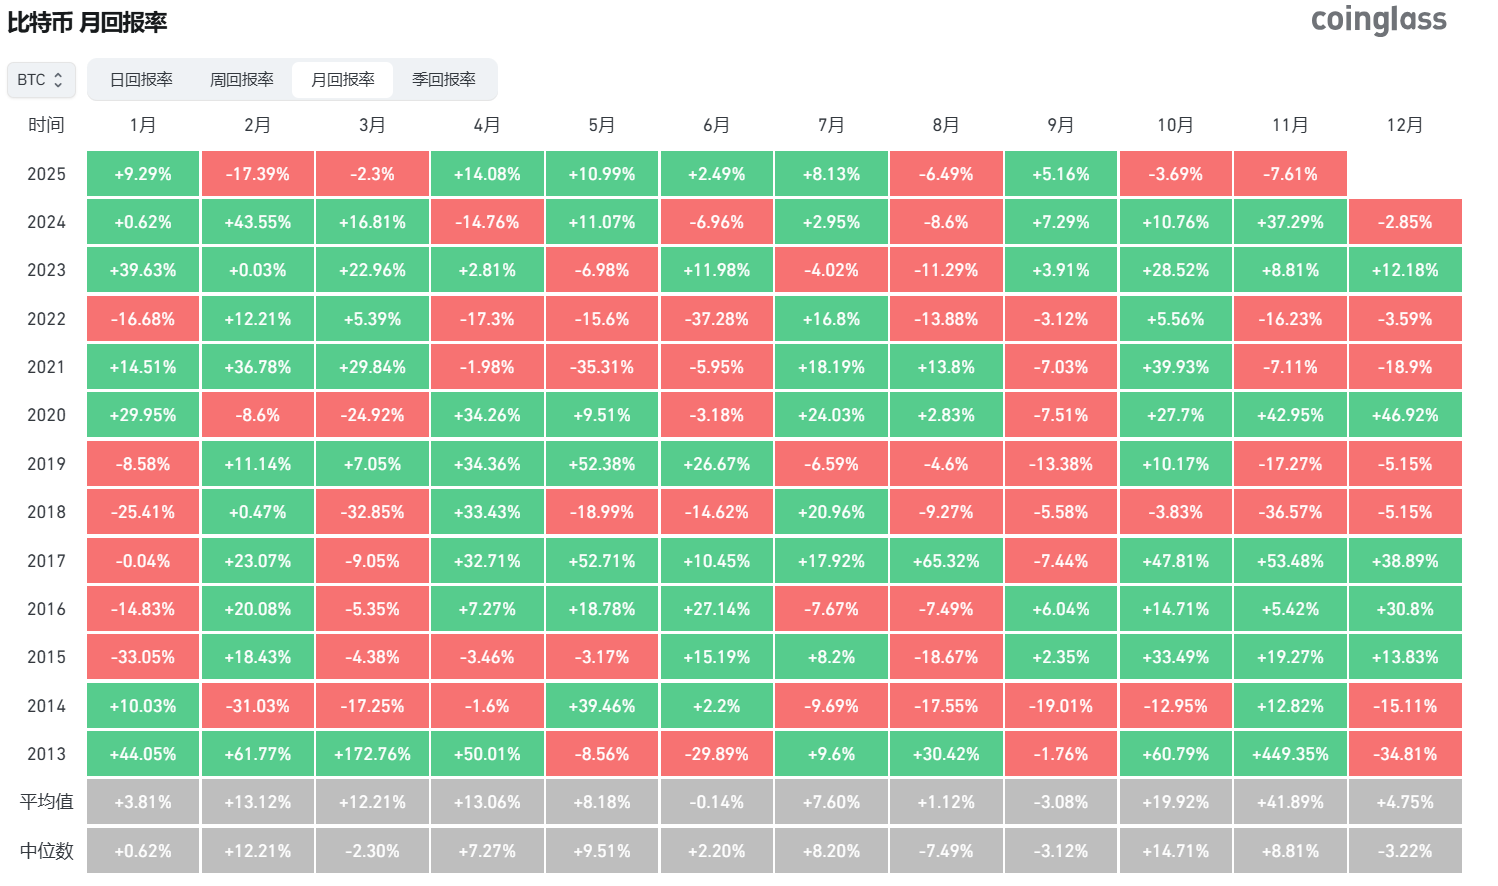
Historically, Bitcoin's strong upward trend in October has not materialized this year, according to seasonal data.
Edel Engel points out that the last time Bitcoin failed to benefit from a seasonal rally was in October 2018, when its price plummeted 37% in November of the same year. This historical analogy has exacerbated market anxieties. However, current market sentiment indicators are far from reaching levels that historically signaled significant tops in cryptocurrencies.
True market tops are typically accompanied by extreme euphoria and FOMO (fear of missing out), while current investors are more cautious and hesitant. The cryptocurrency fear and greed index has slipped into the "extreme fear" zone. Historically, when the market is gripped by extreme fear, it often presents a good opportunity for long-term investors to accumulate positions.
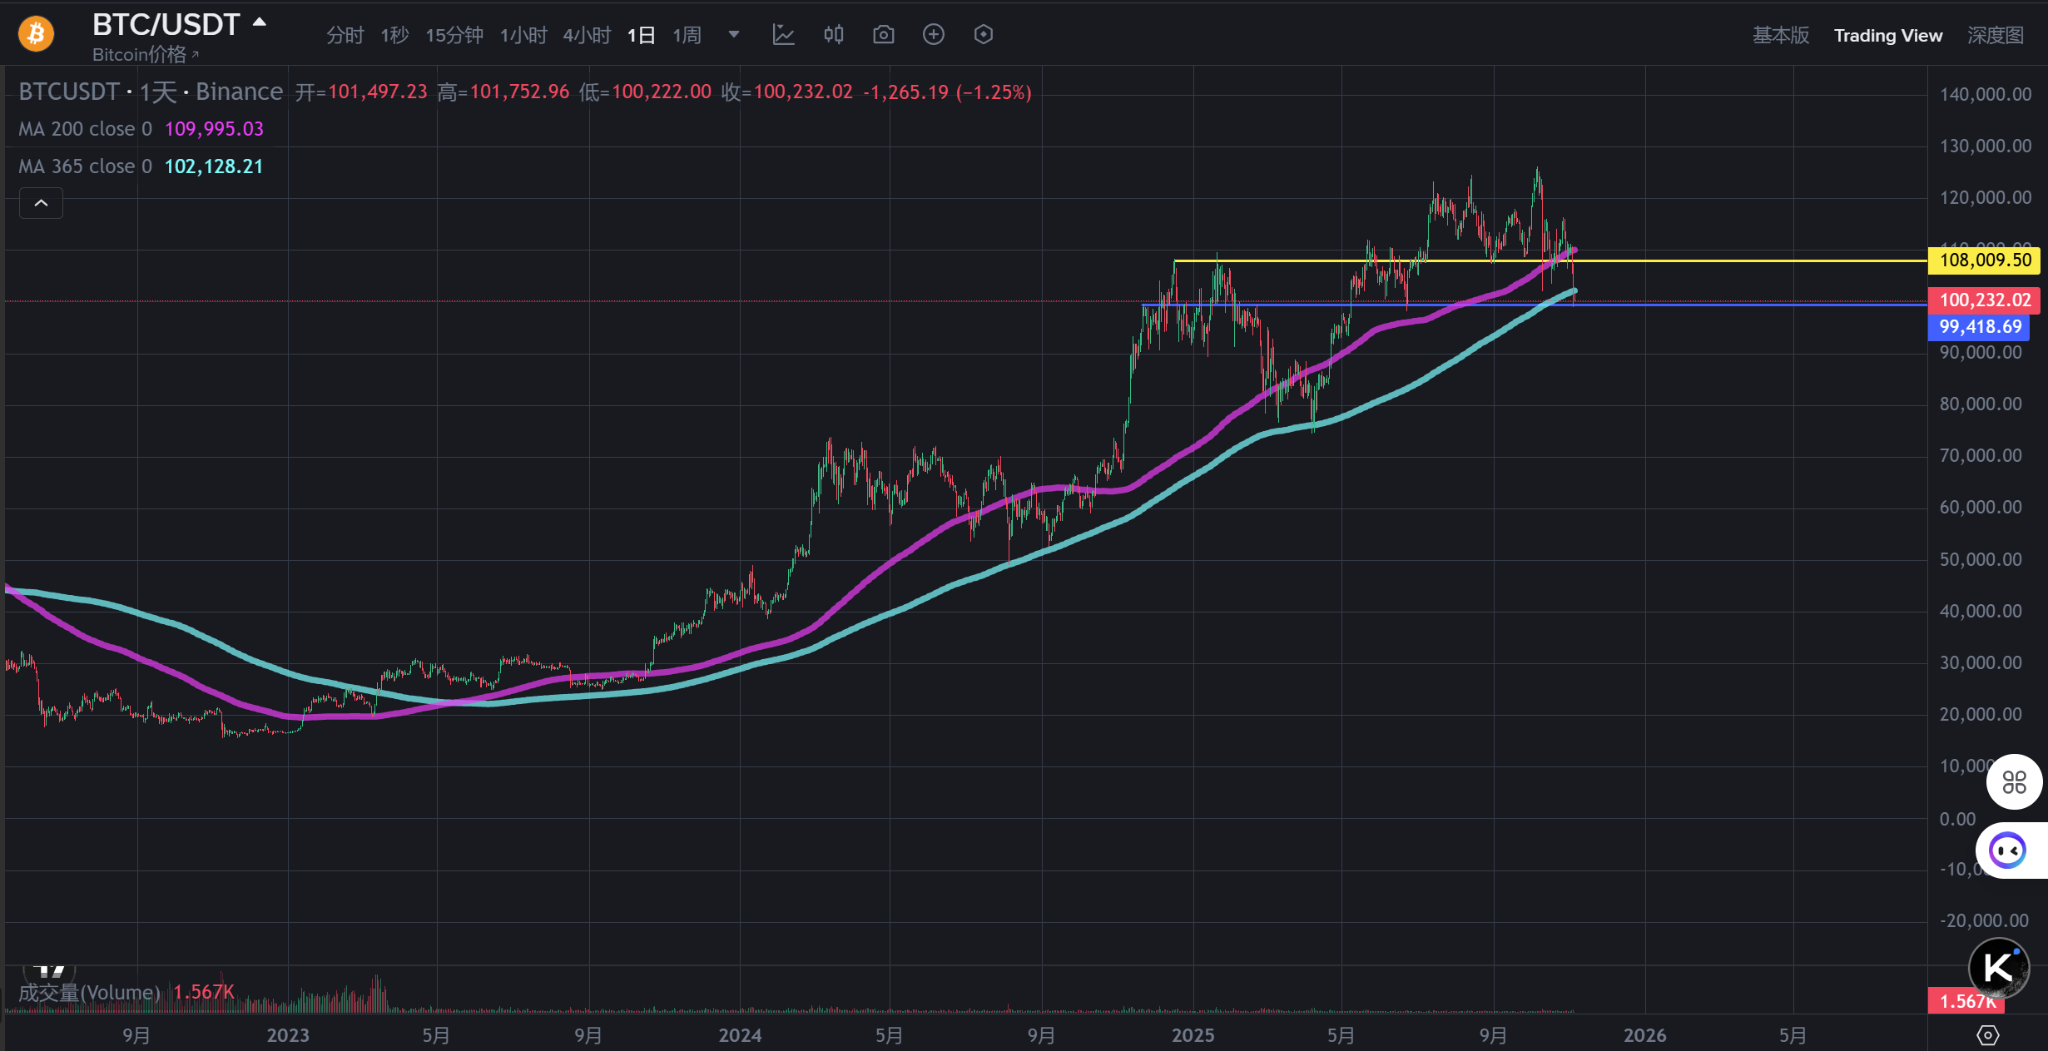
Bitcoin's key technical indicators haven't completely deteriorated. Although it has fallen below the 200-day moving average, the daily closing price hasn't fallen below the 365-day moving average, and it's still up about 8% since last December.
From a longer-term perspective, each bottom for Bitcoin has formed by consolidation between the 200-day and 365-day moving averages. This means that the upward trend since 2022—forming higher peaks and higher troughs—has not yet been broken.
Bottom prediction from a professional trader's perspective
There is disagreement among professional traders regarding the bottom of Bitcoin.
Renowned trader Horse stated that if the $100,000 level proves not to be a "trap," then the bottom may be near. His observations of Bitcoin price levels indicate that leveraged long positions reaching $100,000 face the risk of being absorbed, followed by relatively weak liquidity down to $88,000.
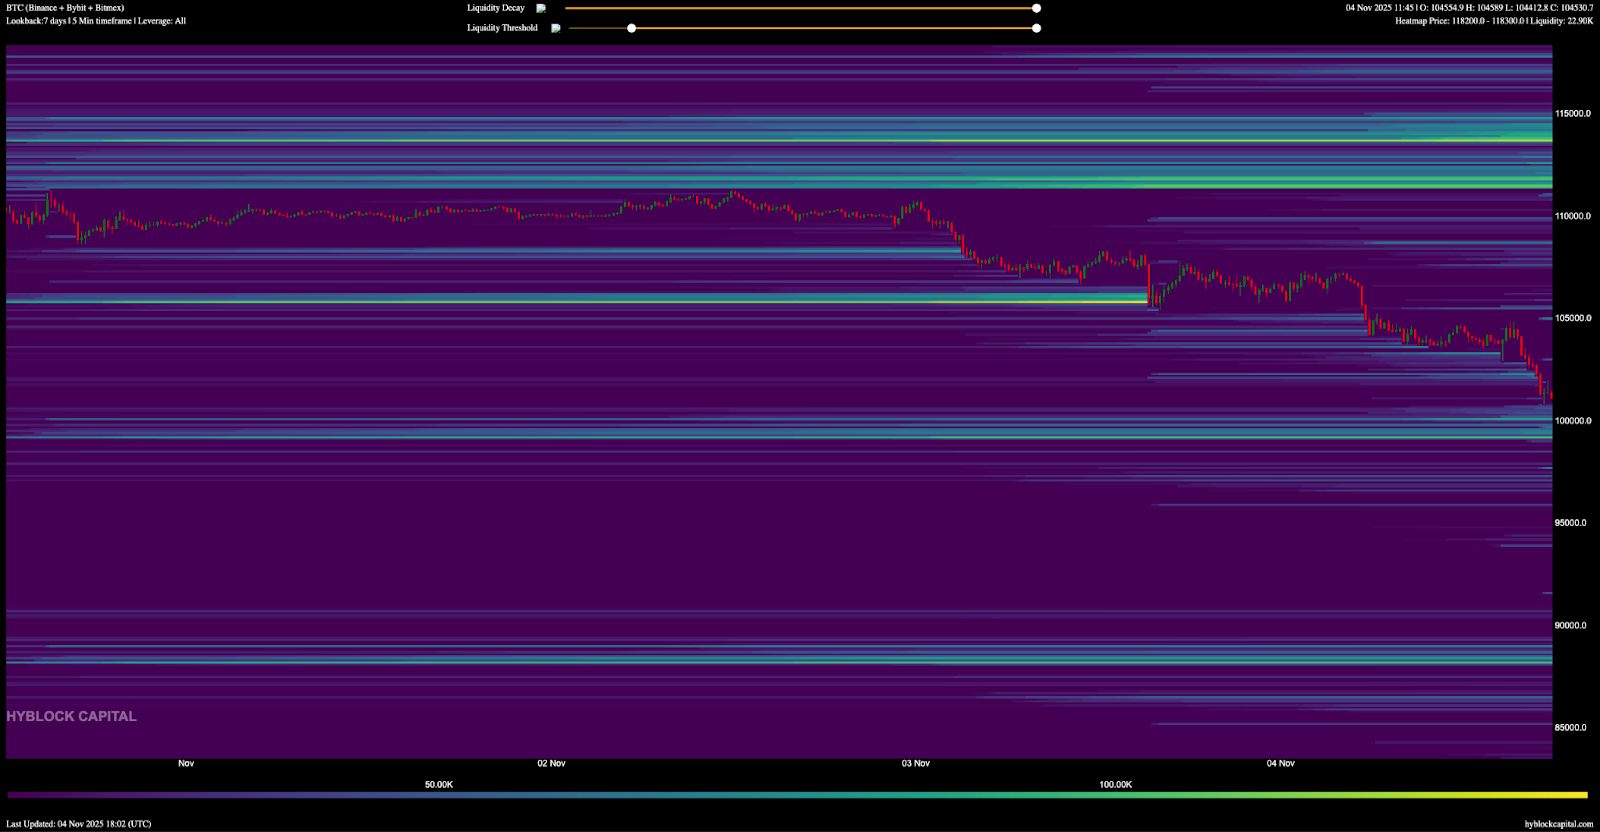 BTC/USDT Liquidation Heatmap, 7-Day Outlook: Source: Hyblock
Hyblock's liquidation heatmap data provides another dimension for judging market bottoms. The data shows that there are a large number of leveraged long positions at the $100,000 level. After these positions are absorbed, market liquidity will become relatively thin, down to the $88,000 level.
Institutional Perspective: Hope Born from Despair
Despite the weak market performance, some institutional investors remain optimistic about the long term.
Bitwise Chief Investment Officer Matt Hougan believes that retail crypto investors' selling pressure is nearing "exhaustion," and the bottom for Bitcoin's price is about to appear, sooner than expected. Hougan stated that retail investors are currently in a state of "extreme despair," with frequent leveraged liquidations and market sentiment hitting new lows; however, institutional investors and financial advisors remain bullish, continuing to invest in Bitcoin and other crypto assets through ETFs.
He believes that institutions are becoming the main driving force in the market. Strategy, a company holding over 640,000 Bitcoins with a total purchase cost of $47.49 billion, announced that it has acquired another 397 Bitcoins at a cost of approximately $45.6 million.
This move indicates that long-term holders are not panicking due to the price drop, but rather see it as an opportunity to accumulate shares.
Tom Lee of Ethereum's "micro-strategy" BMNR stated that despite recent market volatility, he still predicts Bitcoin could surge to $150,000 to $200,000 by the end of 2025. This long-term optimistic outlook contrasts sharply with short-term market panic.
As the price of Bitcoin fluctuates around $100,000, a fierce battle ensues between bulls and bears.
The market accumulation pattern shown by the Wyckoff method is consistent with the behavior of institutions continuously accumulating shares.
Every market panic can be a good opportunity for major funds to accumulate shares, while what ordinary investors need is the ability to see the truth of the market.