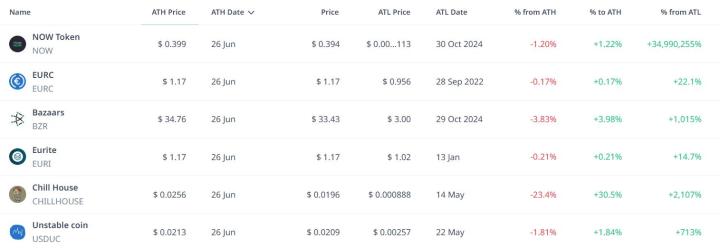
The cryptocurrency market is a high-volatility environment where highs and lows change rapidly within a day. By tracking tokens that have set new ATH (all-time high) and ATL (all-time low), one can detect bullish and bearish trends early. Based on tokens with a market capitalization of over $10 million, this article summarizes the main tokens that have set new highs or lows within a day and analyzes the market recovery potential and trends by examining the adjustment rate compared to the peak for top market cap tokens and real-time domestic popular assets. [Editor's Note]
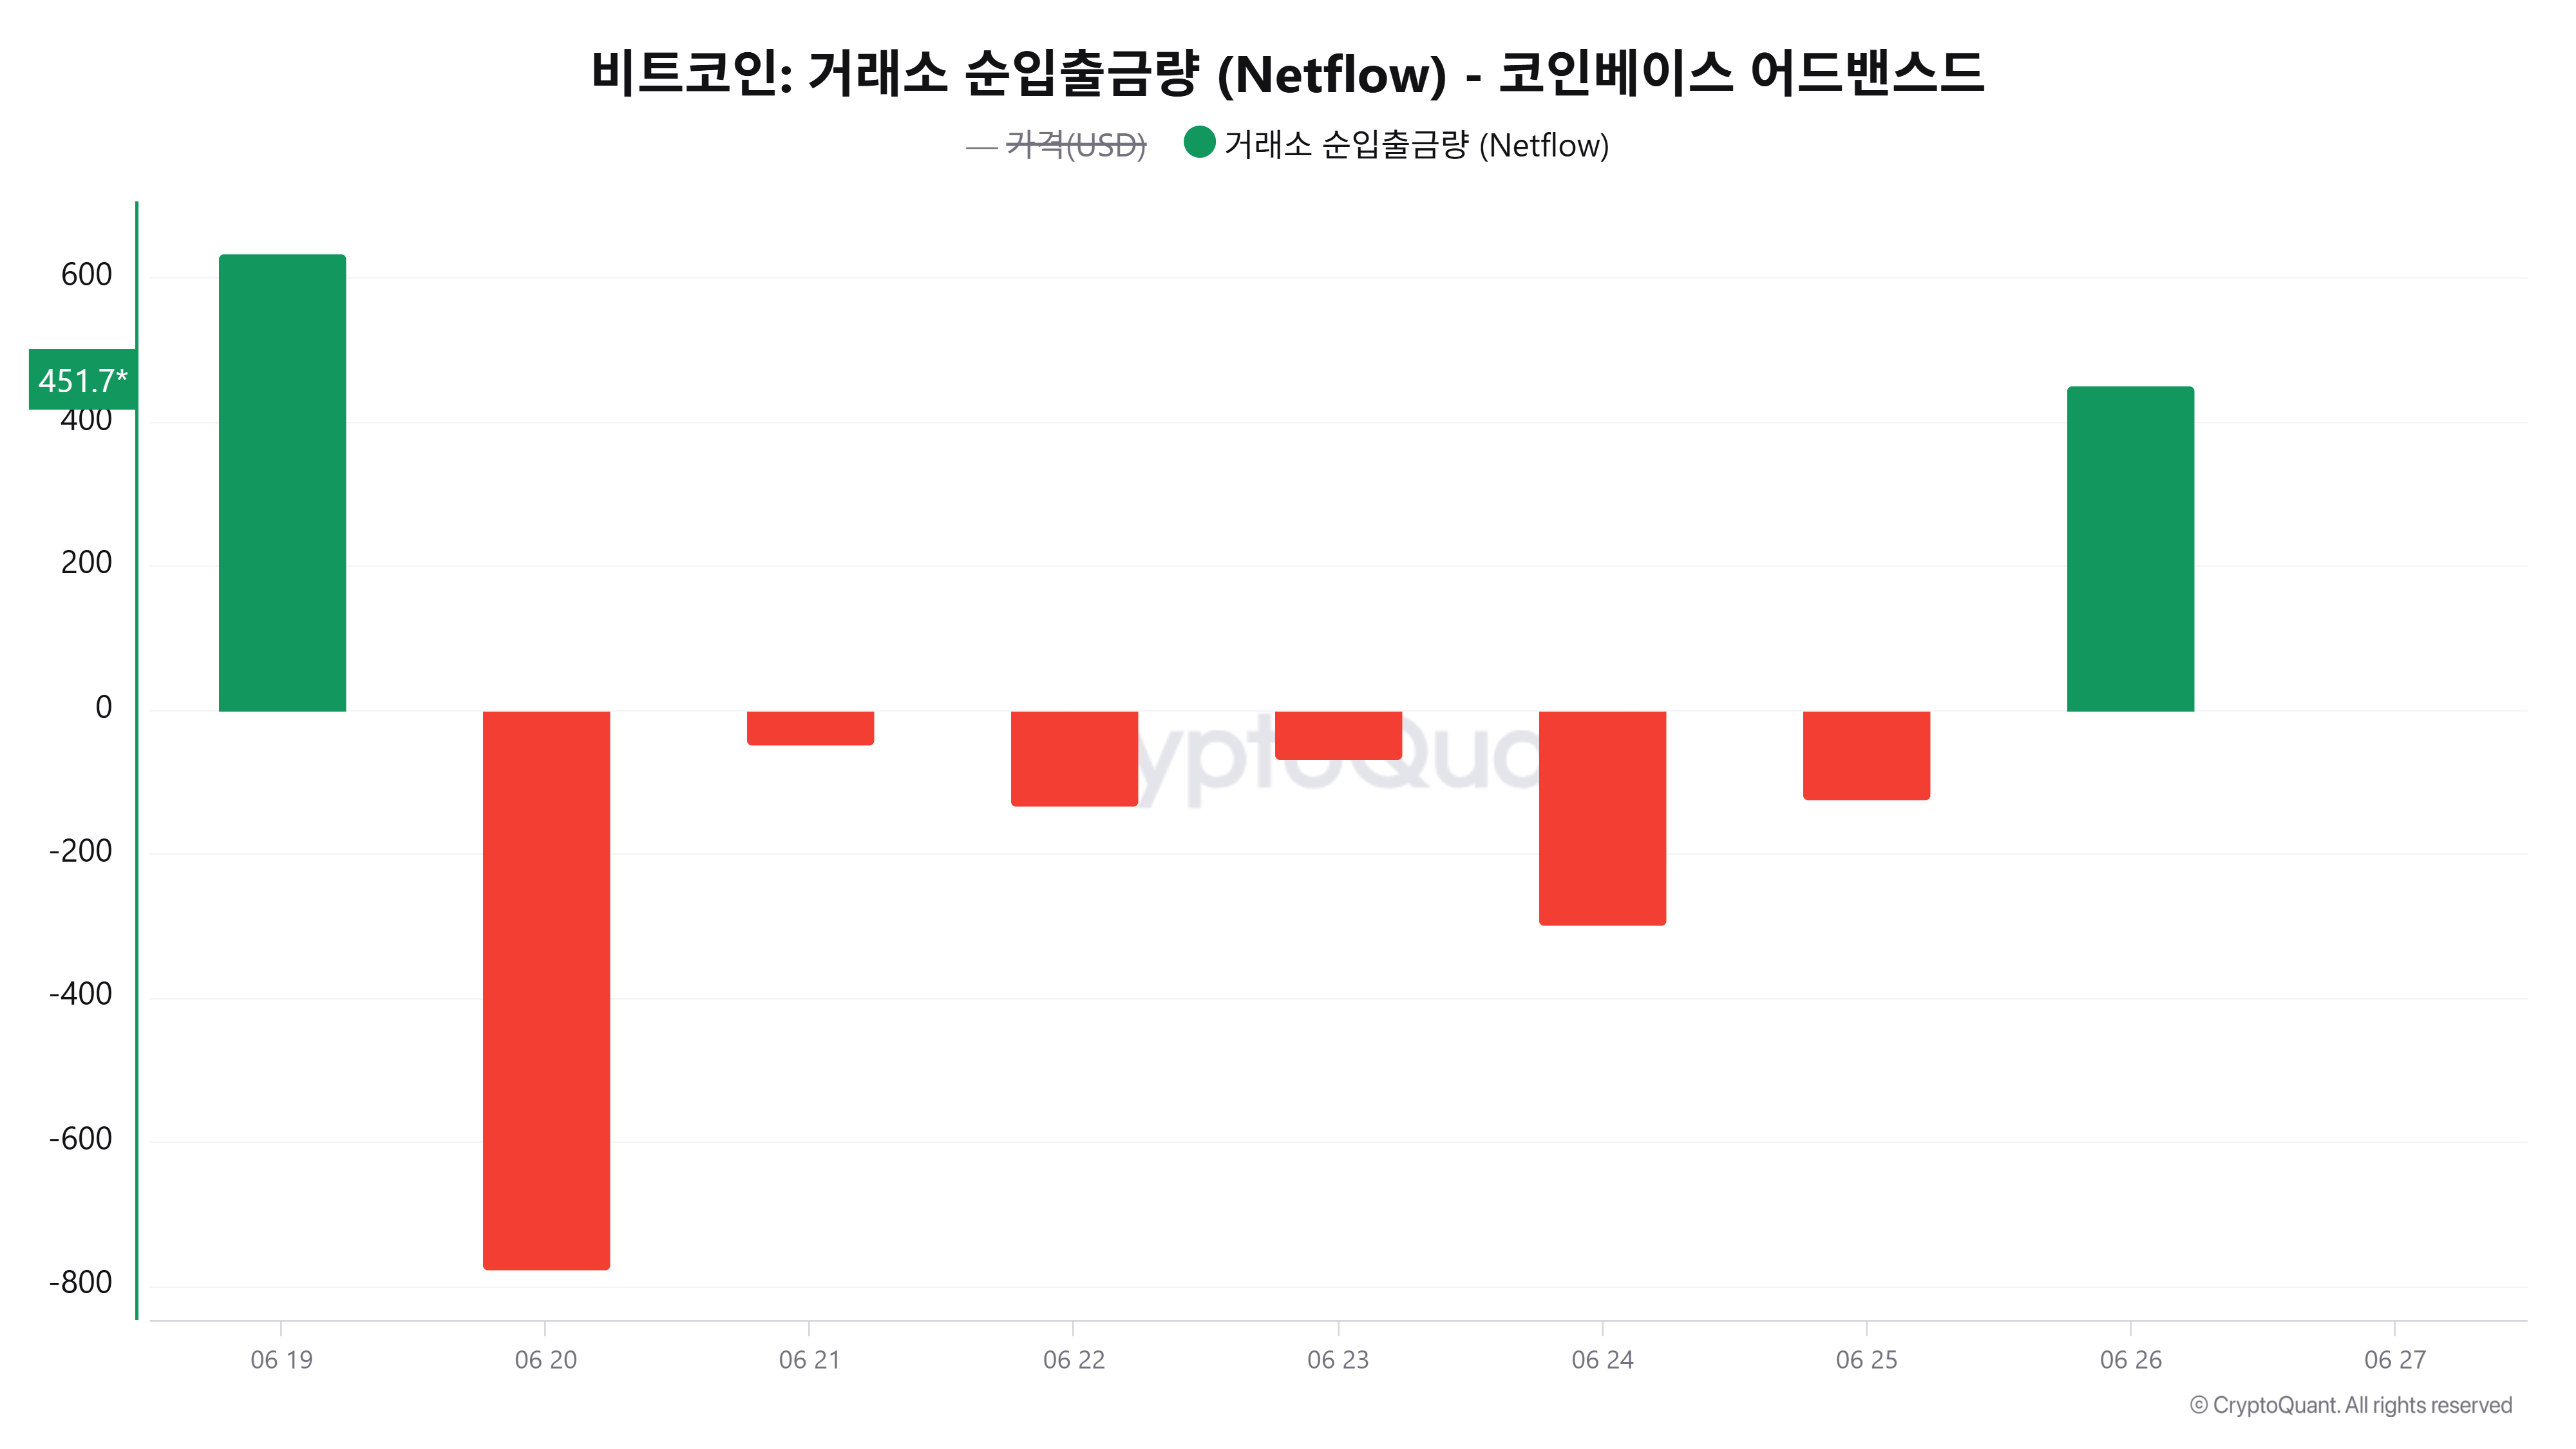
According to CryptoQuant data, Coinbase's Bitcoin Netflow as of June 26 was +451.77 BTC (unfinalized data), showing a significant shift to net inflow compared to the previous day (-123.28 BTC). This suggests that the flow of long-term holdings to external wallets has slowed down, and inflows to exchanges are increasing again.
Looking at the trend over the past five days, ▲22nd -132.31 BTC ▲23rd -68.48 BTC ▲24th -297.39 BTC ▲25th -123.28 BTC ▲26th +451.77 BTC (unfinalized), the overall trend was outflow-dominant until strong net inflow emerged. This shows that the tug-of-war between long-term holding sentiment and short-term profit-taking continues in the market.
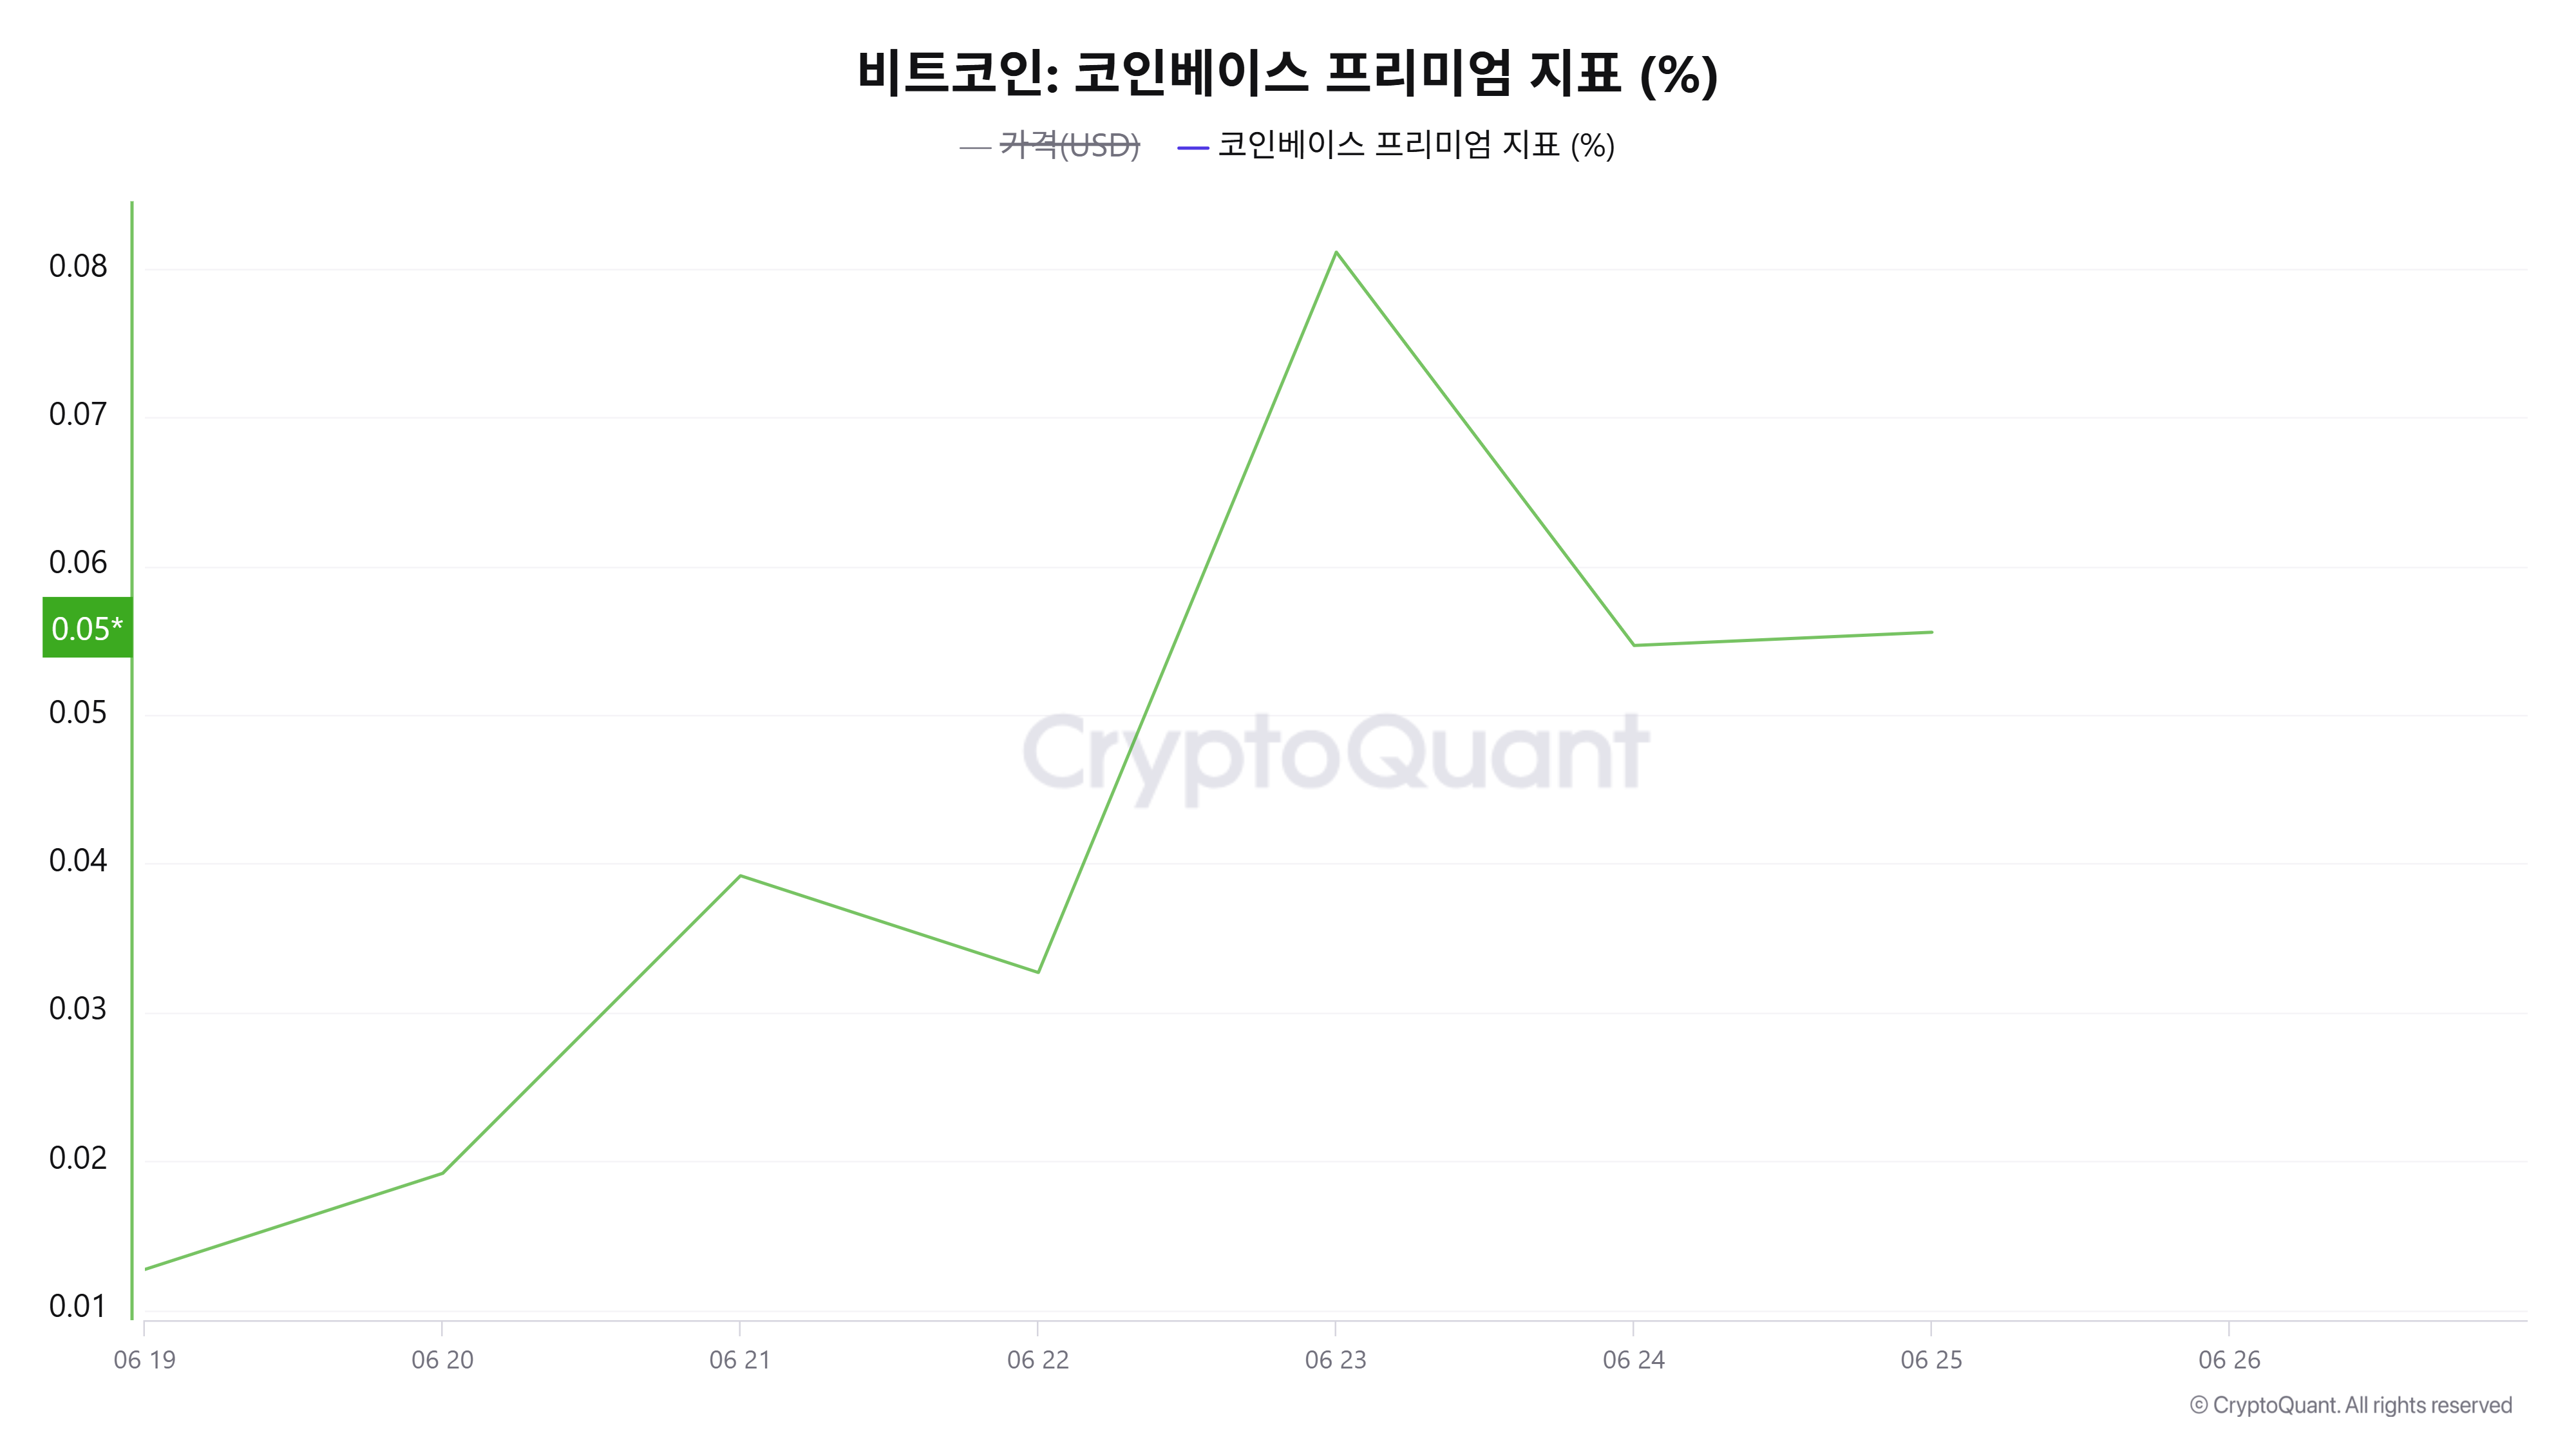
The Coinbase Premium as of June 25 was 0.0556%. Similar to the previous day (24th) at 0.0547%, this indicates that the buying pressure from US investors has been maintained at a similar intensity for two consecutive days. Lower than the recent peak of 0.0811% on the 23rd, it shows a mild downward trend.
This indicator represents the price difference between the US-based exchange Coinbase and the global exchange Binance for Bitcoin, and a positive value is interpreted as a signal of relatively strong buying pressure in the US.
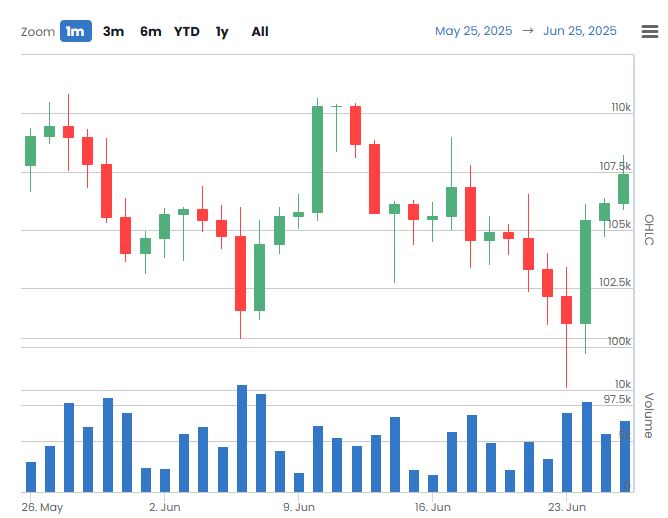
As of June 25, Coinbase Prime's Bitcoin trading volume was approximately 7,072.66 BTC, an increase of about 22.5% compared to the previous day (24th) at 5,773.21 BTC. The trading volume in dollars was approximately $762.12 million.
The consecutive two-day increase in trading volume suggests that institutional buying pressure is gradually recovering. This is a section where reinflow signs become clear after last week's sharp decline, and medium to long-term strategic buying demand is still considered valid. The market atmosphere could gain additional momentum depending on the continued large-scale inflow in the future.
For real-time news...Go to TokenPost Telegram
<Copyright ⓒ TokenPost, Unauthorized Reproduction and Redistribution Prohibited>