Author: Doc
Translated by: Tim, PANews
The purpose of this article is to help you understand how I identify key signals in the market. We need to understand the psychological mechanism behind risks and use this advantage to identify potential market bottoms.
1. Projects with Lower Consensus Collapse First
When uncertainty strikes, sellers will sell the assets they trust the least. For example, coins with low consensus will collapse first and bleed out earlier.
Logically speaking: If you urgently need money, you won't sell your valuable items, but rather sell those things you rarely use and consider worthless.
Similarly, when traders are uncertain about market trends or want to reduce risk, they often sell the assets they have the least emotional attachment to in order to cash out.
This phenomenon occurs every time Bitcoin peaks, and it's no coincidence. Altcoins do not rise after Bitcoin peaks, but rise simultaneously with Bitcoin. They show signs of fatigue before Bitcoin, peaking weeks earlier.
This is an early warning signal. Smart traders reduce risk before others realize what is about to happen.
2. Risk vs Blue-Chip Coins
Let's go back to the previous logic: People will try to keep their high-quality possessions for as long as possible and only reluctantly sell them when they have no other choice.
The most sought-after coins usually try to maintain their gains as much as possible. This is why Bitcoin always appears resilient, and in the weeks before a market crash, social media is often filled with tweets like "Why is everyone panicking? Bitcoin is clearly stable."
Selling order:
a) First, shit coins
b) Then blue-chip coins
c) Finally, all coins are sold
3. Reflexivity Effect Appears
Weakness leads to more weakness.
When whales start selling in a market with depleted demand, it triggers market weakness. This is a typical characteristic of the chip distribution phase: lack of support, demand exhaustion, trend moving away, etc.
The changing characteristics of risk assets will cause experienced traders' core decision-makers to re-evaluate their strategies.
"I didn't sell at the top, but the nature of the market has changed. It's time to reduce exposure or close positions."
"If this decline is considered a nuclear-level crash, what other landmines are hidden in my account?"
Suddenly: Position adjustments trigger larger sell-offs, this is reflexivity, a positive feedback loop of risk appetite diminishing.
4. Volatility: The Last Dance
When a major Bitcoin drop is imminent, the market often appears eerily calm: volatility suddenly drops, narrow range oscillation, complacent attitude prevails.
Then, bang~ it crashes.
Now, let's focus on the nature of market balance and imbalance.
Balance is achieved when market participants gradually reach a consensus on what is expensive and what is cheap. This is a collective dance. This is equilibrium.
Equilibrium means calmness. Known information has been digested, speculative activities have weakened, volatility has narrowed.
This dance will continue until one side gets bored, tired, or wants to have another drink at the bar. That is, buyers or sellers are exhausted; or supply and demand change.
Equilibrium is disrupted. Once it is broken: imbalance appears.
Prices deviate dramatically from their original position. Value becomes blurry; volatility surges. The market craves balance and will actively seek it.
Prices often return to areas where balance was recently formed: such as high-volume points, order blocks, comprehensive value areas, etc.
It is in these areas that you will see the most violent rebounds.
"First test is the best opportunity". Subsequent test responses will gradually weaken. The situation becomes more structured. Prices stabilize at new points. Volatility contracts. Balance reappears in the market.
5. Selling Process and Bottom Identification
Capitulation selling is not the beginning of the end, but the end of the middle stage.
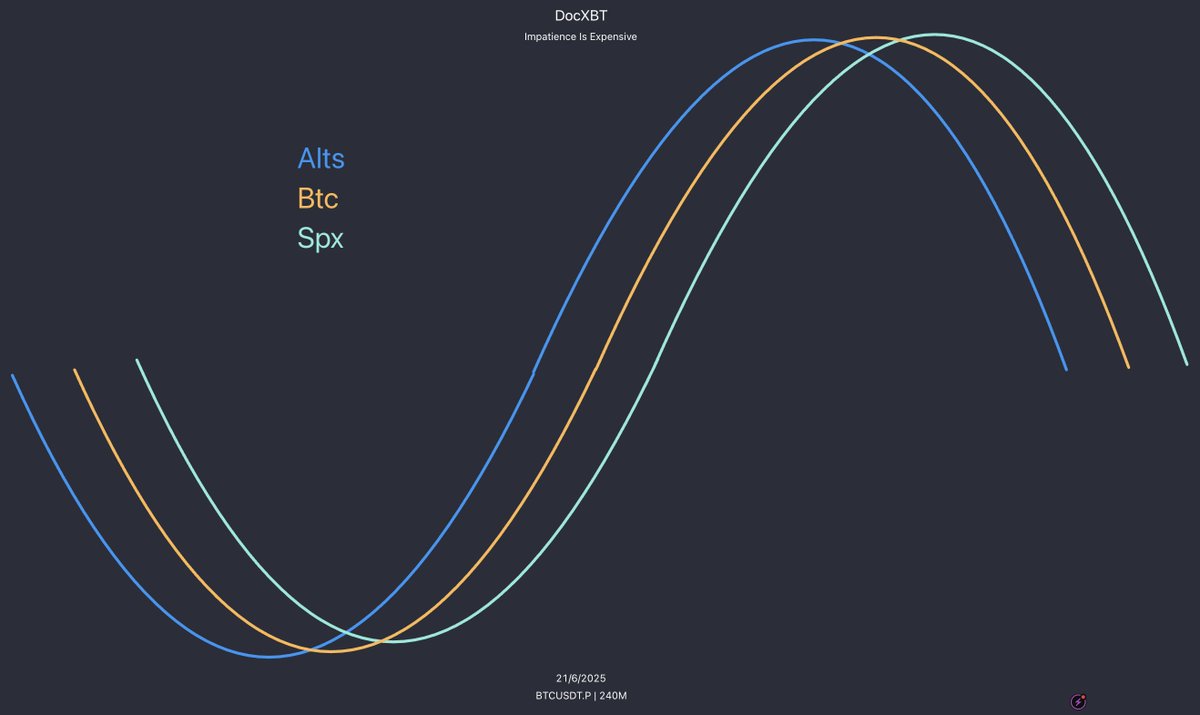
a) Altcoins vs Bitcoin
In this cycle, altcoins often complete their main sell-off before Bitcoin crashes.
Recent case: Fartcoin had fallen 88% from its high before Bitcoin's crash in late February. Since this pattern holds true, we can use it as a trading signal when looking for market exhaustion signals (bottom indicators).
When Bitcoin is still experiencing intense volatility and finding a new balance, the strongest altcoins will first show signs of relative strength exhaustion.
Simply put, when Bitcoin enters the late stage of imbalance, one should look for quality alternative coins to establish balanced positions.
As participants, our goal is to capture these divergence phenomena.
"Is market momentum changing?"
"Is volatility narrowing?"
"Is the selling speed slowing down?"
"When Bitcoin makes a new low, can it still hold steady?"
Second quarter bottom signals:
Momentum weakening (e.g., Fartcoin)
SFP, deviation (e.g., Hype, Sui chain)
Higher lows vs Bitcoin's lower points (e.g., Pepe coin)
Altcoins usually fall first, and their decline slows down after Bitcoin bottoms.
The trick to identifying quality altcoins lies here.
The weak remain weak.
The strong quietly layout, seizing the opportunity before the market trend starts.
b) Bitcoin vs S&P 500
Now, let's arrange a small exercise for everyone.
Integrating all the concepts in this article, perhaps the following phenomena now seem reasonable:
Summer 2023: Bitcoin topped before S&P 500, completing bottom formation earlier
Summer 2024: Bitcoin topped before S&P 500 and consolidated in the lower range during S&P's macro-induced crash
Until 2025: Bitcoin topped before S&P 500 and endured S&P's 20% crash in the lower range
Core Conclusion
Market bottom formation is a process, not an instant event: Altcoins lead → Bitcoin follows → S&P 500 comes last
Operational Essence: Focus on observing market structure evolution, rather than simply tracking emotional fluctuations