Large wallets and old wallets represent the top smart money in the crypto track to a certain extent. They are mostly insensitive to price fluctuations, with thousands of BTC sitting in wallets for years without moving. So when occasional movements occur, they can provide us with effective references.
Just like when BTC whales started adding positions around early April this year at around $80,000, my analysis of their entry points was not precise. In the short term, they may not have bought at the lowest point, but if viewed over a longer time frame, their overall direction is generally correct and rarely results in significant losses. Conversely, when some smart money chooses to take profits, they may not sell at the highest point. However, this "fuzzy correctness" still provides us with some guidance.

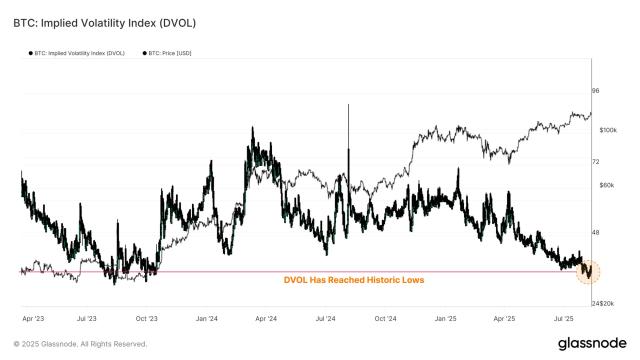
(Figure 1)
Among all whale groups, "large wallets" holding 100-1K and 1k-10K BTC are relatively the most active. Their behavior is more reference-worthy compared to super whales holding over 100,000 BTC, including long-term inactive "large wallets" like MSTR and exchange cold wallets.
As shown in Figure 1, when these two groups of large wallets suddenly significantly increase their selling scale, it means they judge that the market has entered a phased top interval, which is a signal worth our attention.
When the signal appeared in March 24, BTC was around $68,000;
When the signal appeared in November 24, BTC was around $98,000;
Looking back, these were not the top prices, but definitely top intervals. So the "large wallets" judgment of the situation was quite accurate. On May 27, large wallets suddenly significantly increased their selling scale, which was the first time in this market cycle. I don't know if there will be a second or third time. If I had to guess, it might correspond to the $68,000 in March 24 or $98,000 in November 24 (this is just my wild guess).

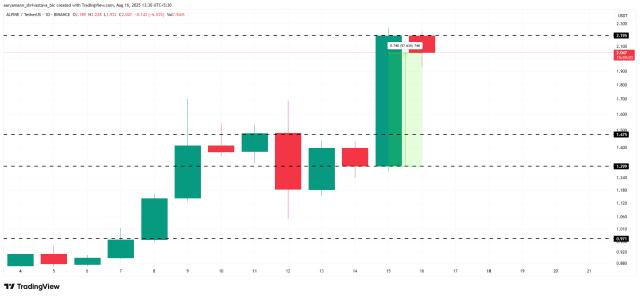
(Figure 2)
If in a certain stage, not only do "large wallets" have dense cash-outs, but "old wallets" also show unusual activity, we should pay even more attention. By separately screening "old wallets" with holding times of 2-3 years and 3-5 years, we can find that their judgment of the market seems quite accurate.
As shown in Figure 2, when "old wallets" suddenly have large profit-taking over $2 billion, such behavior is extremely abnormal. BTC held for 3-5 years suddenly being sold must have a reason.
From March 24 to now, such situations have occurred 4 times:
1. March 24, 2024 —— BTC $67,000
2. November 21, 2024 —— BTC $98,000
3. February 3, 2025 —— BTC $101,000
4. May 27, 2024 —— BTC $108,000
So May 27 is a key time node. On this day, both "large wallets" and "old wallets" simultaneously showed signals (perhaps from the same group). As mentioned earlier, this may not be the absolute top price, but it is highly likely to be entering the top interval.
-------------------------------------------------
The reason I want to update this series is to help everyone understand that "effective signals" are not a single data point or specific indicator, but a comprehensive system. Single indicators increase the probability of misjudgment, and a multi-angle approach is more objective.
Simply put, when all "1" points to "2", the probability of "2" occurring increases significantly. When "2" truly occurs, we can predict that "3" might appear. The uncertainty lies in unexpected events that may change the original path.
No method or indicator can give us 100% certainty. There are only probabilities. What I do is help everyone try to discover "high probability" scenarios, and that's all.