I. Current Market Landscape: Liquidity Waterfall and Violent Breakthrough Under Short Liquidation
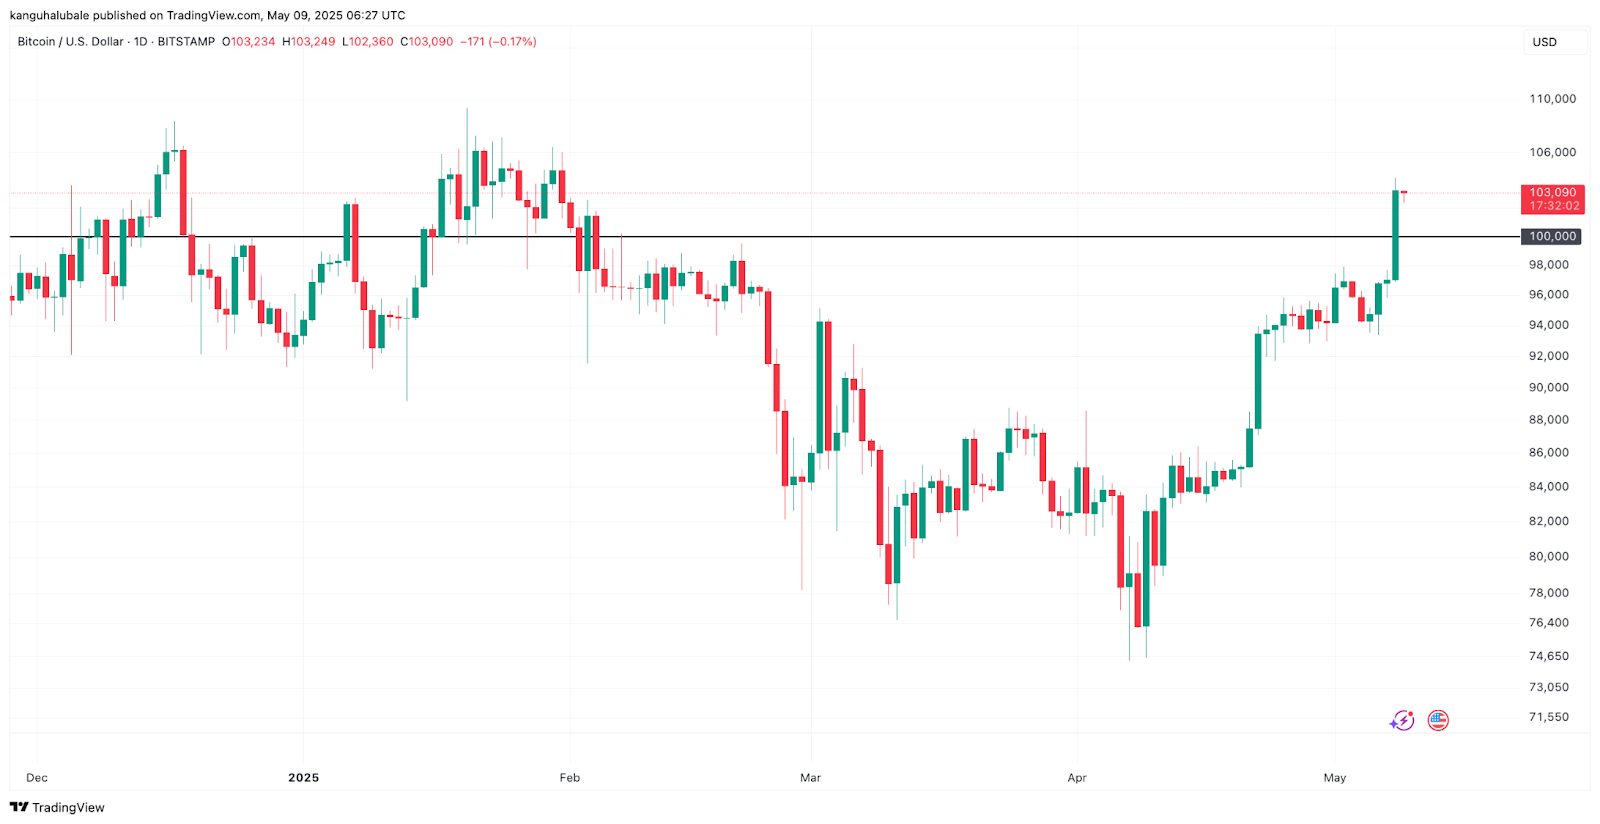
BTC/USD breaks through $100,000 for the first time since February 4th.
On May 9, 2025, Bitcoin (BTC) broke through $104,000 with a sharp single-day increase of 4.3%, standing above six digits for the first time since February.

This breakthrough not only ignited market sentiment but also created the largest short liquidation since 2021 - over $825 million in shorts were forcibly closed within 24 hours, with Bitcoin contributing $730 million of the liquidation volume.
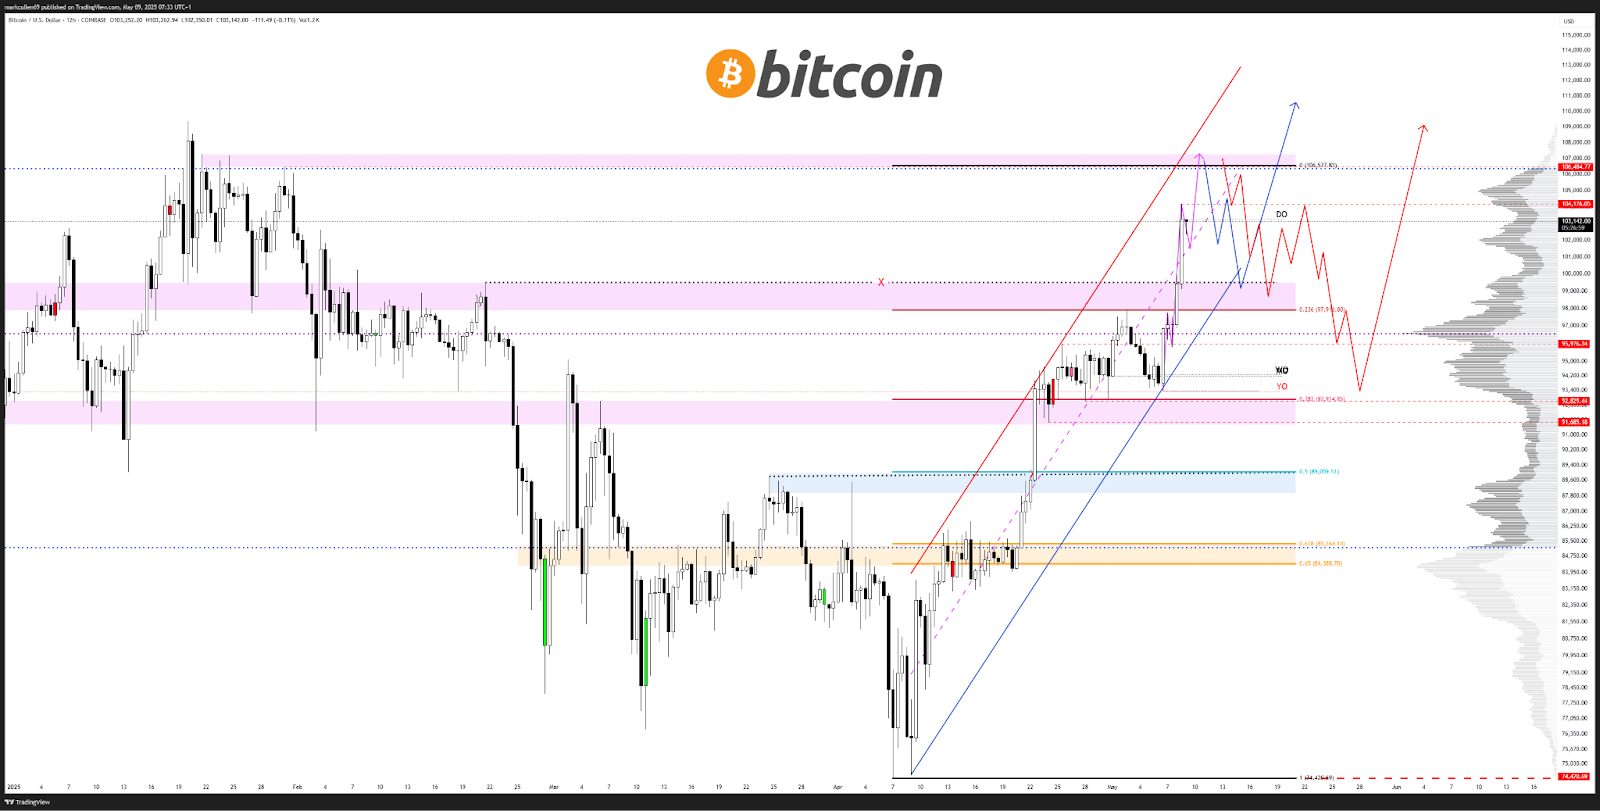
From a technical perspective, Bitcoin's weekly chart has formed a typical "bull flag" structure: after breaking through the uptrend line at $88,000 on April 22, the price entered an acceleration channel. If the pattern completes, the theoretical target could reach $182,200, still offering a 75% upside from the current price. On the daily level, the MACD indicator continues to diverge above the signal line, with 5-day, 10-day, and 20-day moving averages in a bullish arrangement, with short-term support moving up to $102,500.
However, the market is not without concerns. The current daily RSI has risen to the overbought zone above 70, and the weekly momentum is weaker than the peak in December 2024.
This means the price may face technical correction pressure after the breakthrough, but if the correction does not break key support levels, it could become a charging point for a new round of rise.
II. Core Driving Factors for the Next Week: Superposition of Four Dimensions of Positive Factors
1. Macro Policy Dividend: Rate Cut Expectations and Sovereign Capital Entry
- Fed's Turning Signal Strengthens: Although the May 8 FOMC meeting maintained interest rates, Powell hinted at "possible early rate cuts", with market expectations of a July rate cut rising to 68%. Historical data shows Bitcoin's average increase of 142% in the early stages of rate-cutting cycles (referring to 2019 and 2023).
- Sovereign Capital Allocation Wave: New Hampshire passed a strategic Bitcoin reserve bill, with Texas-related proposals entering the final voting stage. Japan's Metaplanet increased BTC holdings to 5,555 through bond issuance, and MicroStrategy's "42/42 plan" aims to raise $84 billion for continuous purchases. Such sovereign-level demand is reshaping Bitcoin's valuation logic.
2. Institutional Fund Inflow: ETF and Derivatives Market Resonance
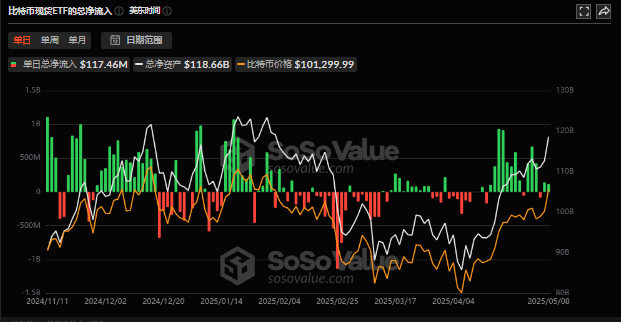
- Spot ETF Capital Suction Effect: Bitcoin ETF net inflows reached $5.3 billion in the past three weeks, with a single-day inflow of $890 million on May 9. BlackRock's IBIT ETF holdings already account for 5% of circulation, and its first competitive ETF investment (such as Fidelity FBTC) indicates the white-hot stage of institutional layout.
- Options Market Betting Heats Up: Coinbase call option positions surged 300%, with contracts at strike prices of $120,000-$150,000 accounting for over 40%. The derivatives market's leverage effect may further amplify spot gains.
3. Technical Upgrade and Ecosystem Expansion
- Bitcoin Network Maturity Improvement: Lightning Network nodes break through 80,000, with on-chain active addresses increasing by 12% weekly, and transaction costs dropping below $0.5. The MVRV (Market Value to Realized Value) indicator returns to the healthy range of 2.5-3, showing the market has not entered an excessive speculation stage.
- Ethereum Pectra Upgrade Spillover Effect: The May 7 upgrade introduced EIP-7702 (account abstraction) and EIP-7251 (validator stake limit raised to 2,048 ETH), directly reducing DeFi protocol Gas costs by over 30%. After Ethereum broke through $2,200, ecosystem capital reflux may help Bitcoin break through liquidity bottlenecks.
4. Market Sentiment and Game Structure
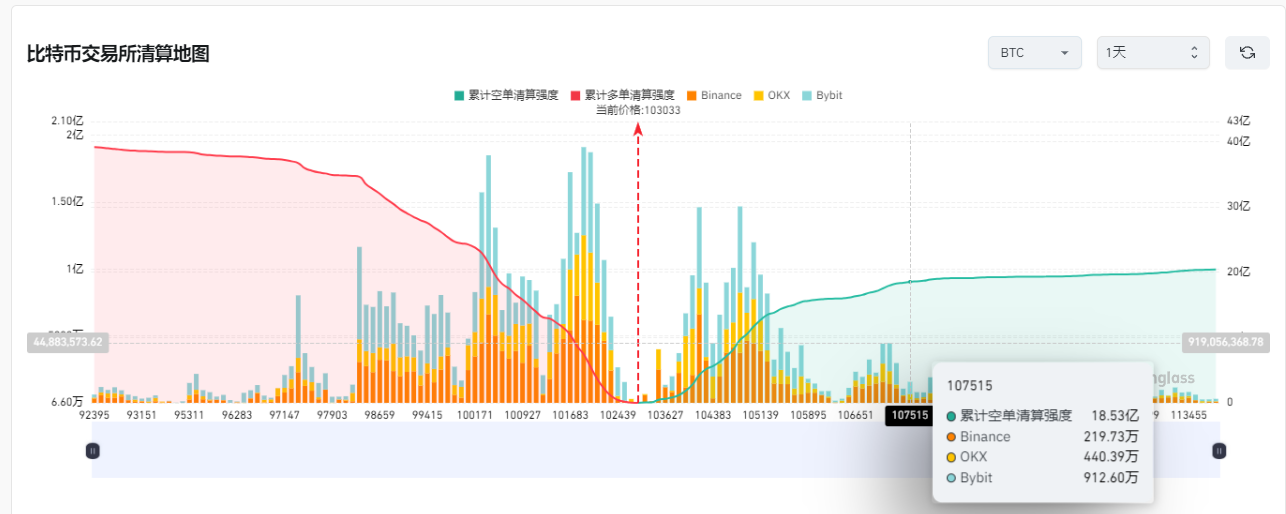
- Short Covering Pressure: Currently, shorts still account for 62% of Bitcoin futures open interest, with sell orders worth $2.85 billion above $10,995. If the price breaks through the previous high of $109,225, it may trigger a stampede-like short covering.
- Retail FOMO Lag: On-chain data shows concentrated chips of 1.17 million BTC in the 93k-98k range, but exchange stablecoin balances continue to flow out, indicating retail investors have not yet entered en masse. This "institutional-led, retail-observing" structure actually reduces short-term selling pressure.
III. Key Resistance and Breakthrough Path: The Battle from $104,000 to $150,000
1. Short-term Resistance Range (Next Week)
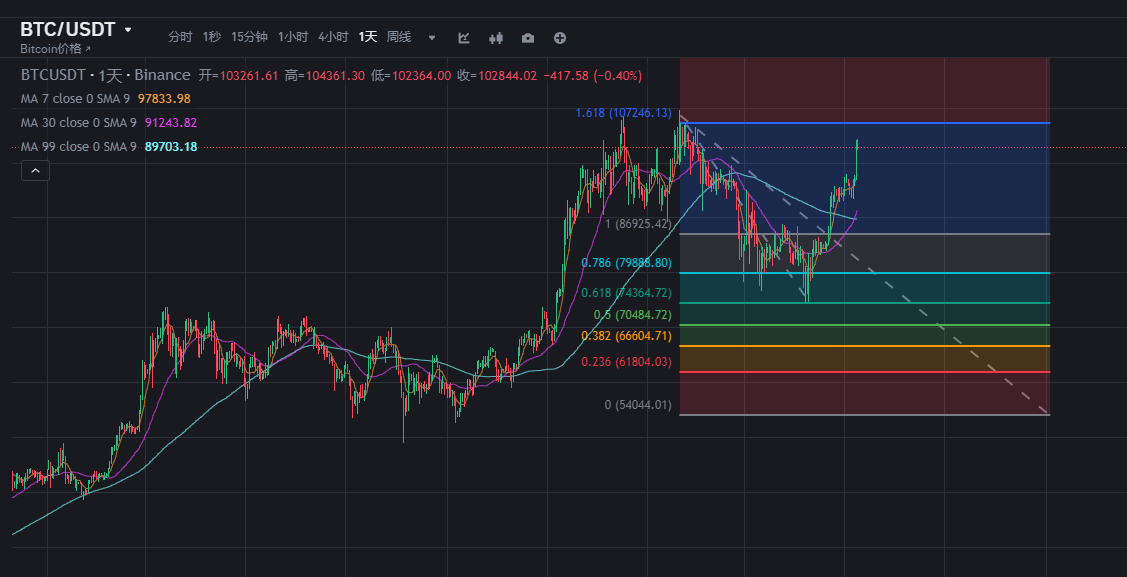
- First Checkpoint: $106,500
- According to the Fibonacci extension model, $106,000-$106,500 is the 1.618 retracement of the December 2024 downward wave, and breaking through will open up space to $116,891.
- Historical High: $109,225
- The January high of $109,225 is a psychological and technical double pressure point. Standard Chartered Bank analysts believe that holding this level will confirm the start of the bull market's second phase, with a direct target of $120,000.
2. Medium-term Target: Bull Flag and Cycle Regularity
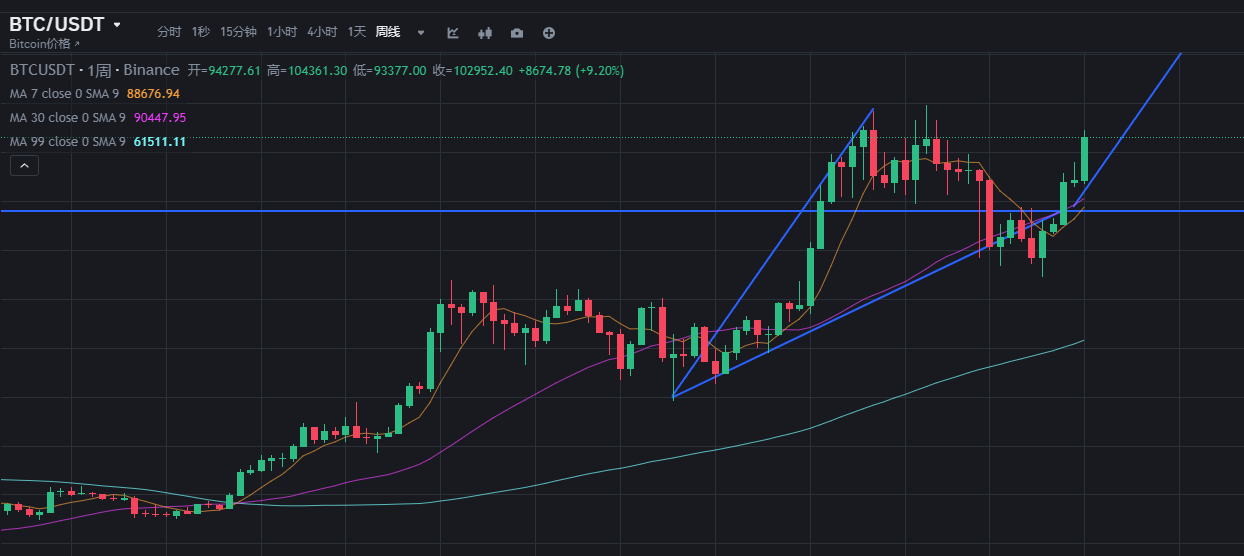
- Weekly Flag Target: $147,225
- According to measurement rules, the bull flag breakthrough height usually equals the flag pole length (from the October 2024 low of $50,000 to the January 2025 high of $109,225). If the pattern holds, the theoretical target is $88,000 + (109,225 - 50,000) ≈ $147,225.
- Halving Cycle Regularity: Historically, Bitcoin's increase reaches dozens of times 500 days after the third halving, with each halving's multiple decaying. 400 days after this halving (April 2024), if replicating this pattern, the price will touch $150,000.
3. Extreme Scenario: Possibility of Million-Dollar Narrative
Binance founder CZ's proposed target of "$500,000-$1,000,000" is based on the following assumptions:
- US Treasury allocates 1% of foreign exchange reserves (about $40 billion) to Bitcoin;
- Trump administration promotes Bitcoin as a legal tender equivalent;
- Global sovereign fund allocation ratio increases to 0.5%.
- Although this prediction is aggressive, MicroStrategy's continued purchases (holdings accounting for 180% of company market value) have provided a template for the "corporate balance sheet revolution".
IV. Risk Warning: Three Potential Reversal Signals
1. Macro Policy Black Swan
If the Fed delays rate cuts or inflation data exceeds expectations (such as May 15 CPI year-on-year exceeding 4.5%), it may cause a general decline in risk assets. Bitcoin's 30-day correlation with the S&P 500 has risen to 0.72, requiring vigilance against synchronized downside risks.
2. On-chain Chip Anomalies
Long-term holders (LTH) have reduced 500,000 BTC above $100,000, and miner wallet balances have dropped to the lowest since 2020. If whale addresses show signs of concentrated transfers to exchanges, it may signal a potential stage top.
3. Derivatives Leverage Liquidation Chain
The current market leverage ratio (open contracts/market value) has reached 18%, close to the November 2021 level. If the price quickly falls below the $93,780 support level, it may trigger a $6 billion long position liquidation.
Conclusion: New High in Sight, but Beware of Amplification Effect
Combining technical, capital, and sentiment aspects, the probability of BTC breaking through the historical high of $109,225 in the next week exceeds 70%. Key catalysts include:
- BTC spot ETF daily net inflow exceeds $1 billion;
- Trump releases details of crypto-friendly policies;
- ETH breaking through $2,500 triggers cross-market capital rotation.
For investors, the following strategies are recommended:
- Short-term traders: Build positions in batches in the $102,500-$103,000 range, add positions after breaking $109,225, with a stop loss at the $100,000 psychological level.
- Long-term holders: Take the opportunity to increase spot positions during pullbacks to the $93,780-$96,000 support zone, avoiding high-leverage operations.
Overbought can become more overbought in a bull market, and oversold can become more oversold in a bear market. Under the new paradigm driven by liquidity, BTC is evolving from "digital gold" to a "sovereign-level reserve asset", and this epic market movement may have just begun.


