

History shows that the second quarter has always been the most explosive period for the cryptocurrency market, with Bitcoin's average increase exceeding 25%, and ETH's increase even more impressive, surpassing 60%. Despite concerns about tariff impacts from Trump's policies, the market has strongly recovered, returning to an important threshold.
VX: TZ7971
During this process, greedy long positions were completely liquidated, and excessive leverage was shed. The market has been cleared - a perfect process to initiate a sustainable rebound. As Bitcoin's dominance begins to show signs of weakening and a pullback seems imminent, Altcoins are showing strong signs of rising - perhaps inevitably.
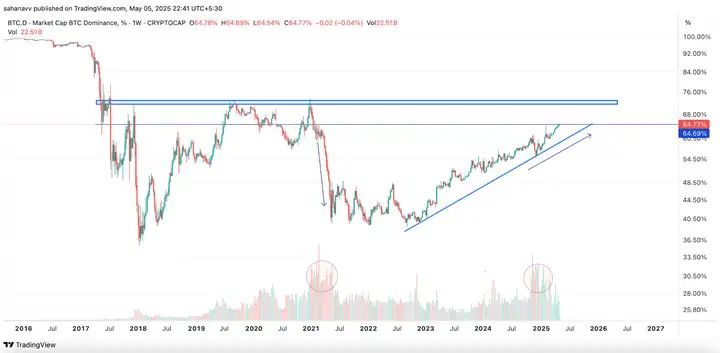
Bitcoin's dominance is rising, but this time, it exhibits a pattern different from previous cycles. Compared to previous volatile stages (sudden spikes or crashes), BTC's dominance is now gradually forming a sustainable growth structure, with higher peaks and troughs, indicating an organized accumulation trend.
Notably, when BTC's dominance begins to weaken, trading volume also surges, especially after reaching a 70% peak in 2021. This indicates a strong market reaction as BTC approaches a strategic resistance zone.
Currently, the index is approaching one of the most important resistance levels. If BTC is rejected here, it might signal the start of the Altcoin season, as funds begin to shift towards smaller assets.
Conversely, if BTC breaks through this resistance zone, the dominance index might continue to rise, between 71.36% and 72.7% - a strong resistance area that could potentially reshape the entire market trend in the short term.
When Will Altcoin Season Start?
The current Altcoin chart remarkably reflects the patterns seen during the legendary 2017-2018 Altcoin season. At that time, Trump was in office, and like today, the first quarter did not show a clear Altcoin breakthrough - a stunning similarity.
However, the current situation has an even stronger supporting factor: the possibility of monetary easing (QE) from the Federal Reserve and central banks - something that did not occur in the previous cycle. This could be a catalyst to drive Altcoins into a strong and sustained rise starting from the second quarter.
If history repeats - and the data tends towards this - the main growth peak of the Altcoin market might occur, similar to what happened nearly a decade ago. With the convergence of macro and technical factors, the upcoming Altcoin season might not just repeat, but be an upgraded version with even more explosive scale.
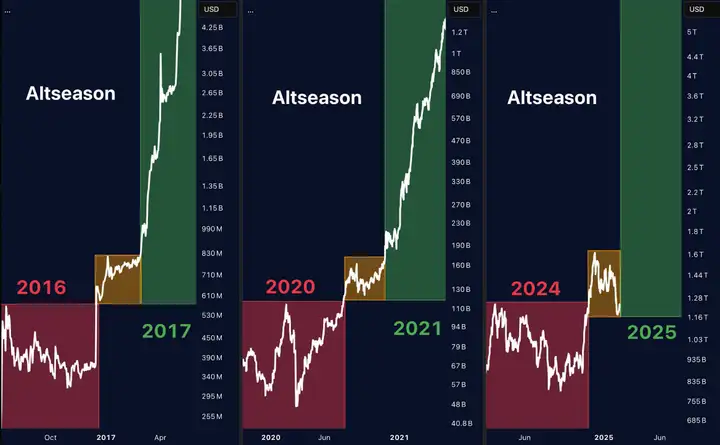
The Altcoin market cap charts from 2016, 2020, and 2024 show remarkable commonalities: repeated accumulation patterns with stunning similarity. In the previous two cycles, long-term accumulation was the cornerstone of price explosive rises in 2017 and 2021, marking historic milestones in the Altcoin market.
Currently, technical signals indicate that Altcoins are at the "foothills" of the "Altcoin Season 3.0" of a new bull market season. With the reappearance of accumulation patterns and supportive macro factors, the possibility of a similar growth cycle beginning is entirely reasonable.
If the growth trajectory repeats with the same intensity as previous cycles, the Altcoin market cap could reach the $5 trillion mark.
Today's fear index is 59, with the market shifting to a neutral state.
MicroStrategy truly has money, buying nearly $200 million of BTC, and has already earned $14.1 billion from BTC. If other companies follow suit, it could bring continuous buying and strategic reserves for BTC, which are potential positive signals.
Returning to the market, BTC is currently at 94,244, and ETH at 1,800. Approaching the monetary policy meeting, the market is observing, with cash flow primarily from large financial institutions and relatively fewer retail investors, so the market hasn't FOMO'd yet. In the short term, BTC supports 93,000, ETH 1,700, and trend formation generally takes time. If there's a pullback that doesn't break these levels, it could be considered a short-term entry point.


