

Bitcoin (BTC) rose nearly 12% in the past week, reaffirming its bullish trend after breaking key technical levels and approaching a strong resistance zone. This bullish momentum was driven by a slight increase in whale wallet numbers - indicating that large investors may be starting to accumulate funds again.
VX: TZ7971
Technical analysis tools such as the Ichimoku Cloud and EMA moving averages all show a robust upward trend, with current trading patterns suggesting buyers are in control of the market. As BTC approaches $100,000, whale wallet behavior and chart signals will be crucial in determining whether this rally has sufficient momentum to continue breaking through.
What Does the Rise of BTC Whale Wallets Mean?
Bitcoin whale wallets (wallets holding 1,000 to 10,000 BTC) have recently shown signs of a rebound, indicating a calm but meaningful accumulation wave.
Currently, the total number of whale wallet addresses is 2,006, slightly more than the 2,000 recorded on April 21. On April 22, this number rose to 2,005, slightly decreased to 2,002 the next day, and has now rebounded to over 2,006.
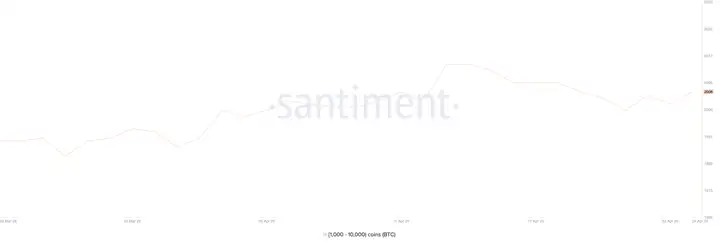
Although daily fluctuations are relatively small, these changes often reflect profound shifts in the sentiment and strategy of market "big players". The gradual stabilization and increase in whale wallet numbers suggest that accumulation is returning after a long period of distribution or hesitation.
Tracking whale activity is crucial, as they often have a significant impact on market conditions. Whether institutional investors, long-term holders, or individuals with massive assets, whales typically possess strategic insight and patience that most retail investors cannot match.
Their behavior can indicate confidence or caution about market prospects. The slight increase in whale wallet numbers is seen as a signal that interest in buying BTC at current price levels is gradually recovering.
While this may not immediately trigger a strong rebound, it does help consolidate the market foundation, reduce the risk of deep pullbacks, and create space for a more sustainable upward trend under supportive macro factors.
Ichimoku Cloud Shows Bitcoin's Strong Upward Trend
Bitcoin's Ichimoku chart has issued positive signals, indicating that bullish momentum remains solid.
Currently, the price is trading above the blue conversion line (Tenkan-sen) and red baseline (Kijun-sen) - a sign of short-term strength enhancement and a clear consensus on the upward trend.

In recent rallies, these two lines have served as important dynamic support areas, with prices repeatedly bouncing from these levels. This suggests that demand remains dominant, and any adjustments are quickly absorbed.
Ahead, the green cloud (Kumo) is thickening and pointing upward, signaling strong support areas and an optimistic outlook for future trends. Meanwhile, the gap between the red band above and blue band below the Kumo is continuously expanding, indicating increasing volatility - a factor that typically drives significant directional price movements.
As the price is solidly above the cloud, and all key components of the Ichimoku system are arranged in a bullish structure, the current technical aspect further reinforces the argument that the upward trend continues - at least in the short to medium term - unless a strong reversal occurs that causes the price to close below the conversion and baseline.
Will Bitcoin Break $100,000 Before May?
Bitcoin has just officially broken through the $95,000 mark, the first time returning to this level since early March.
The Exponential Moving Average (EMA) continues to strengthen the bullish outlook, as all short-term EMAs maintain a significant distance from long-term EMAs - a typical signal of a strong upward trend.
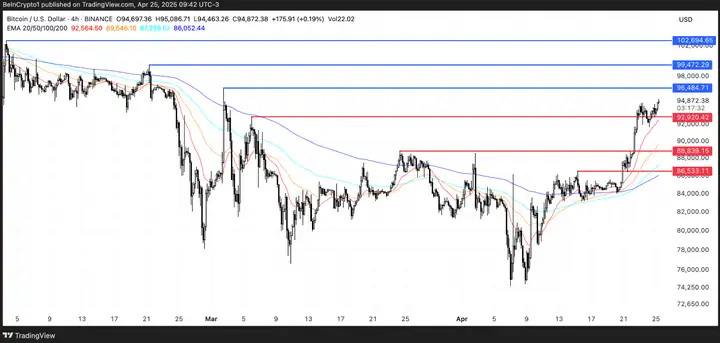
If the current momentum continues, Bitcoin could challenge key resistance zones at $96,484 and $99,472. Breaking these levels would open the door to the important psychological threshold of $100,000, with further targets at $102,694 - the highest level since early February.
Nevertheless, caution is advised. If Bitcoin reverses and fails to maintain support at $92,920, the short-term upward trend could weaken.
At this point, the price might retrace to $88,839, and if selling pressure increases, it could potentially fall further to $86,533.


