Source: glassnode; Compiled by Wu Zhu, Jinse Finance
Summary
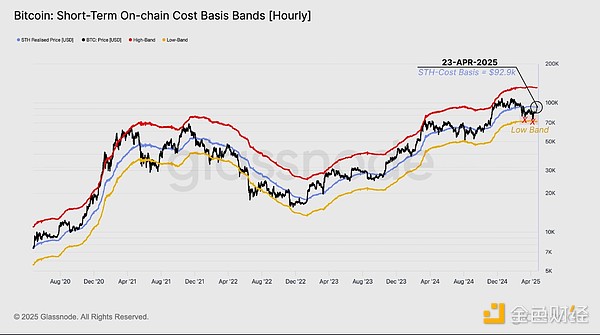
Bitcoin price surged to $94,700 due to optimistic sentiment about potential easing of US-China tariff tensions. The price briefly recovered the short-term holder cost basis, a key midpoint for distinguishing bear and bull market phases.
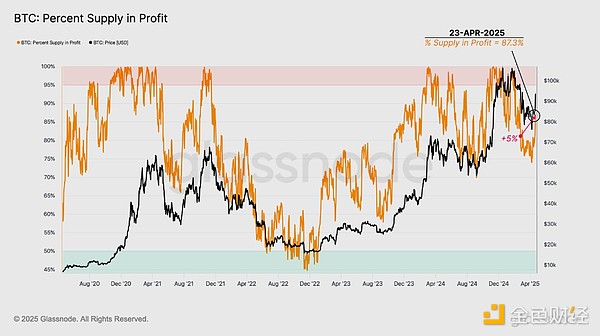
The profit supply percentage rose from 82.7% to 87.3% when BTC last traded at a similar price level. This indicates nearly 5% of supply changed hands during the recent adjustment.
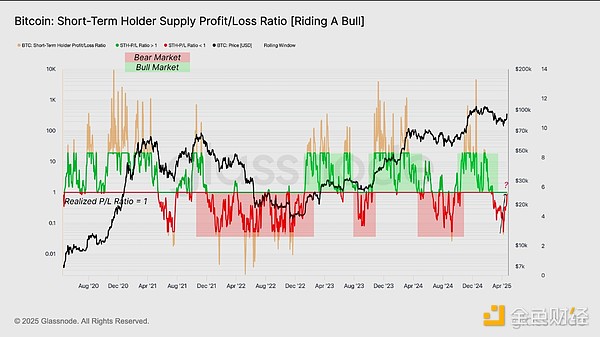
The STH profit/loss ratio reached 1.0, indicating many recent buyers are at break-even, a level typically associated with exit risk. Realized profits also significantly increased, primarily driven by short-term investors locking in gains.
Futures open interest increased by 15.6%. However, despite market trading higher, funding rates turned negative, suggesting increased short interest.
On April 22, US spot Bitcoin ETF net inflows hit a historical high of $1.54 billion, indicating substantial institutional demand. Standardized flow data shows BTC demand far exceeds ETH demand through ETFs, helping explain Ethereum's relatively poor performance.
After weeks of low activity and reduced liquidity, the market finally responded positively to broader macro catalysts. Stock and cryptocurrency markets rose following optimistic signals from the US government about potential tariff relief on Chinese imports.
For Bitcoin, this rally briefly broke through a critical on-chain threshold: the short-term holder (STH) cost basis. This model reflects the average purchase price of recent token buyers and typically serves as a key pivot level. Historically, sustained breaching of this price model signifies a transition between bearish correction and bullish recovery periods.
However, similar to the July-September 2024 period, this move has so far only resulted in a temporary STH cost basis recovery. This suggests emerging optimism but not yet a confirmed full market shift to bullish. Market confidence may strengthen as more investors return to meaningful unrealized investments with continued strength above this level.
The market recently rose to $94,300, with unrealized profits for investors also notably rebounding. The profit supply percentage indicator has risen to 87.3%, significantly bouncing back from March's low point.
When Bitcoin last traded around $94,000, only 82.7% of supply was profitable. This means that since early March, as the market consolidated and declined, nearly 5% of circulating supply changed hands at lower prices.
Historically, typical excitement phases often follow this indicator remaining stable above 90% for extended periods, indicating widespread profitability and increased investor confidence.
Another indicator of Bitcoin returning to a critical decision area is the STH supply profit/loss ratio, which has recently surged near the neutral level of 1.0. This indicates short-term supply is more evenly distributed between profitable and loss-making tokens, making this group's sentiment more balanced.
This structure is crucial. In previous bear markets, the STH-P/L ratio traded far below 1, with this level acting as a resistance ceiling. Whenever this indicator retests 1.0 from below, it often correlates with local tops as investors begin exiting positions and suppressing momentum.
A convincing market recovery above this level and trading above 1.0 would signal a stronger recovery. Monitoring the ratio's trading in the coming weeks, especially in conjunction with realized profit-taking behavior, can help assess whether the market is rebuilding a more constructive recovery from this adjustment.
Profit-Taking Pressure Test
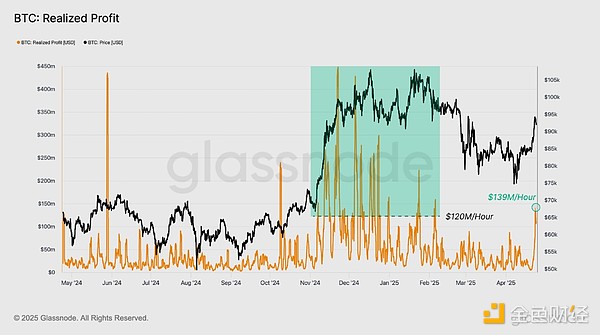
Now that we have a market framework at a decision point, profit-taking behavior becomes a key signal to monitor. Currently, hourly total realized profits have surged to $139.9 million/hour, about 17% above its benchmark of $120 million/hour.
This increase indicates many market participants are using this rally to lock in profits. If the market can absorb this selling pressure without collapsing, the future path looks brighter.
Conversely, if these levels cannot be maintained while realizing substantial profits, this move might be marked as another Dead Cat Bounce, consistent with previous relief rallies that faded under similar conditions.
Who is Profiting?
Beyond the quantity of realized gains, understanding which groups are realizing profits provides deeper market sentiment insights. For this, we use the Spent Output Profit Ratio (SOPR) - an indicator comparing tokens' selling price to their original cost basis, offering perspective on the average profit or loss multiple investors are locking in.
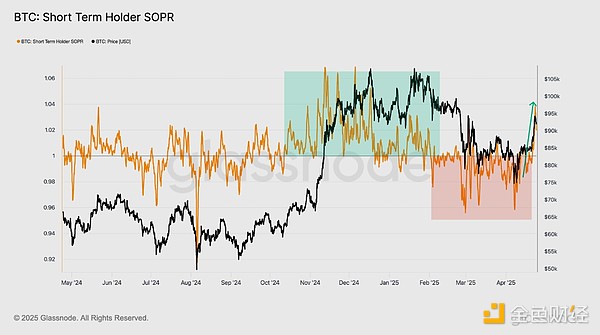
Short-term holders' SOPR (STH-SOPR) shows recent buyers were the primary group locking in profits during the recent surge.
This is the first significant break above the 1.0 break-even level for STH-SOPR since late February, another relatively positive signal of investors returning to profitable positions. Overall, sustained trading above 1.0 is characteristic of a bullish upward trend.
Short Perpetual Options
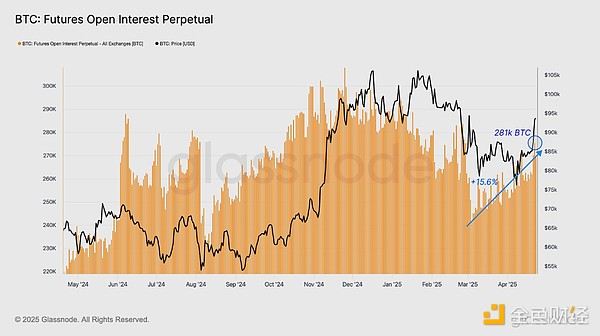
While some spot holders appear to be locking in profits, perpetual swap traders tend to short during the rally. Perpetual swap open interest has significantly climbed to 281k BTC, rising about 15.6% from the March low of 243k BTC.
This reflects increased derivatives market leverage, which often intensifies market volatility if prices begin touching traders' stop-loss or liquidation zones.
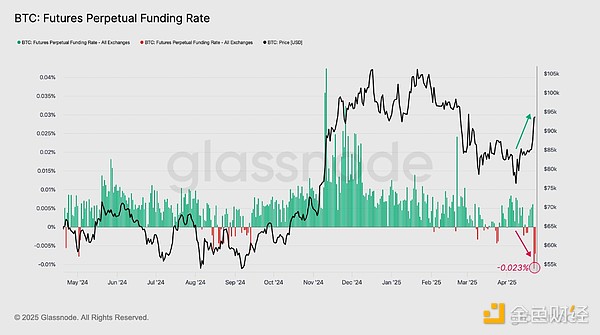
Interestingly, the open interest surge coincides with a drop in average funding rates to -0.023%. This indicates an increasing tendency towards short positions, suggesting many traders are betting against the rally, possibly believing recent moves are overextended.
If the upward momentum continues, this divergence between rising open interest and negative funding flows could set the stage for a potential short squeeze.
However, when narrowing the scope to assess long-term sentiment among perpetual swap traders, the situation becomes more cautious. The 7-day moving average of hourly long funding steadily declines, currently at $88,000 per hour and still trending downward.
This>indicator, as a measure of long-term exposure willingness, reflects the dollar value paid by market "consensus" side traders. The current downward trend in premium indicates that most positions are indeed shifting towards short, creating motivation for market makers to take long positions to collect financing rate interest.
Institutional Interests <: p strong flows have become an important indicator for measuring institutional investor sentiment and demand this cycle.<><>Bitcoin's to $94 ,the US spot Bitcoin ETF's single-day net inflow reached an astonishing $1.54 billion, one of the highest single-day net inflows since its establishment.. This influx sends a strong signal that demand for Bitcoin may be> beginning to recover.
Is It Still Bitcoin Season?
Despite Despite Bitcoin'sbound strong rebound, many question why Ethereum hasn't seen a magnitude of rebound. One answer lies in comparing ETF flows flows, which we standardize and adjust based on relative spot trading volume for each asset.
In the past two weeks, Bitcoin ETF experienced two clear waves of inflows, each exceeding 10% of BTC spot trading volume, highlighting relatively highlighting status.
In contrast, Ethereum ETF inflows remain quite low, with inflows less than 1% of ETH spot trading volume. This stark difference highlights the underdifference demand between theoth assets,, which may be one reason why ETH has continued to lagETbehind BstrongTC.
Conclusion
Bitcoin price rebounded above $94,000, reflecting macro optimistic sentiment and investor sentiment shift. Positive signals around US-China tariffs triggered the rebound, recovering short-term holder cost basis and lifting profit supply percentage to %. to 87.3%. Multiple indicators suggest Bitcoin is experiencing a, futures market also shows signs of short squeeze.
<: p>demand Bitcoin may be returning, with Bitcoin ETF single net reaching54 . Human>div:请将下面的文字翻译为英语,如果遇到<>,保留且不要翻译<>中的内容,其他部分一定要全部翻译成英语。只给我翻译结果,不要对内容进行分析或答,不要添加额外的说明。在加密货币市场,"死猫弹是一个常见的交易术语,指描述描述了资产价格在经历大幅下�后�现象反弹。
这个术语源于金融示界的一语个俗说法,的通常用来描述描描暂价格,这个价格反弹并不代表趋势的根本性逆转,而仅仅是一个短暂的喘息。
在加密货币交易中,"死猫反弹"可能发生在一个资产经历了显著下跌之后,投资者可能会暂时推高价格,但这种反弹通常是短暂的,并不意味着市场已经完全恢复。
交易者要�对待这种现象,,不应该将解读这种短�异弹为市场趋势的转变。
分析师建议,投资者在应注广泛的市场趋势和基本质面因因,而不是仅仅依赖于短期价格的波动。


