

Author: Liu Jiaochain
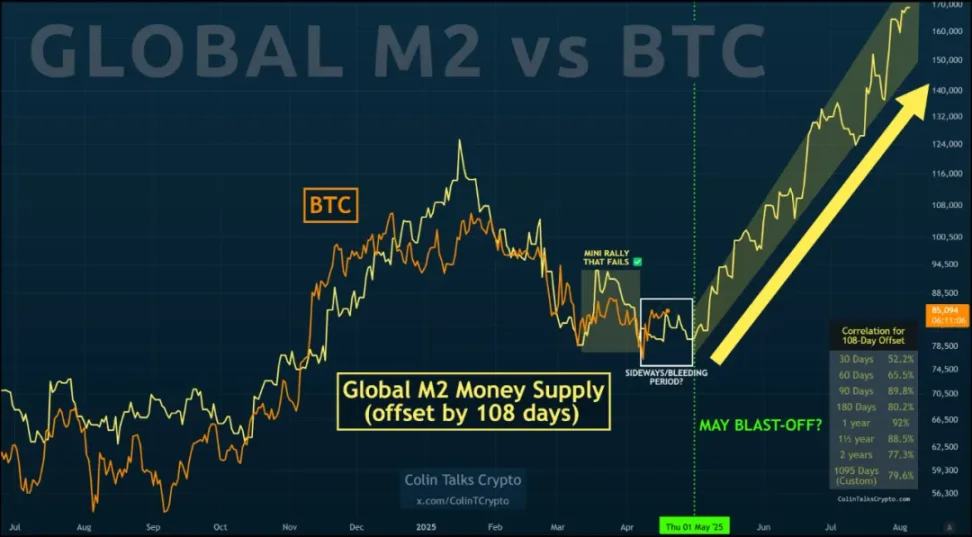
The following chart is a graph showing the correlation between global money supply (M2) and BTC price, which Liu Jiaochain has mentioned multiple times in previous internal references. The chart shows that global macroeconomic liquidity (M2 money supply) after a 108-day lag surprisingly aligns quite well with the BTC trend. What logic is hidden behind this intriguing synchronicity?
The core logic of the model is how global macroeconomic liquidity is transmitted to BTC.
The global M2 indicator is equivalent to the total amount of money printed by central banks, reflecting the liquidity level in the market. When central banks print money extensively (such as the global flood of liquidity after the 2020 pandemic), these new currencies do not immediately rush into the BTC market. The 108-day lag period set in the chart attempts to capture the time difference of fund transmission from central bank "water release" to the crypto market.
Data shows that as the statistical period is extended, the correlation significantly strengthens: the 30-day correlation coefficient is only 52%, while the 3-year cycle correlation reaches 79.6%. This indicates that the BTC price's association with monetary easing is not an instant reaction, but a medium to long-term trend resonance. When market liquidity continues to be loose, some funds will gradually seep into high-risk assets like BTC, but this process requires investor confidence restoration and fund flow path establishment.
When the yellow arrow on the right side of the chart points to "possible breakthrough", the implied logic is: if the current global M2 maintains expansion (such as the Bank of Japan's continued easing, the Fed's pause in rate hikes), calculated according to the 108-day transmission cycle, BTC may usher in a new round of fund-driven rise in May 2025. This time point coincidentally matches the node pointed out in Liu Jiaochain's February 14, 2025 article "Breaking the Cocoon".
However, the model also exposes obvious limitations. The small-scale rebound failure in early 2023 shows that money supply alone cannot fully explain short-term fluctuations. At that time, although global M2 was still growing, the US banking crisis caused funds to temporarily flow to traditional safe-haven assets, and BTC, as an emerging asset, instead encountered a liquidity siphon effect. This reminds us that macroeconomic liquidity is only a necessary condition for coin price, not a sufficient condition.
Obviously, the current scale of the crypto market is still too small compared to the scale of global liquid assets.
BTC plays a contradictory role in the transmission chain of macroeconomic liquidity to the crypto market. On one hand, its fixed total supply makes it viewed by some investors as an anti-inflation tool, and funds may accelerate inflow when the expectation of fiat currency depreciation strengthens; on the other hand, it remains a high-risk asset, and when a liquidity crisis occurs (such as in the initial outbreak of the pandemic in March 2020), investors will prioritize selling BTC for US dollar cash, causing it to fall in sync with risk assets.
This dual nature leads to a non-linear relationship between BTC and M2. The 79.6% correlation data in the past three years has actually gone through multiple "deviation-regression" volatility tests. For example, when the mining industry was cleared out in 2021, policy shocks briefly interrupted the transmission effect of monetary easing, but when the market digested the negative news, the price realigned with the M2 curve. This shows that the model's underlying logic has resilience, but the specific transmission process will be interfered with by exogenous variables such as geopolitics and regulatory policies.
For ordinary investors, the value of this model lies not in predicting specific rises and falls, but in establishing a macroeconomic cognitive framework. When observing that major economies collectively turn to easing (such as rate cuts, quantitative easing), it can be seen as a background signal of BTC's medium to long-term improvement; when global central banks tighten monetary policies, one needs to be wary of the pressure brought by liquidity retreat. The 1095-day (about 3-year) high correlation in the chart suggests that observing from a perspective of 3 years or more may be more valuable than chasing short-term fluctuations.
At the same time, we need to be cautious about equating correlation with causation. BTC price is also influenced by multiple factors such as halving cycles, on-chain technological evolution, and institutional participation. For example, the BTC halving event in 2024 may superimpose with global M2 growth to form a double boost effect, but it may also be offset by regulatory policy changes. Therefore, this model is more suitable as one piece of the market analysis puzzle, rather than the sole decision-making basis.
Extending thoughts from this chart, we may see more clearly BTC's position in the contemporary financial system: it is both a product of global monetary over-issuance and a challenger to the traditional financial order. The 108-day lag effect essentially reveals the efficiency and resistance of fund migration from traditional markets to the crypto world. When mainstream financial institutions begin to include BTC in asset allocation, this transmission cycle may further shorten; when black swan events occur, the lag period may be passively extended. Understanding this dynamic balance may be more valuable than simply focusing on price fluctuations.


