Written by:Bitcoin Magazine Pro
Translated by: Plain Blockchain
In 2025, Bitcoin did not kick off with the explosive start many expected. After breaking through $100,000, a significant pullback occurred, causing investors and analysts to question our position in the overall Bit cycle.
This article will cut through market noise, delving into a series of key on-chain data and macro indicators to assess whether the Bit bull market remains intact or faces deeper adjustment.
Healthy Correction or Cycle Termination?
A good starting point is the MVRV-Z score, a long-used valuation indicator comparing market value to realized value. After reaching a peak of about 3.36, the MVRV-Z score has dropped to around 1.43, coinciding with Bit's decline from over $100,000 to a low of $75,000. At first glance, this 30% pullback seems severe.
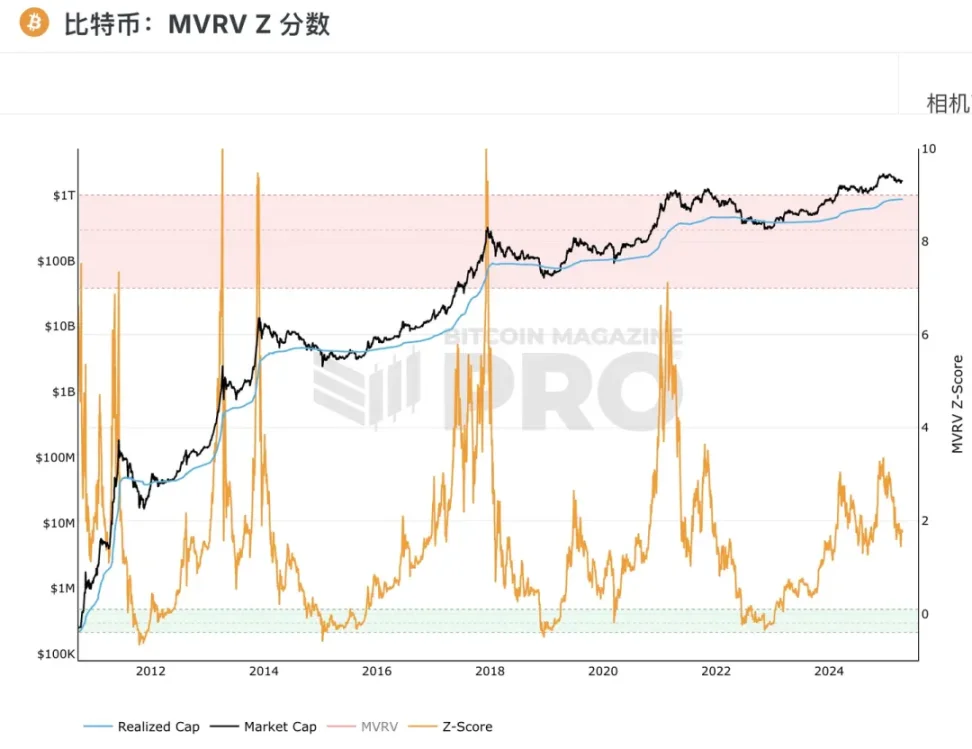
Figure 1: Recent MVRV Z score has rebounded from the 2025 low of 1.43
Historically, periods with MVRV-Z scores similar to the current level often mark local bottoms, not tops. Previous cycles, including 2017 and 2021, experienced similar pullbacks, after which prices recovered. In short, while this decline has shaken investor confidence, it is consistent with historical corrections during bull markets.
Focus on Smart Money
Another key indicator is the Value Days Destroyed (VDD) multiple. This indicator measures Bit's movement speed, weighted by the time coins are held. VDD multiple peaks typically indicate experienced holders taking profits, while low levels suggest accumulation.
Currently, this indicator is at a low in the "green zone", similar to levels seen in late bear markets or early recovery stages. Given the sharp reversal from over $100,000, we may be witnessing the end of a profit-taking wave, with signs of long-term accumulation reappearing, signaling expectations of higher prices.
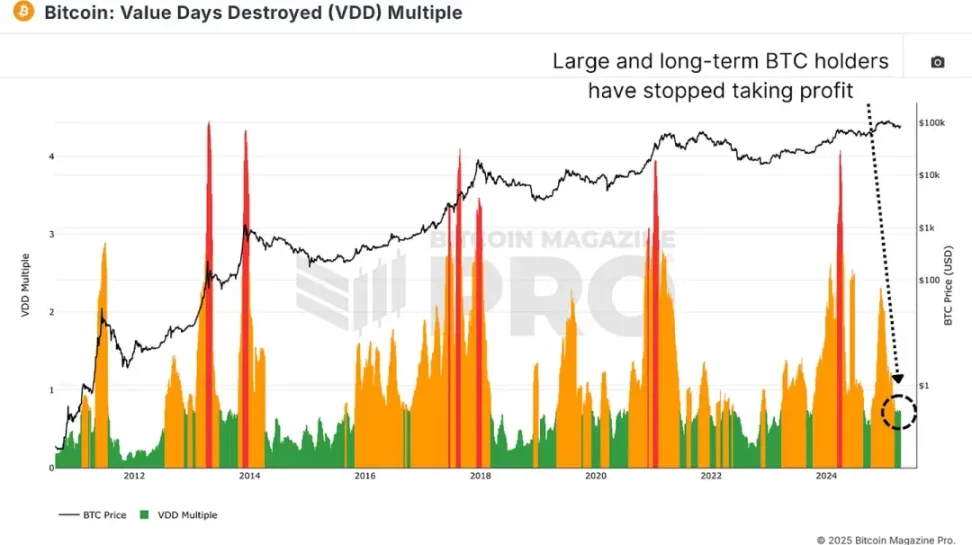
Figure 2: Current VDD multiple indicates long-term holders are in an accumulation phase
The Bit Cycle Capital Flow chart is one of the most insightful on-chain data visualizations, segmenting capital flow by coin age. It distinguishes between different groups, such as new market participants (holding less than 1 month) and medium-term holders (1-2 years), to observe capital migration. When Bit reached its $106,000 peak, the red band (new holders) saw a surge in activity, indicating FOMO-driven buyers rushing in at the top. Since then, this group's activity has significantly cooled, returning to levels consistent with early to mid-bull market.
Conversely, the 1-2 year holder group (typically macro-savvy accumulators) has begun rising again. This inverse correlation is crucial: long-term holders accumulate at market lows, while newer participants surrender or exit at lows. These dynamics are similar to the accumulation-distribution patterns in earlier bull cycles, particularly in 2020 and 2021.
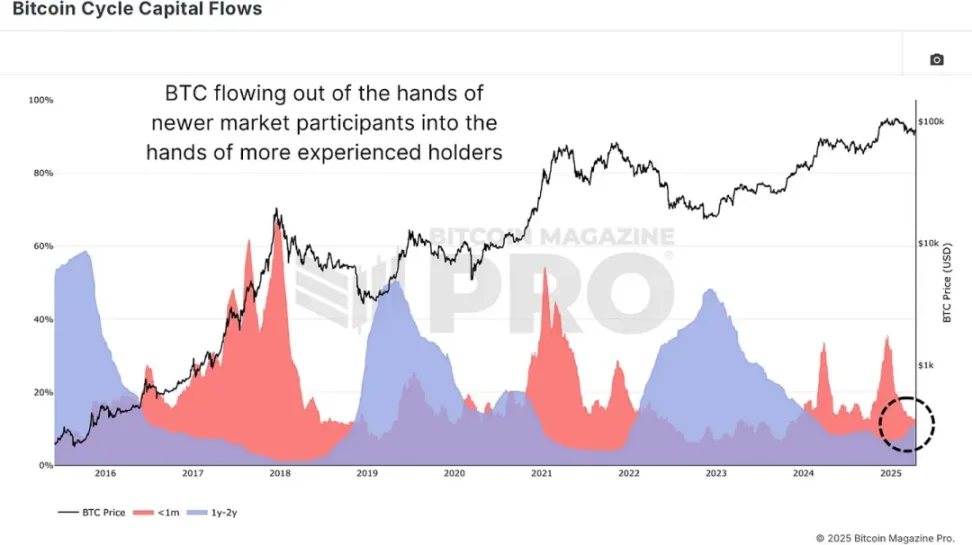
Figure 3: Bit Cycle Capital Flow chart shows Bit flowing to more experienced holders
What Stage Are We In Now?
From a macro perspective, we divide the Bit market cycle into three key stages:
Bear Market Stage: Deep correction (70-90%)
Recovery Stage: Reclaiming previous highs
Bull Market / Exponential Stage: Parabolic rise after breaking previous highs
Bear markets in 2015 and 2018 lasted about 13-14 months. Our recent bear market also lasted 14 months. Past cycle recovery stages lasted around 23-26 months, and our current cycle is within this time window.
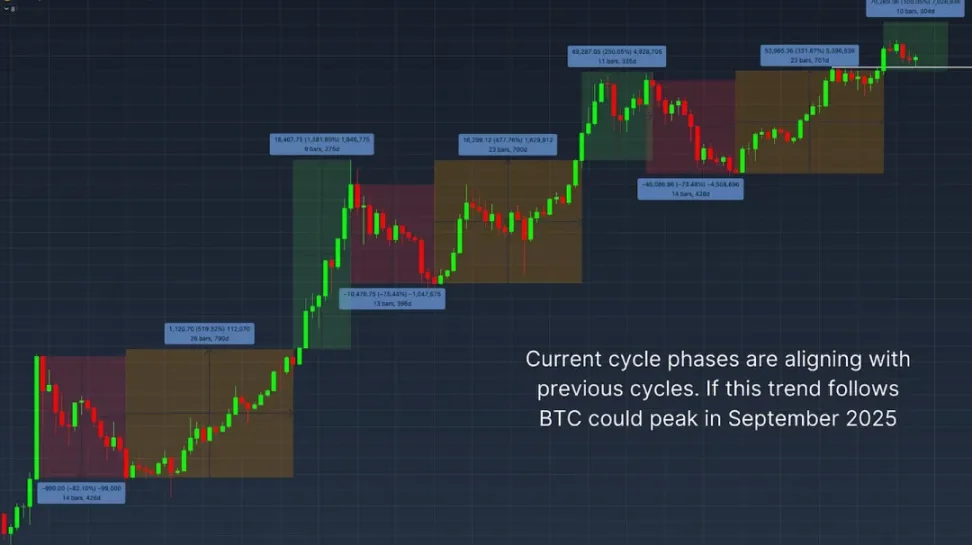
Figure 4: Estimating potential bull market peak using past cycle trends
However, this bull market stage is somewhat unusual. After breaking the historical high, prices did not immediately surge but instead corrected. This might indicate we are forming a higher low before entering the steeper part of the exponential stage. If we take the average of 9 and 11 months from past cycle exponential stages, the bull market could peak around September 2025, assuming the bull market stage recovers.
Macro Risks
Despite encouraging on-chain data, macro headwinds remain. Analysis of the S&P 500 and Bit correlation chart shows Bit remains highly correlated with the US stock market. As fears of global economic recession intensify, continued weakness in traditional markets may limit Bit's upside in the short term.
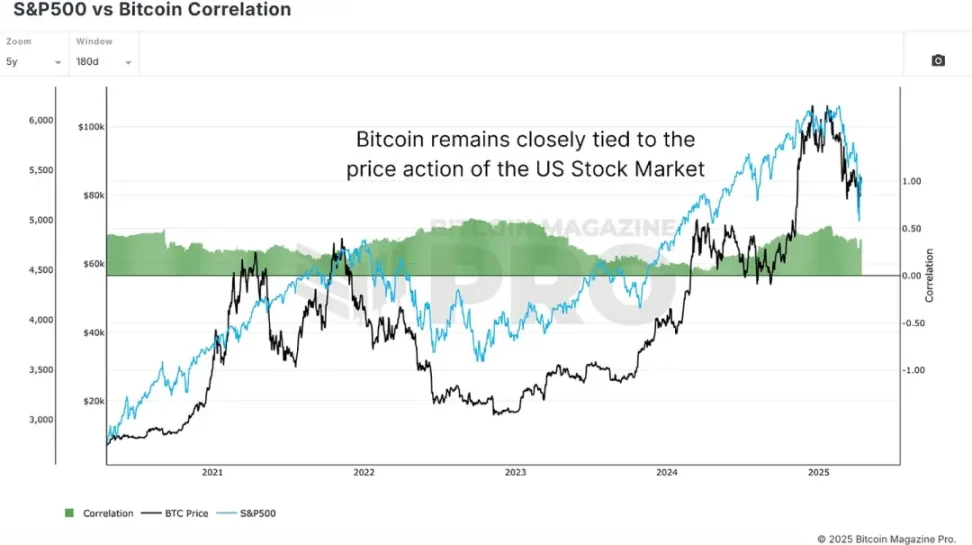
Figure 5: Bit's correlation with the US stock market
Summary
As seen in our analysis, key on-chain indicators like MVRV Z score, Value Days Destroyed, and Bit Cycle Capital Flow show healthy, cycle-consistent behavior and signs of long-term holder accumulation. However, significant macro uncertainty remains a key risk to monitor.
This cycle is slower and less uniform than past cycles but has not broken historical structures. If further traditional market deterioration can be avoided, Bit appears ready for the next wave of appreciation, potentially peaking in Q3 or early Q4.