1. Market Review This Week (December 20-26)
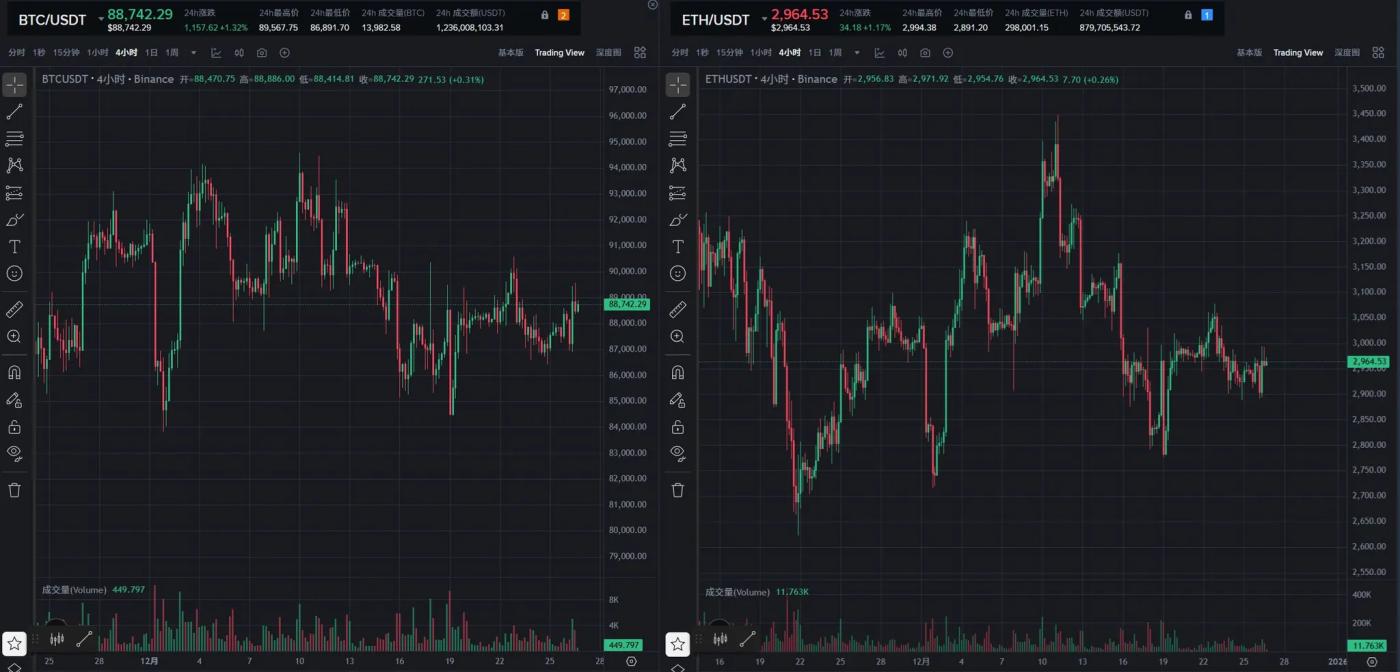
Last week, the market trended downwards, and the $85,000 technical support level we previously emphasized proved effective. After BTC touched a low of $84,500 on Friday, it began a rebound this week. From the daily and weekly charts, the $85,000 support level was validated after the previous continuous decline, and the market maintained its rebound momentum over the weekend, showing an overall pattern of fluctuating upward movement.
2. Short- to medium-term data changes affecting market trends this week
2.1 Stablecoin Fund Flow Status
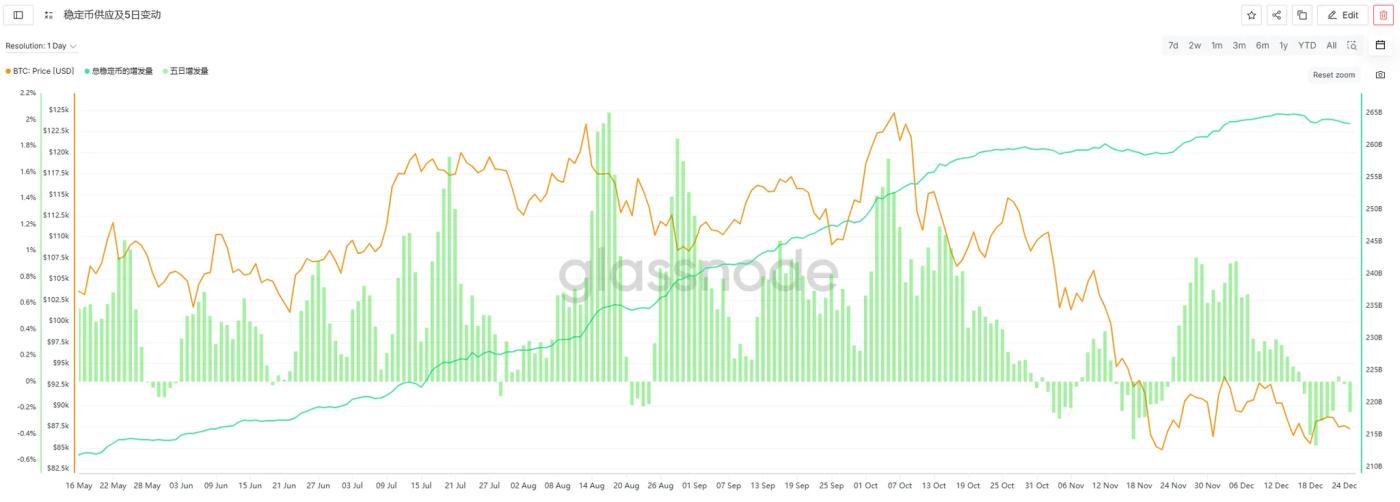
This week (December 20-26), the weekly issuance of stablecoins was -$326 million, continuing the outflow trend, but the scale of the outflow narrowed significantly. Compared to last week's negative issuance of $824 million, the daily average negative issuance this week fell from -$117.7 million to -$46.5 million, with overall fund flow increasing by 60% week-on-week. The overall market was mainly volatile this week, without a sustained decline, which corroborates the weakening trend of stablecoin outflows.
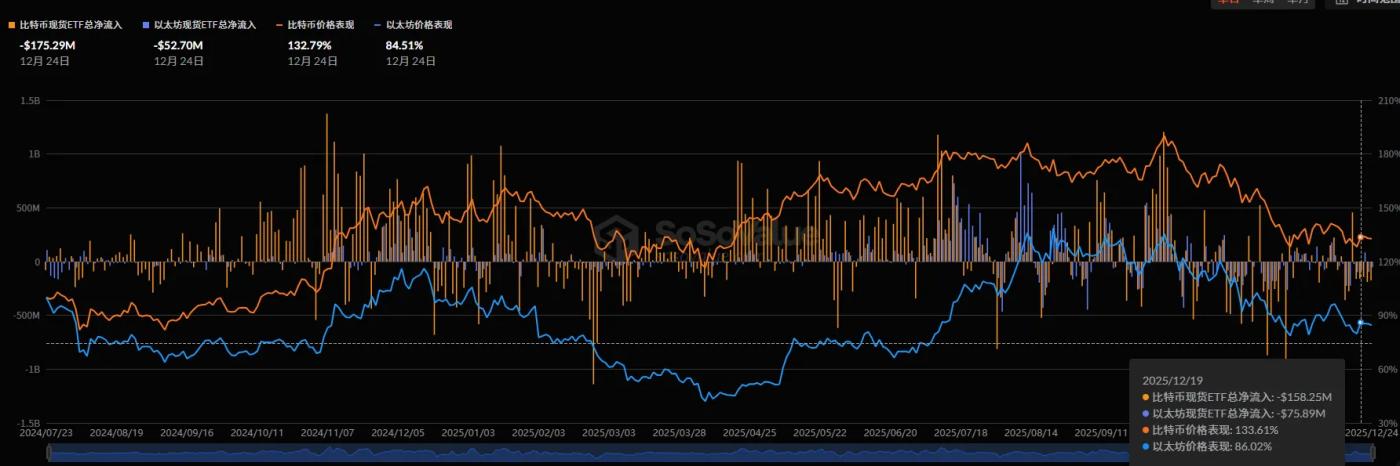
2.2 ETF Fund Flows
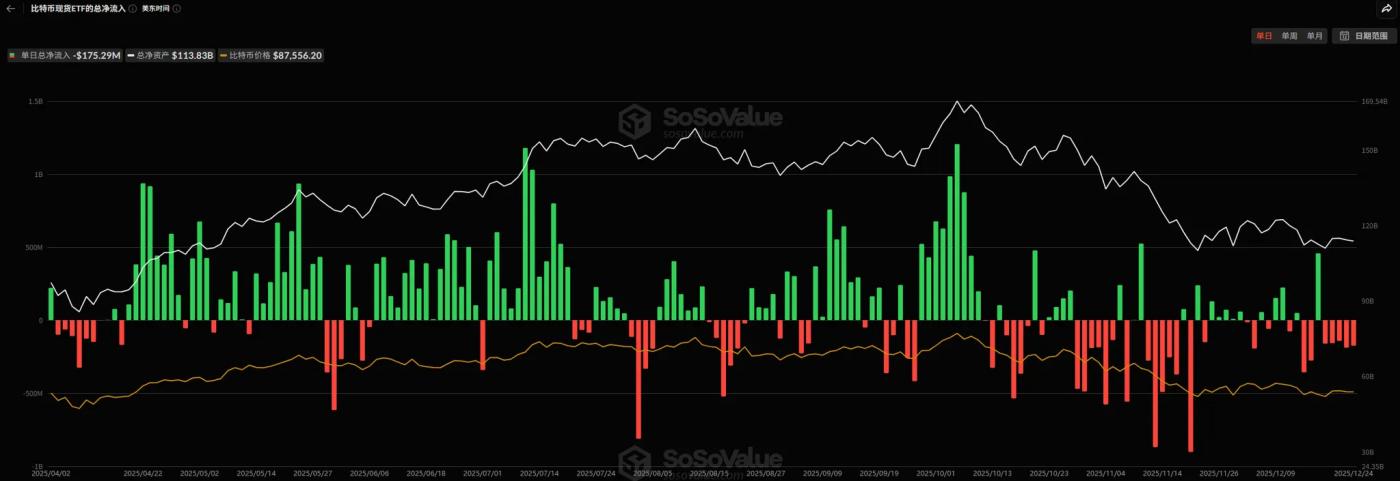
This week, net outflows from Bitcoin ETFs widened further, reaching $664.37 million, an increase of $374.72 million from last week. Looking at daily fund flow data, there are currently no signs of a regular weakening in the daily net outflows from ETFs. Although BTC prices have rebounded, this can only be characterized as a short-term technical rebound. For the market to achieve a trend reversal, a return to net inflows from Bitcoin ETFs is a crucial prerequisite.
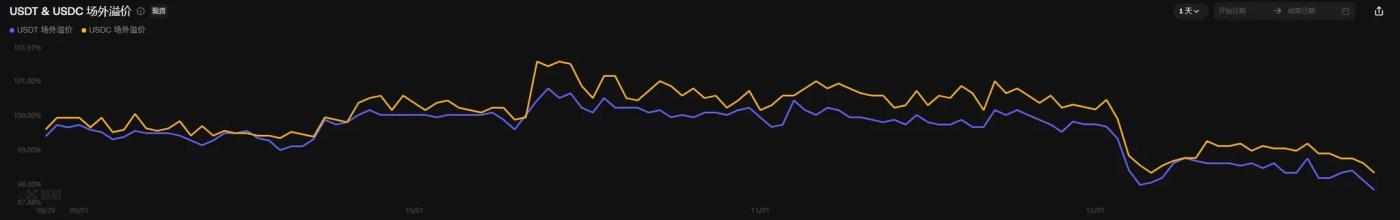
2.3 Off-exchange premium/discount
The over-the-counter (OTC) premium/discount for USDT and USDC declined slightly this week. Currently, USDT's premium/discount is 97.86%, and USDC's is 98.36%, both at relatively low levels for the year. This reflects continued weak market sentiment, insufficient willingness of OTC funds to buy the dips, and signs of capital outflow.
2.4 Ethereum ETF
This week, the Ethereum ETF saw a net outflow of $139.53 million, a significant decrease compared to last week's net outflow of $587.5 million. Ethereum's price fluctuated this week without a sustained decline, mirroring the narrowing ETF outflows. If this trend continues, it will provide strong support for an Ethereum rebound.

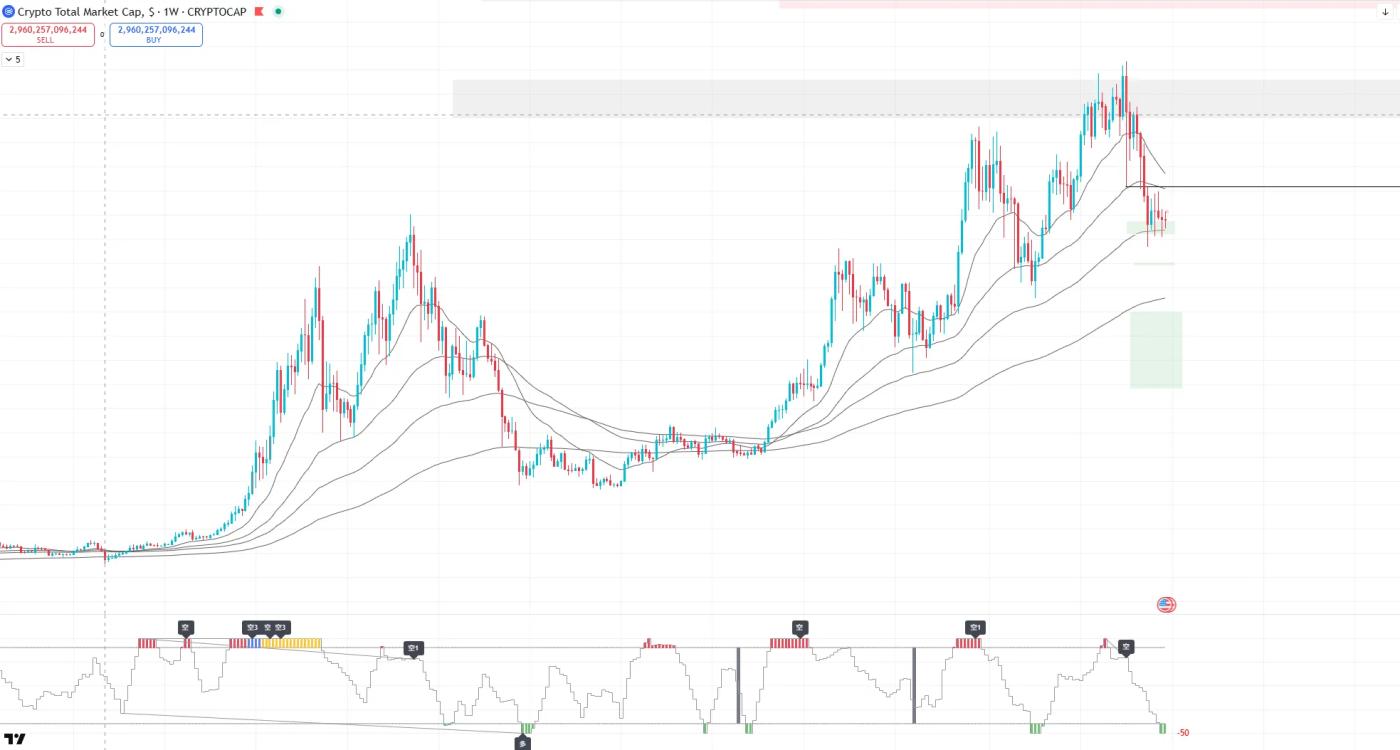
2.5 Total Market Capitalization of the Crypto Market
This week, the total market capitalization of the crypto market fell back to around $3 trillion, precisely testing the weekly EMA100 moving average. Current indicators have shown weekly oversold signals, and considering the historical performance of weekly oversold signals since 2021, from a technical perspective, the market has the potential for a rebound.
3. Mid-term data changes affecting market trends this week
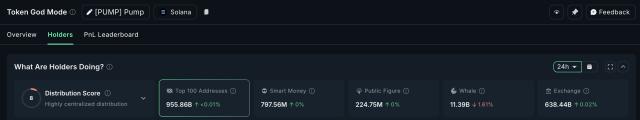
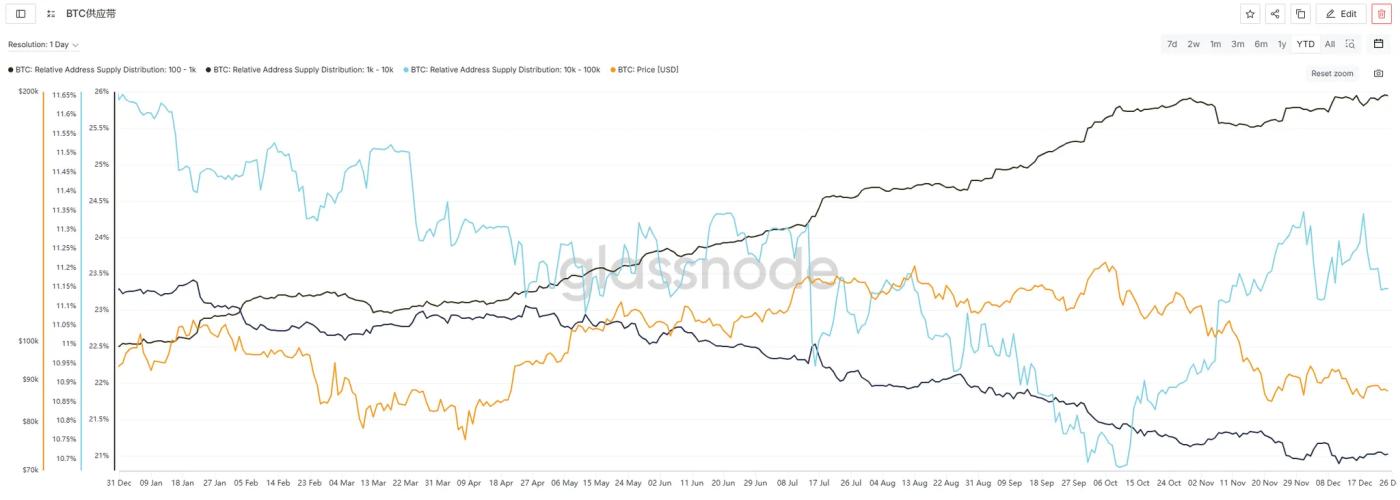
Percentage of token holding addresses and URPD
Looking at the percentage of Bitcoin holding addresses, the percentage of addresses holding 100-1K BTC rose from 25.813% to 25.951% this week, showing a slight increase in holdings; the percentage of addresses holding 10K-100K BTC fell from 11.341% to 11.146%, indicating some reduction in holdings; and the percentage of addresses holding 1K-10K BTC rose slightly from 20.972% to 21.022%, showing an overall slight fluctuation.
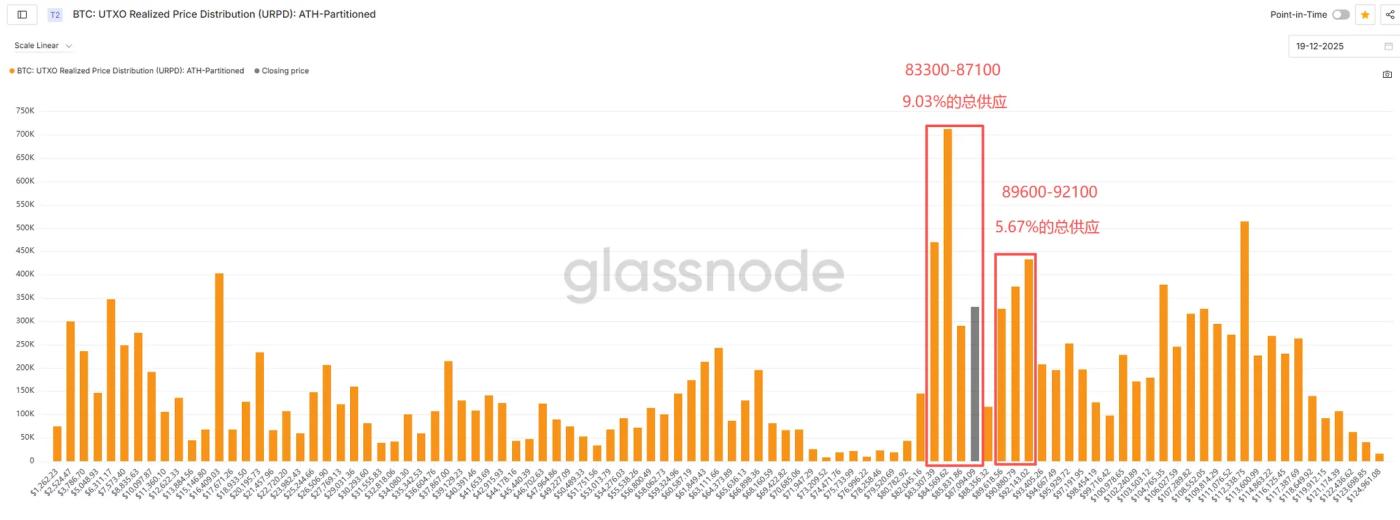
In terms of BTC supply structure, the accumulated supply in the $83,300-$87,100 price range increased from 9.03% to 9.93% of the total supply, a rise of 0.9 percentage points. Specifically, the supply accumulation around $87,100 reached 3.15% of the total supply, showing significant turnover compared to last week, indicating intense competition between bulls and bears. This price level is expected to form strong support in the future.

4. Analysis of the Counterfeit Market
This analysis of the altcoin market will be presented in three main sections: market overview, secondary market trends, and primary market data, providing a comprehensive overview of the current dynamics of the Altcoin market.
4.1 Market Overview
Altcoin capitalization
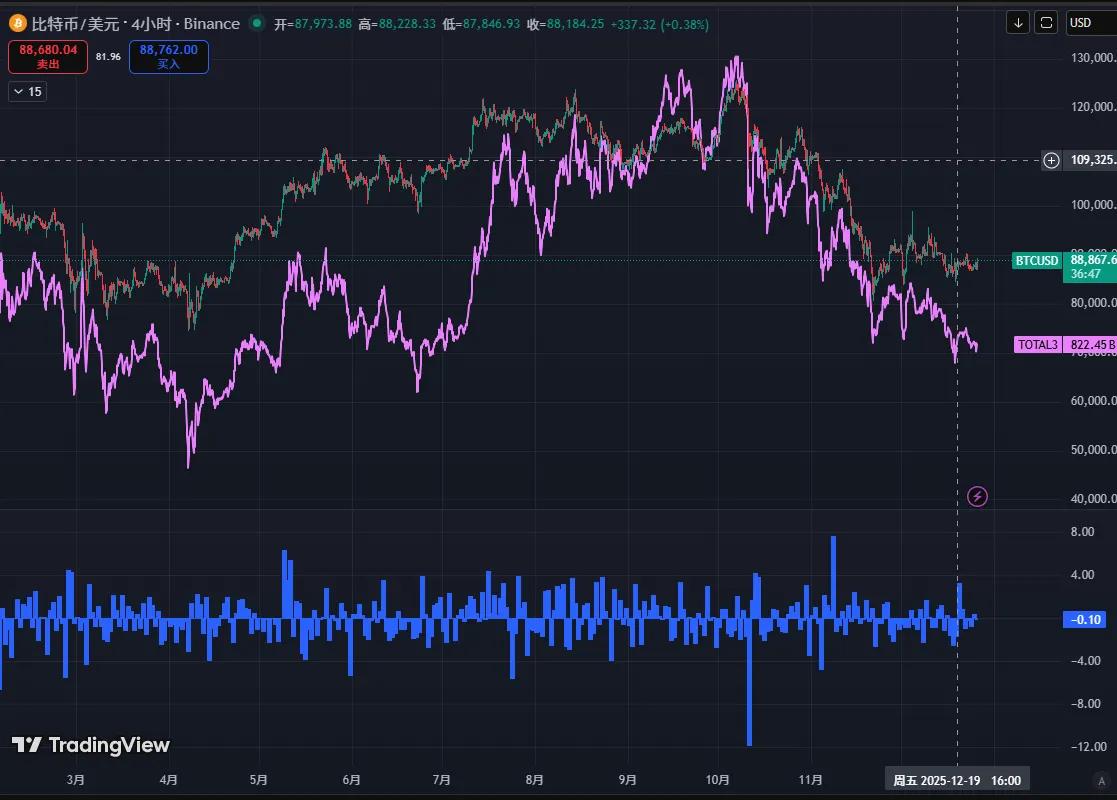
This Friday, the total market capitalization of all tokens (excluding BTC and ETH) reached $822.3 billion, a 1.95% increase week-over-week. BTC traded in a narrow range around $88,000 this week, with low volatility. Despite the continued rebound in US and Chinese stocks, BTC did not follow suit, while the commodity market performed strongly. From a fund flow perspective, BTC remains at the bottom of the traditional financial allocation system, and in the absence of significant new capital inflows, it is likely to maintain range-bound trading.
On-chain TVL Overview
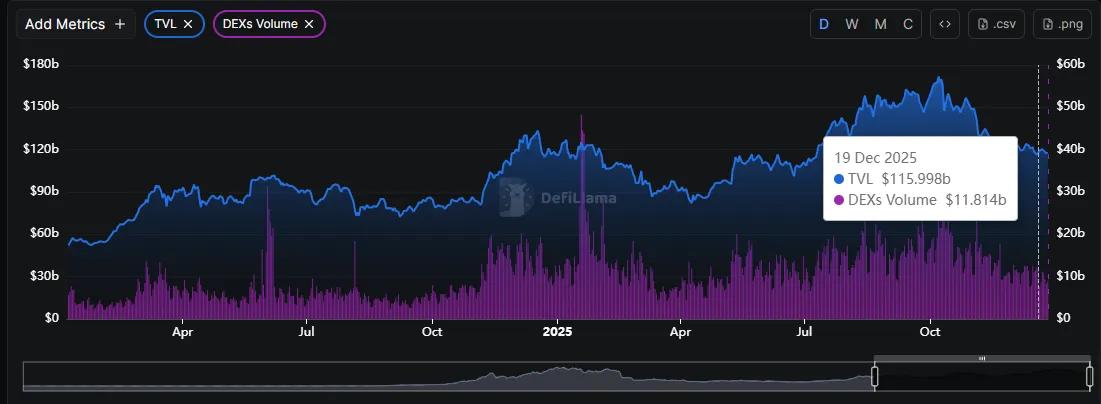
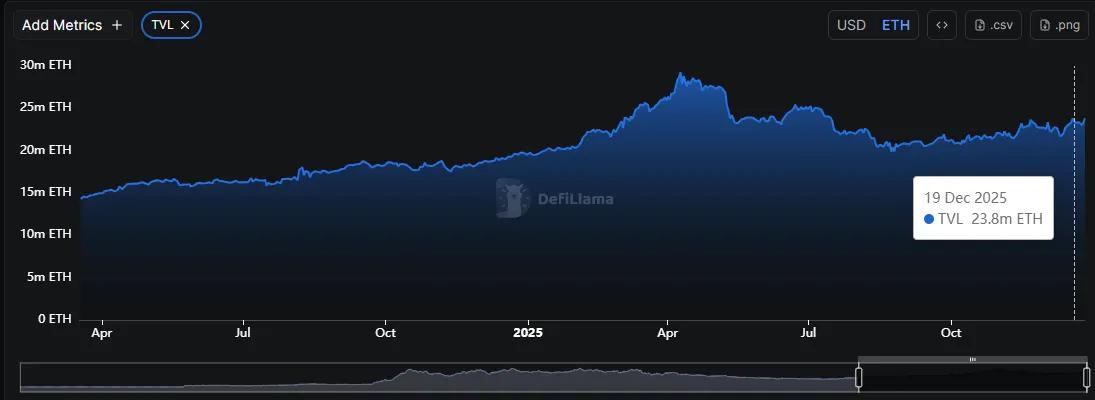
Total on-chain TVL reached $117.5 billion, a 1.29% increase month-over-month, showing an overall volatile trend. ETH staking volume remained stable, exhibiting a fluctuating upward trend, reflecting relatively solid confidence among long-term holders.
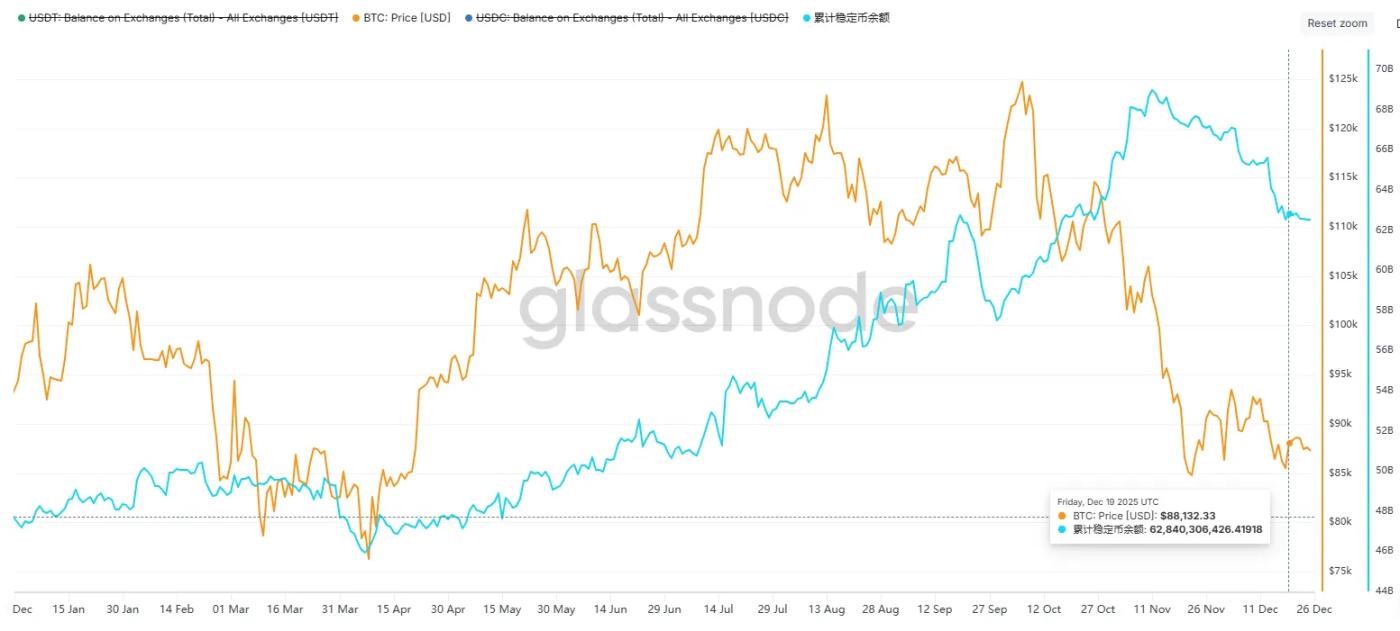
Stablecoin market capitalization and exchange reserves
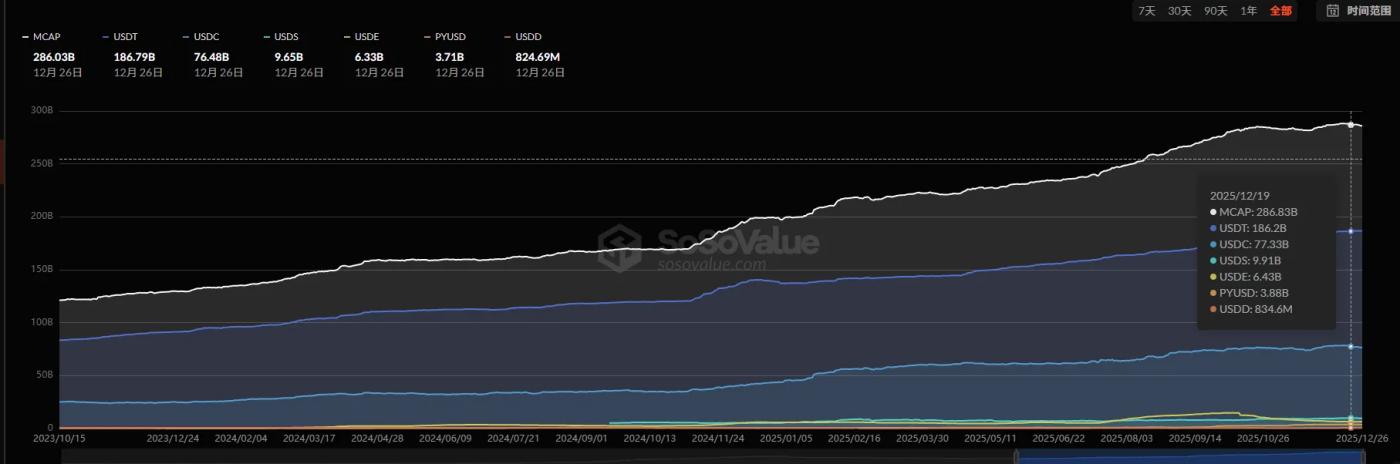
The total market capitalization of stablecoins was $286 billion, a decrease of 0.28% week-over-week, with a net outflow of $800 million from fiat-backed stablecoins. The current performance of the crypto market is decoupled from traditional financial markets, exhibiting relative weakness, with market sentiment not yet showing significant recovery and a strong wait-and-see attitude prevailing. Exchange stablecoin balances declined slightly this week, and no stablecoin inflows occurred during the BTC rebound, indicating that the market has not yet fully stabilized.
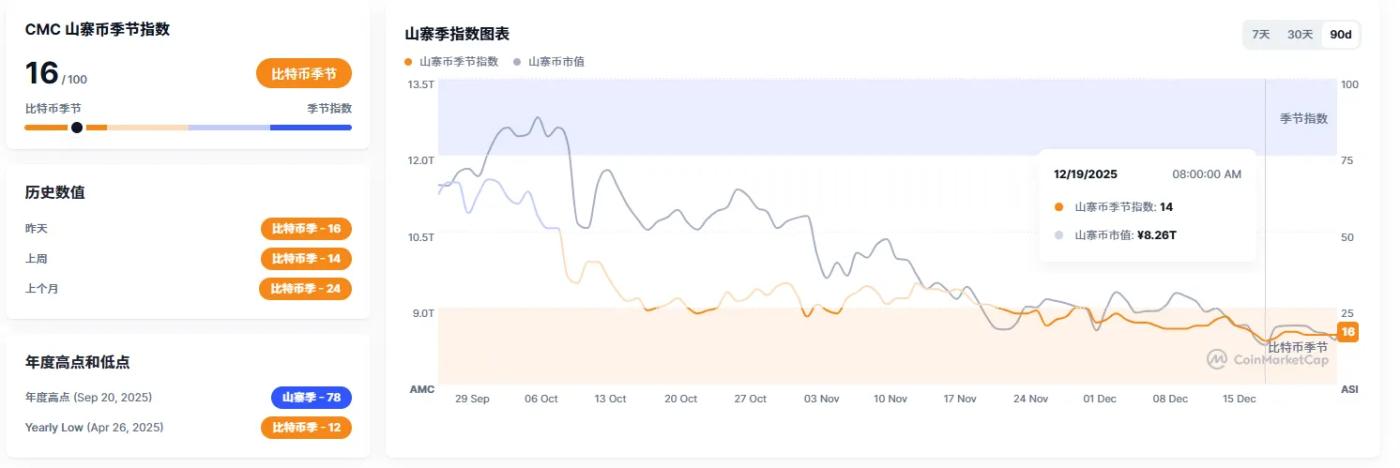
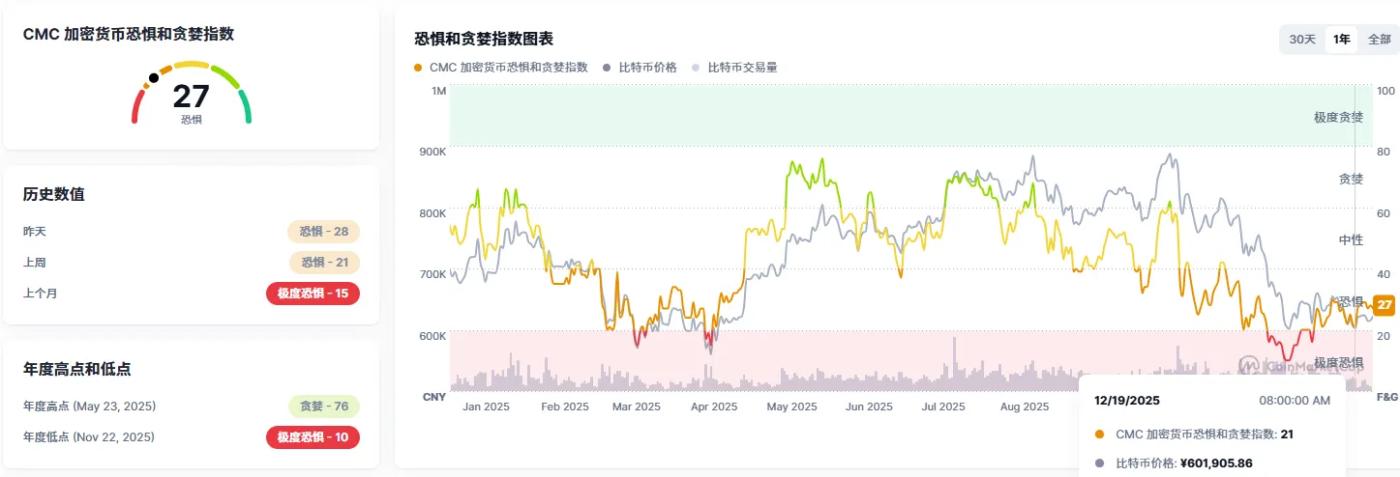
The Counterfeit Index and Market Sentiment
This Friday, the altcoin index was 16, with major Altcoin maintaining low-level fluctuations and market trading activity remaining sluggish. The market sentiment index rebounded to 27, showing some improvement from last week, with individual Altcoin performing actively, but overall market enthusiasm was insufficient.
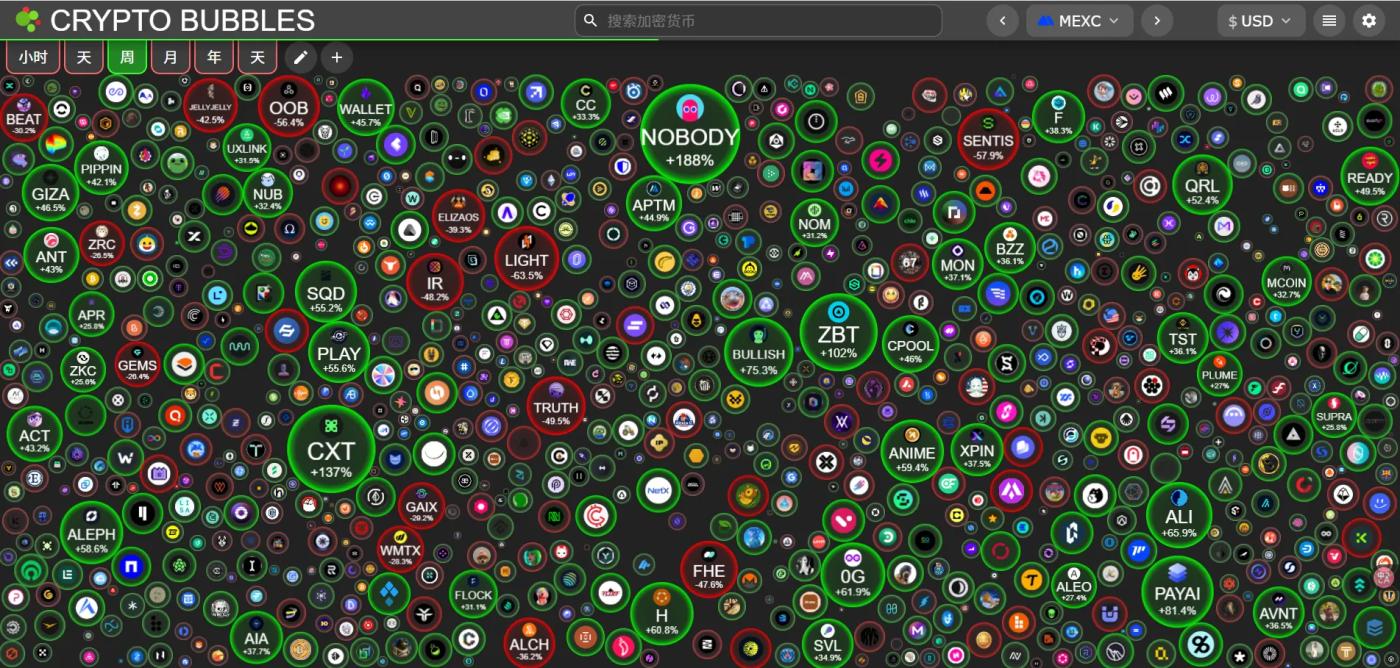
Overview of counterfeit goods
This week, the altcoin market was generally volatile, with some tokens bucking the trend and rising. Benefiting from a marginal improvement in stock market sentiment, the short-term sentiment and downside potential of the crypto market received some support. The best-performing tokens were mainly small-cap MEME tokens and highly recognizable trending tokens, but the momentum was weak and it was difficult to form a sector-wide联动效应 (linkage effect).
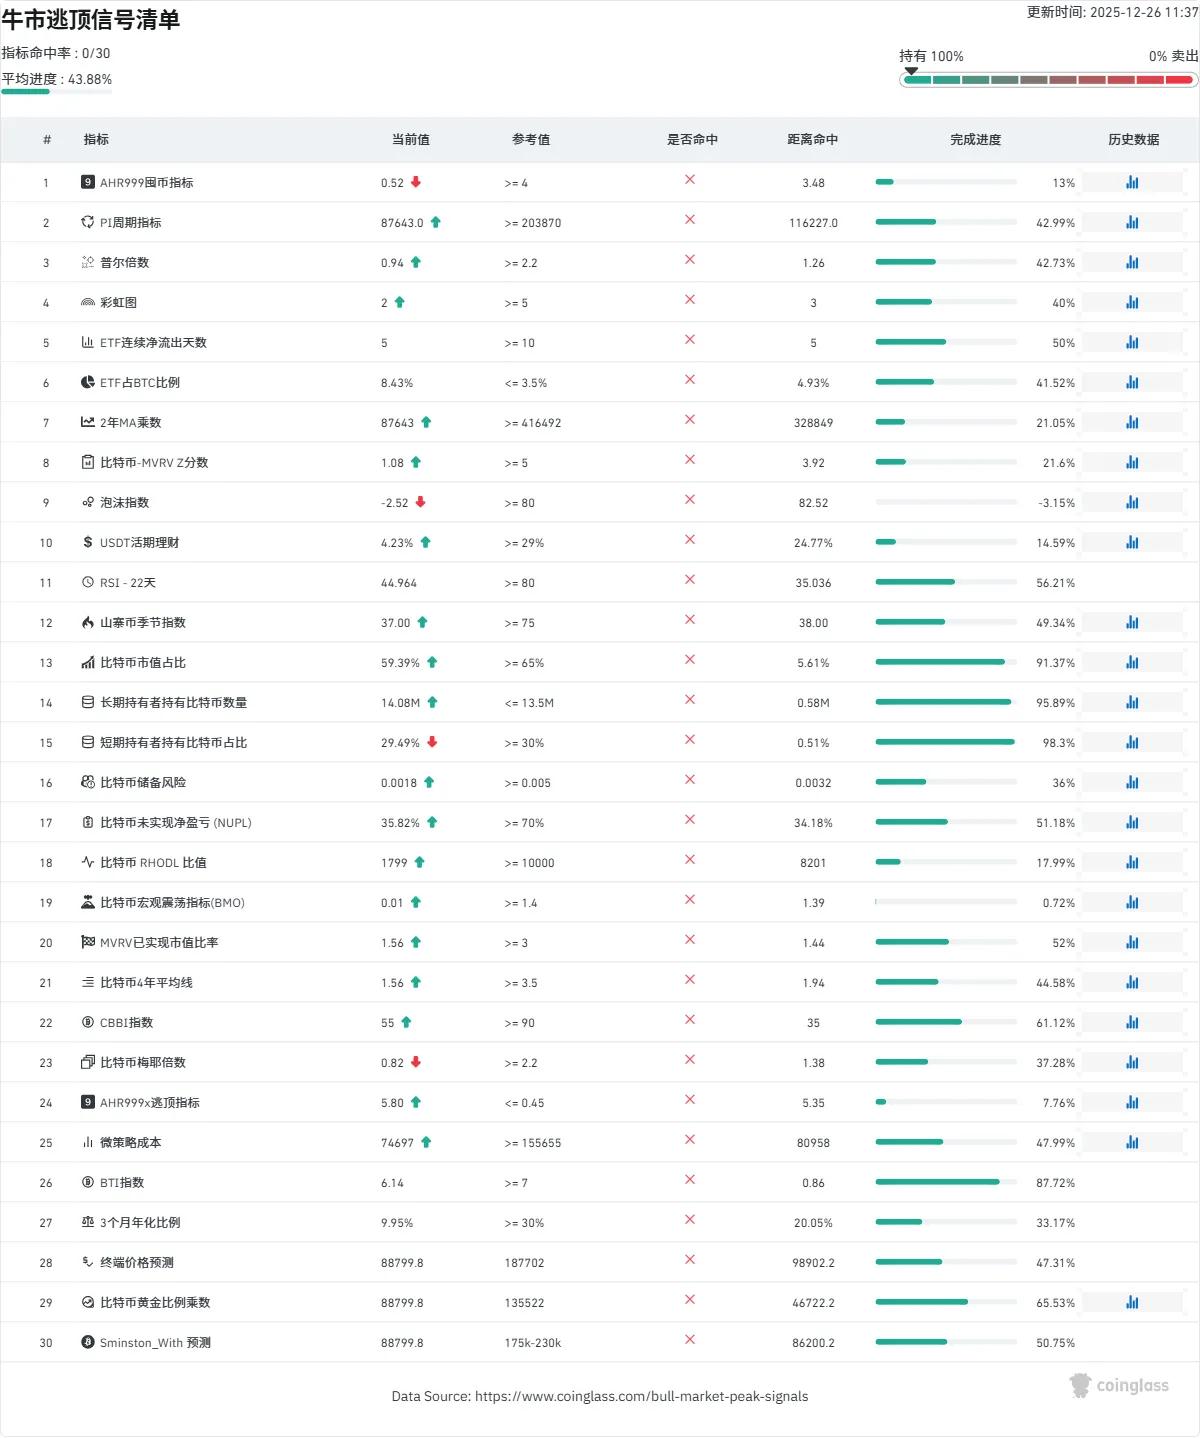
Top-selling indicator and counterfeit popularity
This week, the top-selling indicator did not trigger any alarms, but the proportion of short-term BTC holders has increased significantly, approaching the warning threshold, so the risk of a short-term pullback should be noted. In terms of funding rates, most Altcoin still have negative rates this week, but overall there is a marginal improvement trend, and market speculative sentiment has warmed up somewhat.
4.2 Secondary Market Analysis
4.2.1 Analysis of the strengths and weaknesses of counterfeit products
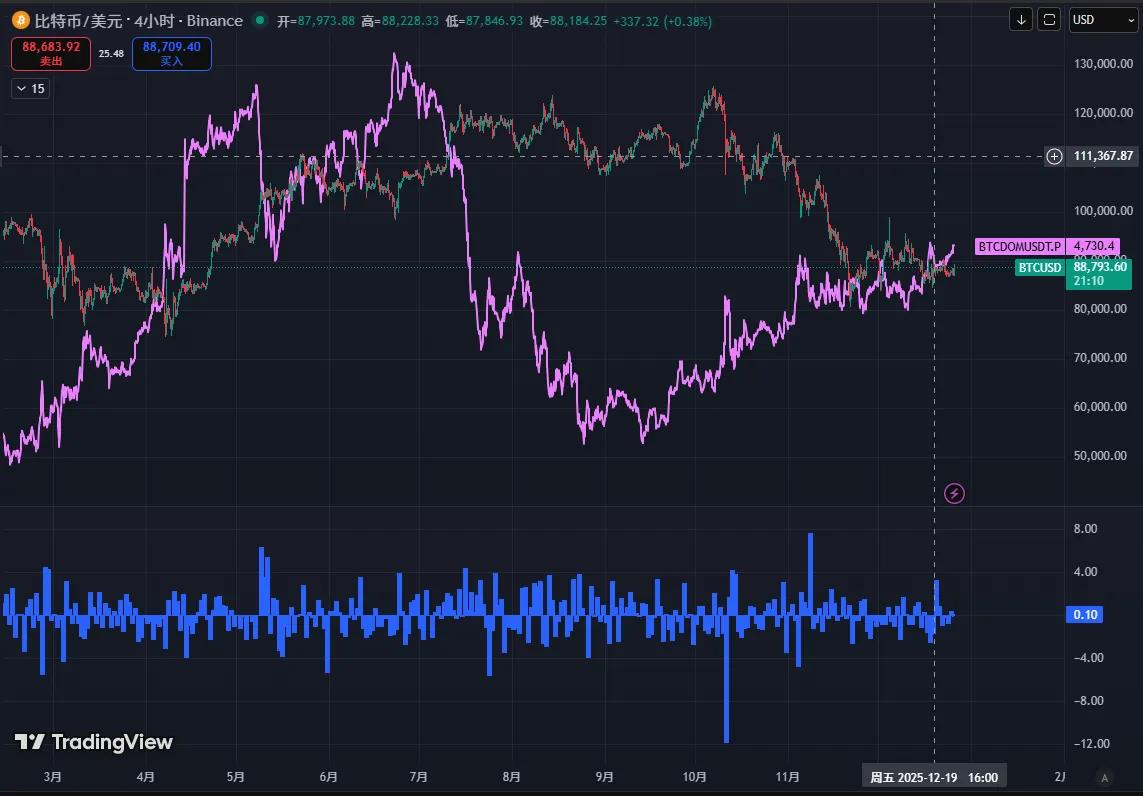
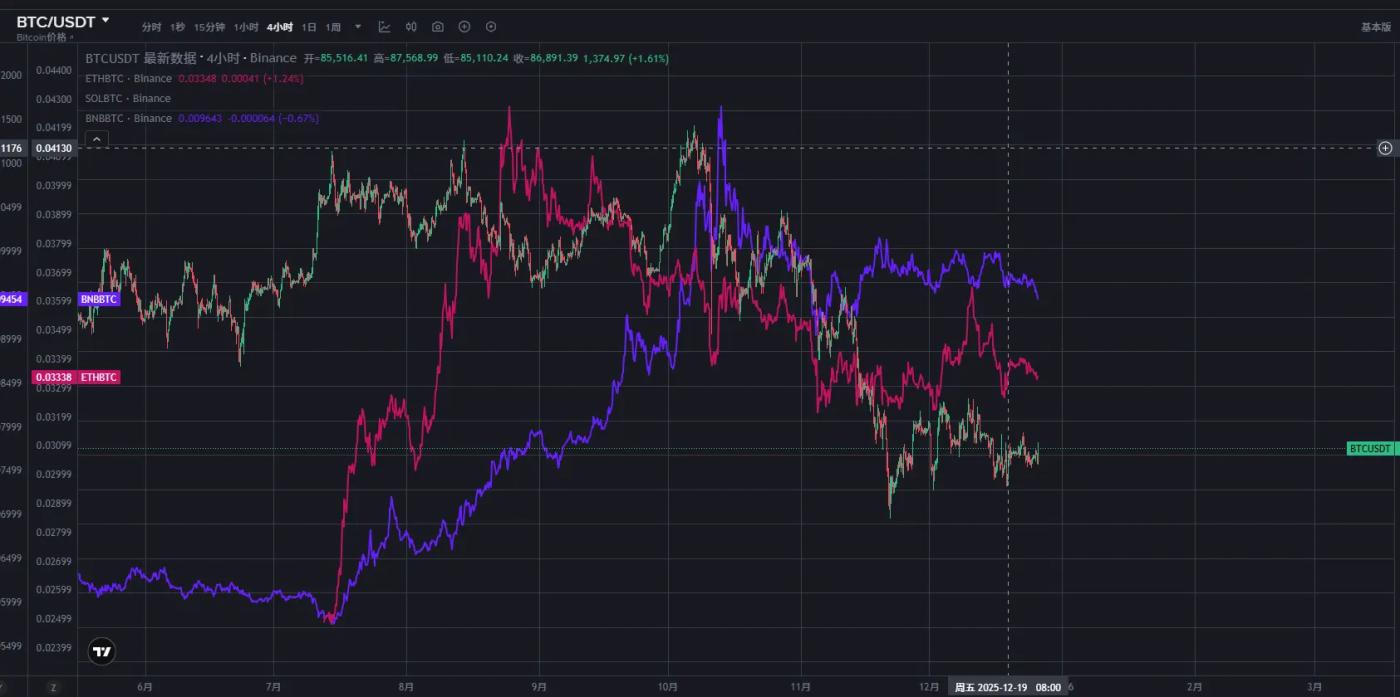
BTC's market share was 65.76% this week, up 0.1% week-on-week, maintaining its recent high level of fluctuation. Major currency pairs such as SOL/BTC, ETH/BTC, and BNB/BTC fluctuated lower this week, and are still in a fluctuating or downward channel overall. The weakness of Altcoin relative to BTC has not changed significantly.
4.2.2 Market Flow
In terms of sector performance, gains and losses were mixed this week, with RWA and PerpDEX sectors leading the gains and becoming the market focus. These two sectors align with long-term market trends and continue to attract capital attention. Regarding institutional funds, BTC and ETH ETFs saw continued outflows this week and have not yet shown signs of stabilizing; data company Bitmine did not make any purchases this week, indicating low institutional participation.

4.3 Primary Market Data Analysis
4.3.1 Current Status of the Four Major Public Blockchains
This week, the TVL (TVL) of the four major public blockchains showed a slight upward trend, but the increase was lower than the price increase. ETH TVL rose from $67.2 billion to $68.1 billion, a 1.48% increase week-over-week; SOL and BSC TVL remained stable at $8.3 billion and $6.4 billion respectively; BASE TVL increased from $4.2 billion to $4.4 billion, a 4.76% increase week-over-week, showing relatively strong performance.
4.3.2 On-chain data analysis
On-chain asset flow
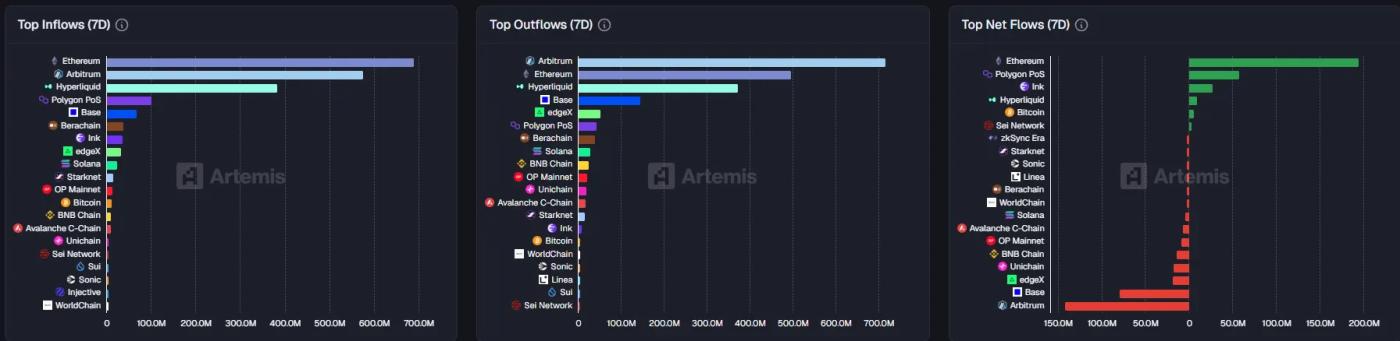
This week saw the largest increase in USDT issuance, while USDC experienced a significant outflow, and funds continued to withdraw substantially from CEXs, indicating that the short-term market liquidity remains tight. Regarding DeFi bridging asset flows, the ETH chain saw the largest net inflow, while the ARB chain experienced the largest outflow, resulting in relatively small overall fund flows and a rapid narrowing of market volatility.
On-chain user activity and speculative sentiment
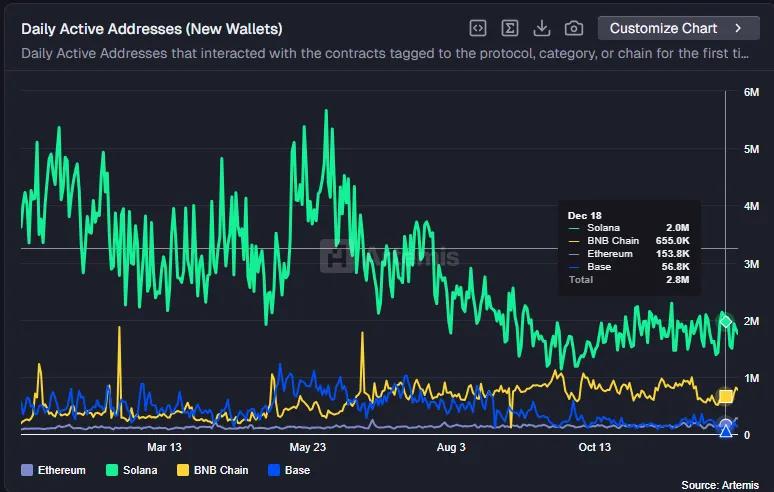
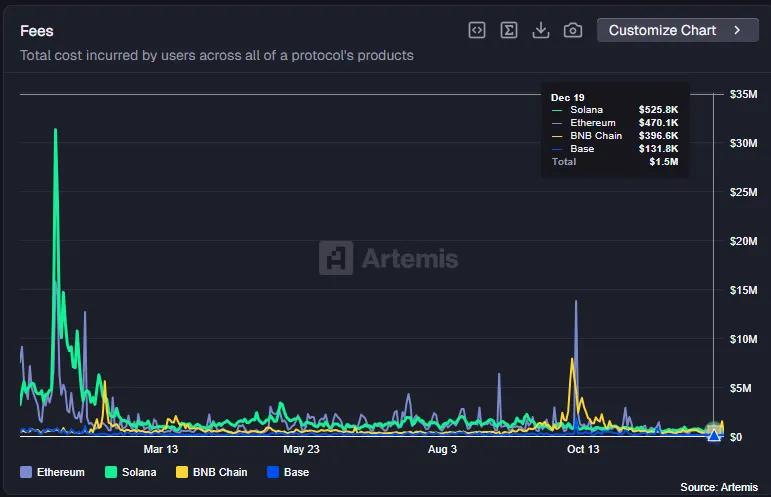
Overall on-chain user activity was moderate this week, but showed signs of marginal improvement. DEX protocol revenue, active users, and trading volume all saw slight increases compared to the previous week, but overall activity remained low and the gains were limited, indicating that market speculative sentiment is still in a low-level recovery phase.
On-chain prosperity and decline index
Based on the TVL changes of the four major public chains and on-chain data performance, a weighted summary is generated to form the On-Chain Prosperity/Consumption Index (maximum score 100), with specific interval definitions as follows:
Extremely Prosperous: 80 points and above
Ascending line: 60-79 points
Decline line: 50-59 points
Bear Market: 30-49 points
The data in this report was compiled and edited by WolfDAO. Please contact us if you have any questions for updates.
Written by: WolfDAO (X: @10xWolfdao)