Bear markets are a good time to learn. , Here's a ultimate way to use RSI.
Absolutely S-class alpha .
The methods you've used in the past are absolutely wrong, and RSI has never been a beginner's indicator .
It's important to know that RSI is a Relative Strength Index (RSI). , It is a kinetic energy indicator.
Initially, people would use the terms "overbuying" and "overselling" to understand this. , In recent years, people have started using RSI divergence to analyze charts.
However, the greatest treasure of RSI lies in its ability to identify divergences and pullbacks in trend-following trading, which is the key to getting on board during major trends.
In fact, there are two main strategies for RSI:
1. Utilizing RSI divergence to capture kinetic energy shifts
RSI divergence is an application of a momentum indicator that identifies discrepancies between underlying market momentum and price behavior, potentially indicating an impending price reversal or correction.
Validity Rules for Trading Divergence
Follow the trend: Divergence that aligns with the direction of the "main trend" is more powerful and has a higher success rate.
"The power of following the trend is greater."
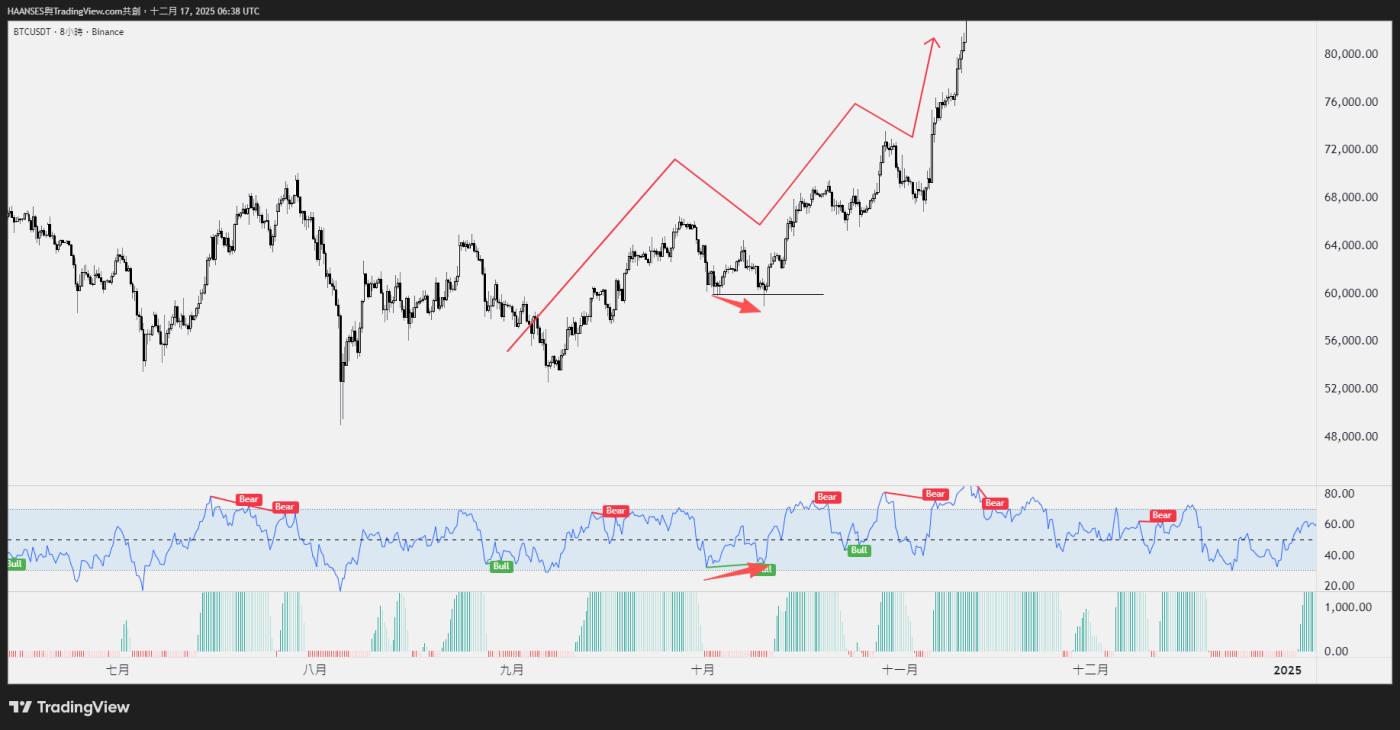
Handling divergences against the main trend: Divergences against the main trend are relatively weak. If you trade in such a situation, you must set a more aggressive take-profit order to quickly realize profits, or choose not to trade at all.

"Take profits promptly when the price moves against the trend (when it returns to the 50-day moving average)."
Location of occurrence: Divergence should occur in the extreme areas of the RSI, i.e., above 70 in the overbought zone or below 30 in the oversold zone.
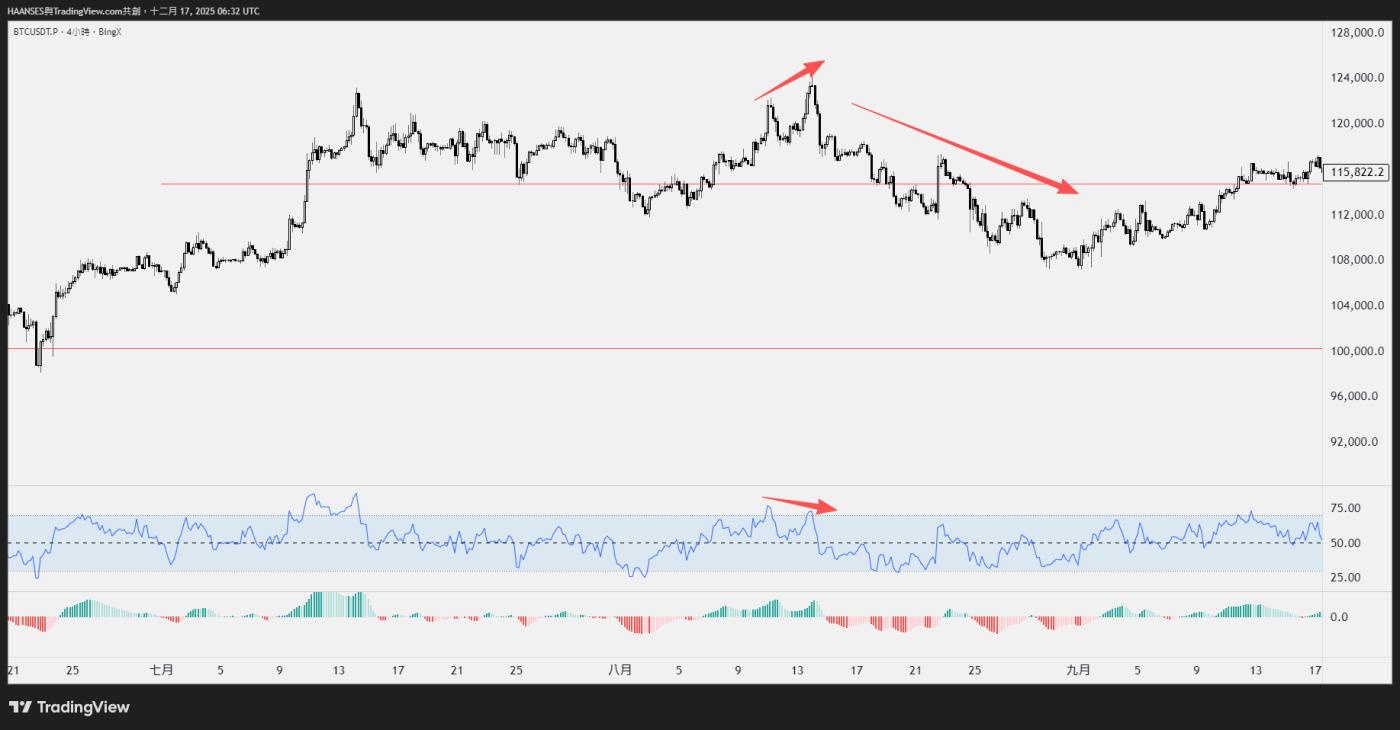
Clear peaks/troughs: Look for two consecutive, clear peaks or troughs.
Time span: Divergence should occur within a very short period of time. If it spans more than 14 candlesticks, the pattern needs to be considered. If it deviates too far, it will be considered invalid.
50-Middle Line (Reset Point): The 50-middle line of the RSI is considered a "reset".
Once the RSI crosses the 50 midline after forming a high or low, it should be considered a restart.
Any divergence that forms after crossing the 50 line should not be compared with the peaks or troughs before the crossing; such divergences are invalid.
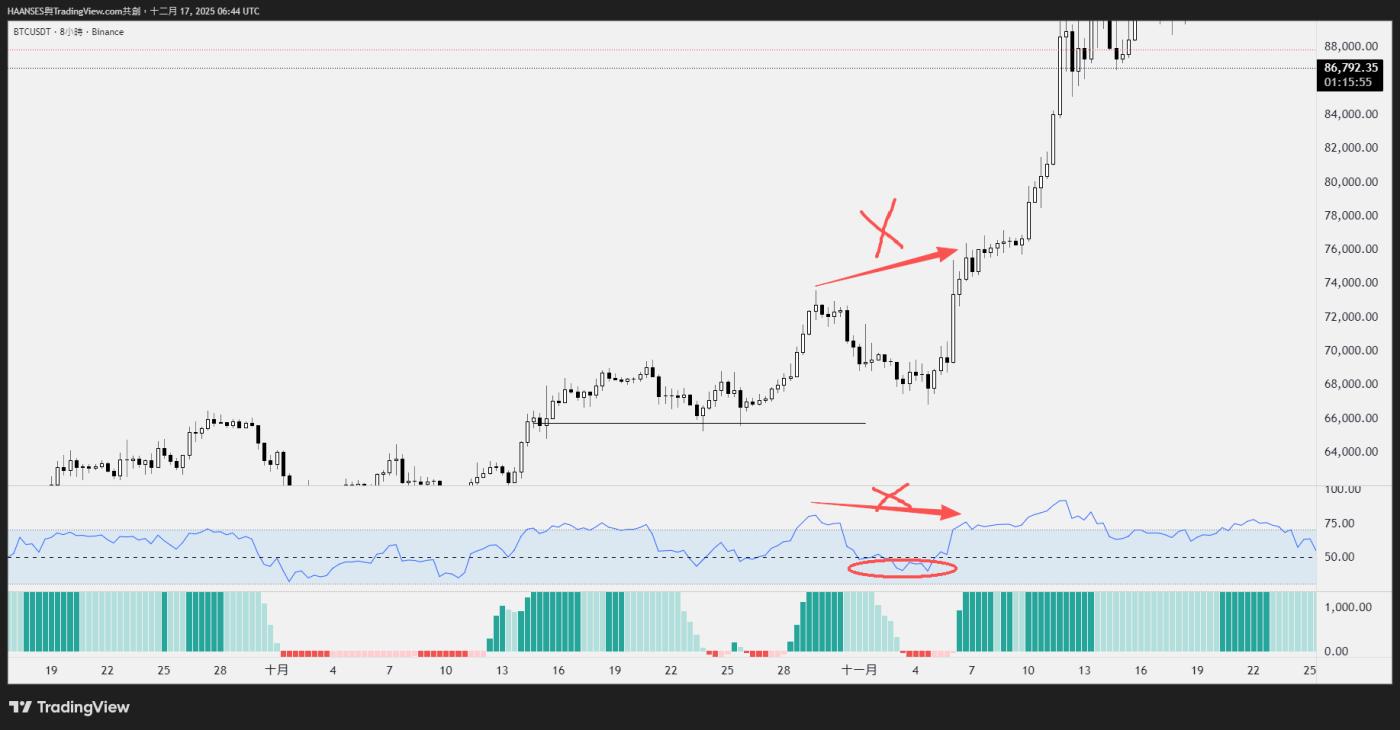
"It has already been reset below 50, so it doesn't count as a divergence."
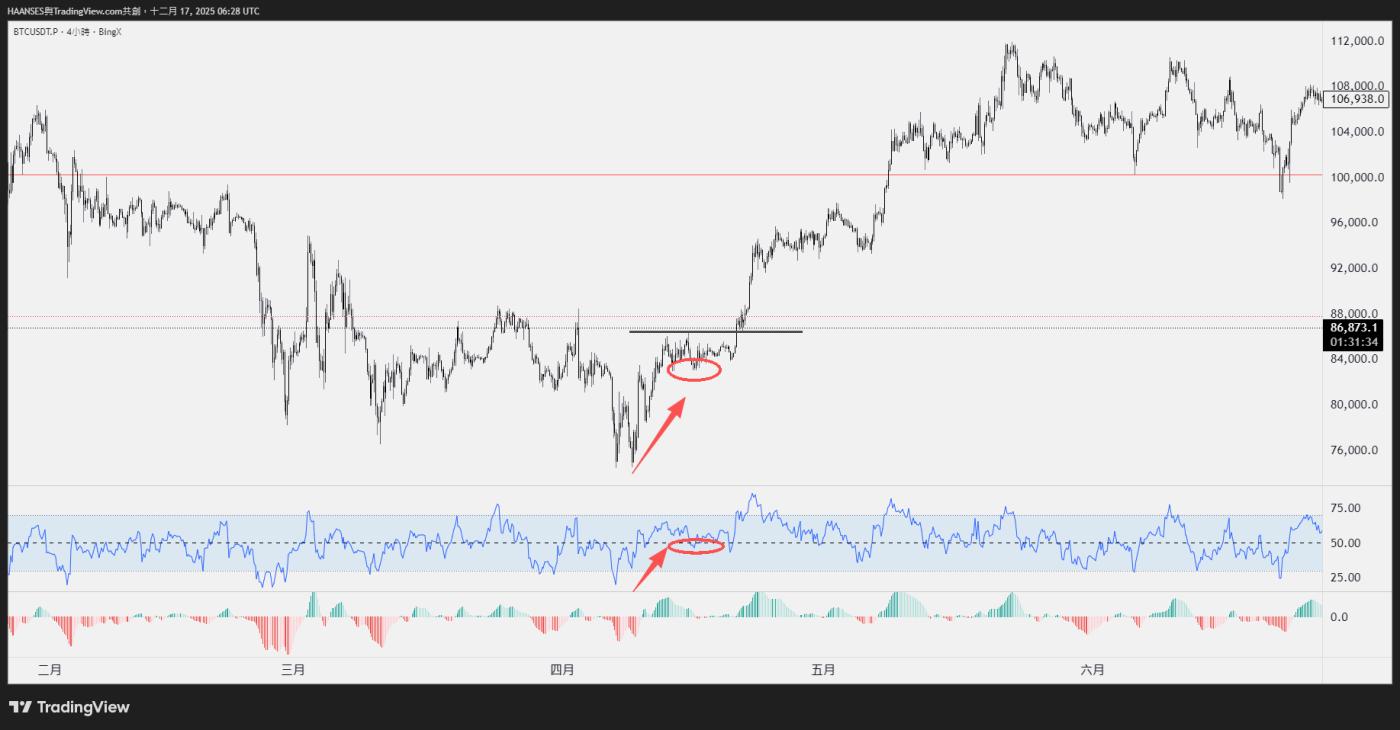
2. Use the 50-day moving average (Midpoint) for trend trading.
Besides being used for divergence, the 50 midline area of the RSI is a key point for judging mid-trend adjustments (cooling zones) and joining trends.
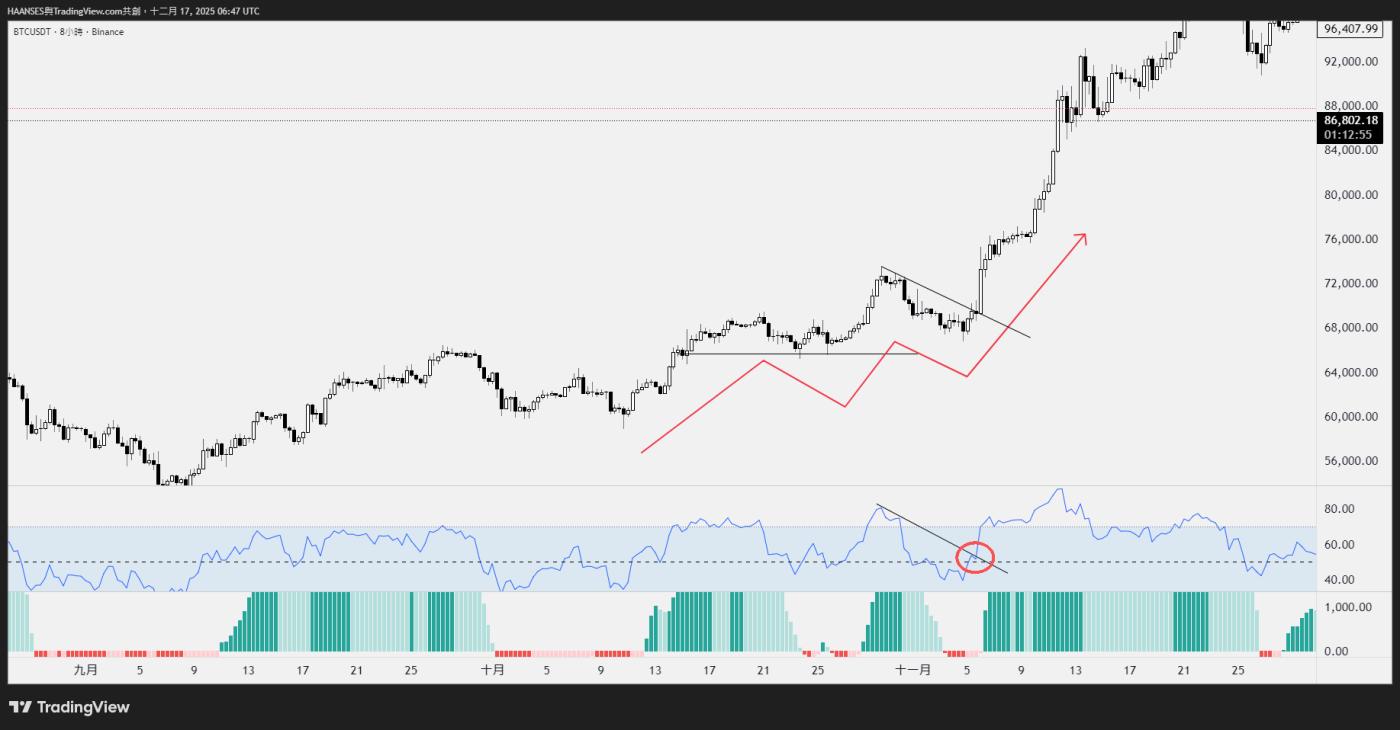
The upward trend continues; a pullback to the RSI50 level is followed by a breakout of the PA level.
The significance of the 50-period moving average: When the price approaches or hovers around the 50-period RSI, it usually indicates two situations:
1. After a strong upward or downward trend, prices cool down, and 50 points becomes a natural resting point.
2. Prices are consolidating.
Finding entry points: In a strong trend, the 50 midline area is a good observation point to capture temporary pauses or pullbacks in the trend, thus looking for entry opportunities to rejoin the trend.
Avoid consolidation: If an asset fluctuates around the 50 midline, it indicates market indecision, and trading should be avoided in this situation.
Preferred time frame: My personal favorite time frame for observing the cooldown period is the 4-hour chart.
Trend strength: The 50 midline is very important for measuring the strength of a trend. Whether the price can break through and maintain above or below the 50 midline is a powerful indicator of whether the trend will continue.
In summary, RSI should not be considered a beginner's indicator; it is a tool whose effective application conditions need to be understood. This applies whether it's used for divergence trading.
Whether used as a secondary confirmation tool for trend-following trading, RSI can provide additional evidence for trading decisions, confirming whether momentum supports price action.