

Ethereum has risen by over 1% in the last 24 hours. While still slower than the overall cryptocurrency market, Ethereum's monthly losses have narrowed to around 5.7%, compared to Bitcoin's more than 10% drop this month. Despite the slow pace of recovery, Ethereum's price is gradually showing positive signs again.
A well-known bullish pattern is gradually forming, whales are increasing their holdings, and the Ethereum price chart is approaching a critical zone that will determine whether this breakout will actually occur.
A familiar pattern is emerging as sharks get involved.
Ethereum is forming a cup and handle pattern – a pattern that often precedes a trend reversal. The "cup" is the curved Dip area that formed in mid-November, while the "handle" is the most recent correction. The upper edge of the pattern slopes slightly downward, but this does not invalidate the pattern.
A neckline with a steep slope is still XEM valid as long as the price conforms to the cup structure and there is a return to test the upper edge.
Want to Also Read analysis on Token like this? Sign up for the daily cryptocurrency newsletter from Editor Harsh Notariya here .
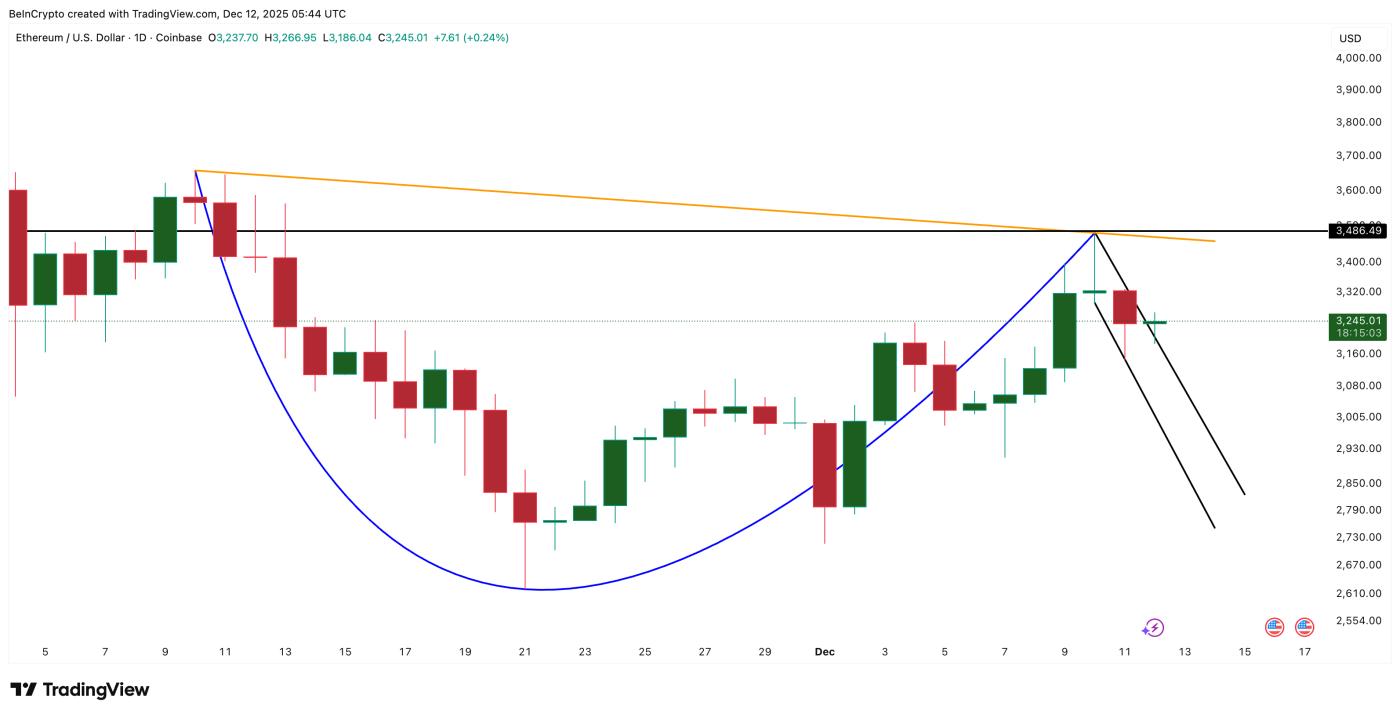 Ethereum price breakout structure: TradingView
As soon as Ethereum showed signs of breaking out of the handle, whales intensified their accumulation. Between December 11th and 12th, 2023, the amount of ETH held by whales increased from 100.41 million ETH to 100.50 million ETH.
This means the whale promptly added 90,000 ETH, estimated to be worth approximately $293 million at the current price.
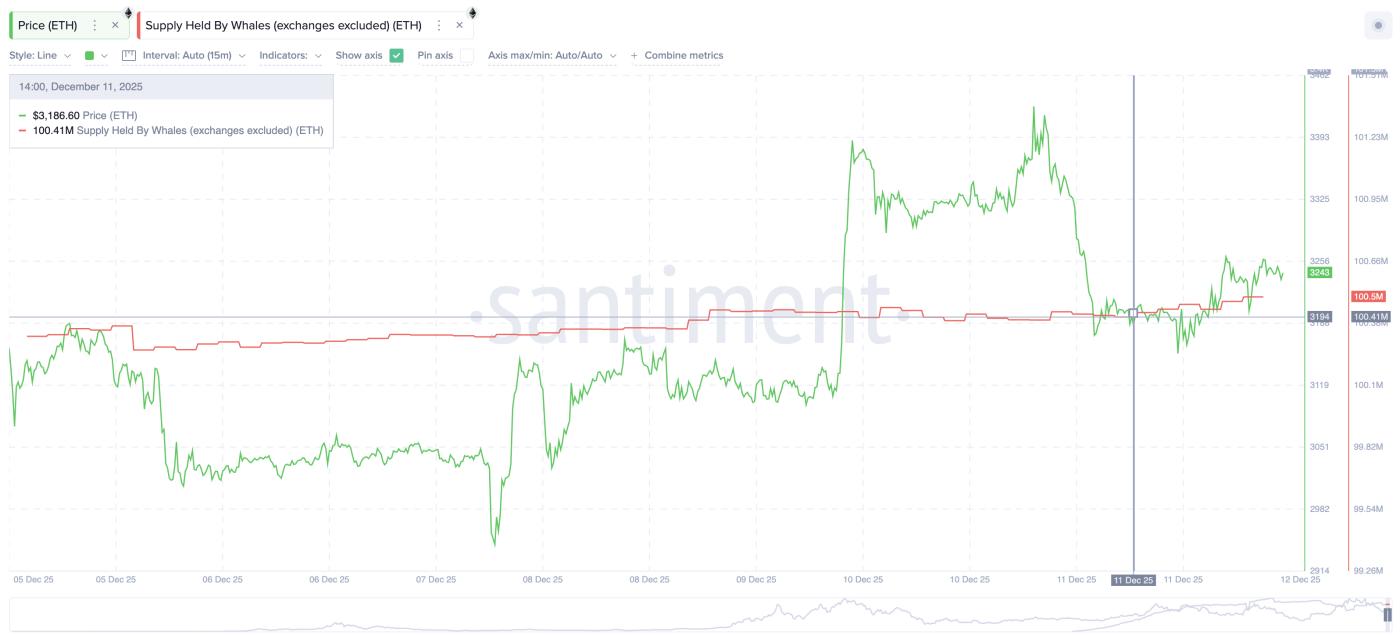 Whales start buying: Santiment
The strong buying by whales while Ethereum is attempting to break out of the pattern suggests that large investors expect the price to continue rising. While this move Unconfirmed the uptrend, it further strengthens the ongoing pattern.
To confirm a clear breakout, Ethereum needs to close the daily candle above $3,486, which is the neckline of the pattern. Currently, Ethereum is still about 7% away from this level.
Ethereum price levels confirm breakout momentum.
If Ethereum breaks above $3,486, the cup and handle pattern will be confirmed and a new price target will be triggered.
Based on the depth of the cup, the price target for Ethereum would be near $4,779, representing a gain of approximately 37% from the neckline. However, before that, Ethereum will encounter temporary resistance levels at $3,712 and $4,249.
These price zones typically slow down the upward momentum, thus Vai as "transit points" before Ethereum reaches its higher target.
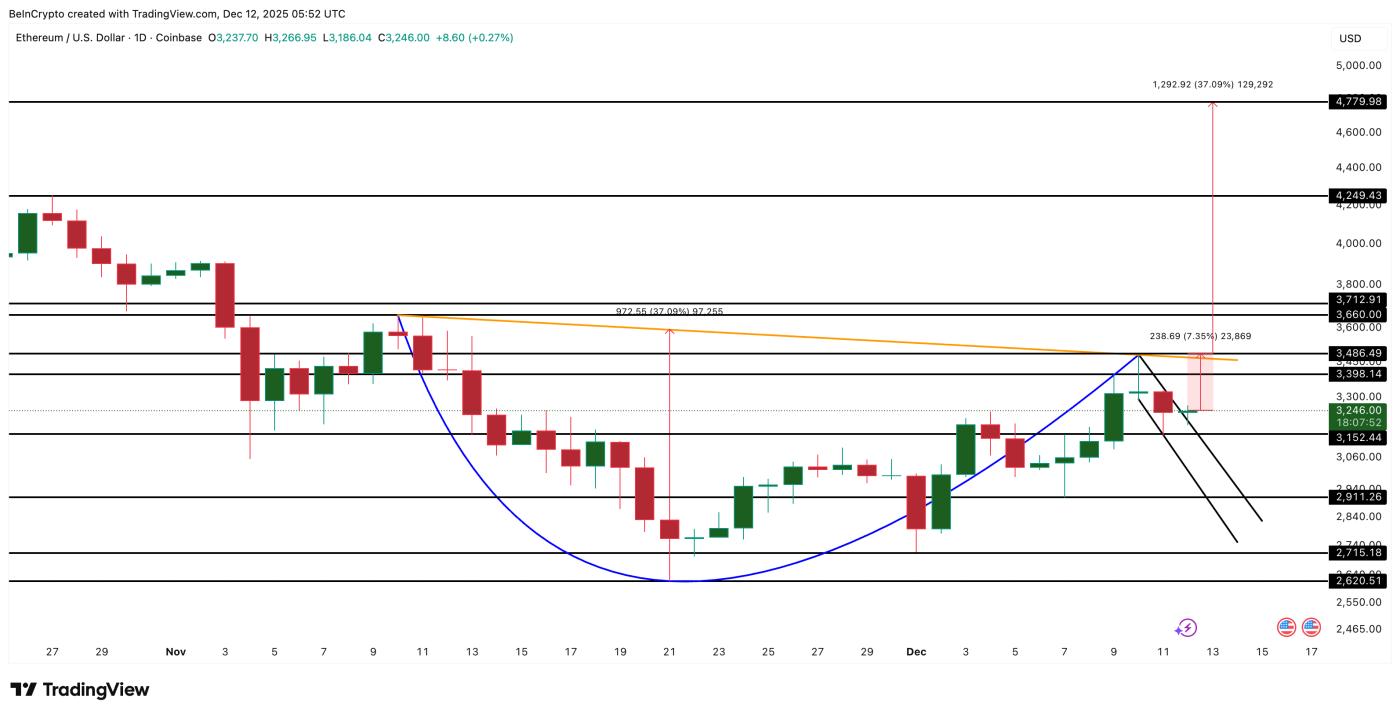 Ethereum Price Analysis: TradingView
Conversely:
- The first sign of weakness will appear if Ethereum closes the daily candle below $3,152, because then the handle structure will be broken.
- The bullish scenario is invalidated if Ethereum falls below $2,620 – the lowest support level that has ever marked the Dip of the cup.
Currently, the trend remains slightly bullish, but caution is advised. The cup and handle pattern is still valid, whales continue to buy, and Ethereum only needs one more strong upward move to break through the breakout zone. Confirmation requires another 7% increase, but overall, the scenario is now much stronger than in previous weeks.


