Bitcoin (BTC) has been flat throughout October, gaining just 1.5% for the month. However, this past week, Bitcoin's price has increased by nearly 5%, bringing attention back to the possibility of a bullish reversal.
Bitcoin briefly topped $113,200 earlier this week before rejecting around $115,000 — a zone that now Vai as a boundary between hesitation and renewed strength. The rejection may have seemed abrupt, but data suggests it was expected. And if a key level is breached, a recovery could quickly follow.
Why the breakout failed
The first signal comes from on-chain behavior, not the chart. CryptoQuant's Spent Output Value Bands indicator — which tracks the amount of Bitcoin transferred by each group of holders to exchanges — shows a sharp increase in selling pressure between October 25, 2025, and October 28, 2025.
The 100–1,000 BTC group (whales) increased their transfer to the exchange from 1,046 BTC to 7,191 BTC, while the 1,000–10,000 BTC group (whales) added about 3,250 BTC in the same period.
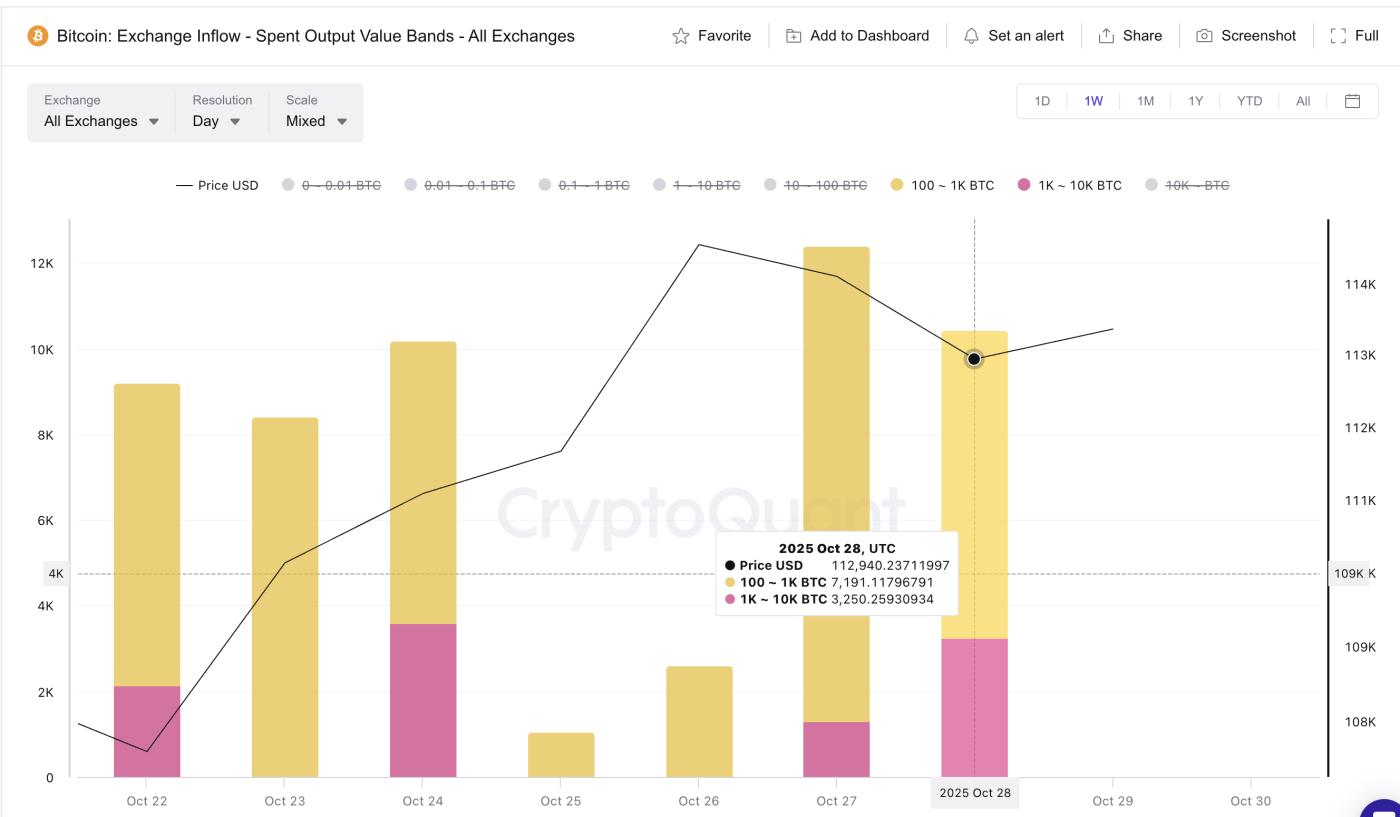 Bitcoin Whale Dump : CryptoQuant
Want Also Read Token insights like this? Subscribe to editor Harsh Notariya's daily Crypto newsletter here .
Such flows typically signify profit-taking or short-term hedging. At the same time, these moves pumped supply onto exchanges just as Bitcoin was testing $115,000, stalling Bitcoin ’s rally and preventing what might have been a smooth continuation.
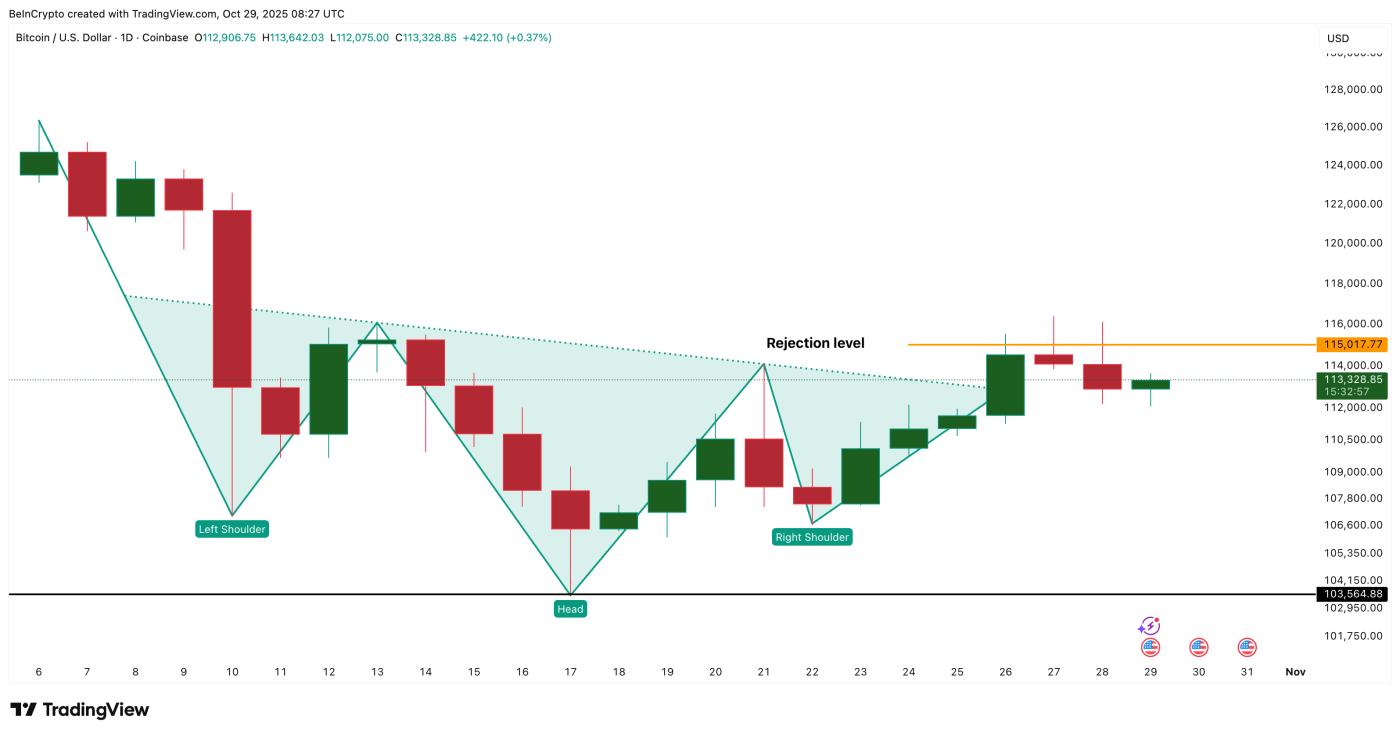 Bitcoin Price Chart: TradingView
This wave of action by large wallets explains why the breakout stalled despite strong retail investor optimism.
Why the setting is still valid
Even after that selling pressure, Bitcoin's foundation remains strong. Glassnode 's Holder Accumulation Ratio (HAR) — which tracks the percentage of wallets adding to BTC balances — remains at 60.2%.
Anything above 50% suggests net accumulation, meaning long-term holders are still quietly buying. While down slightly from the recent three-month high around 63%, the data confirms that the broader buying trend has not been broken.
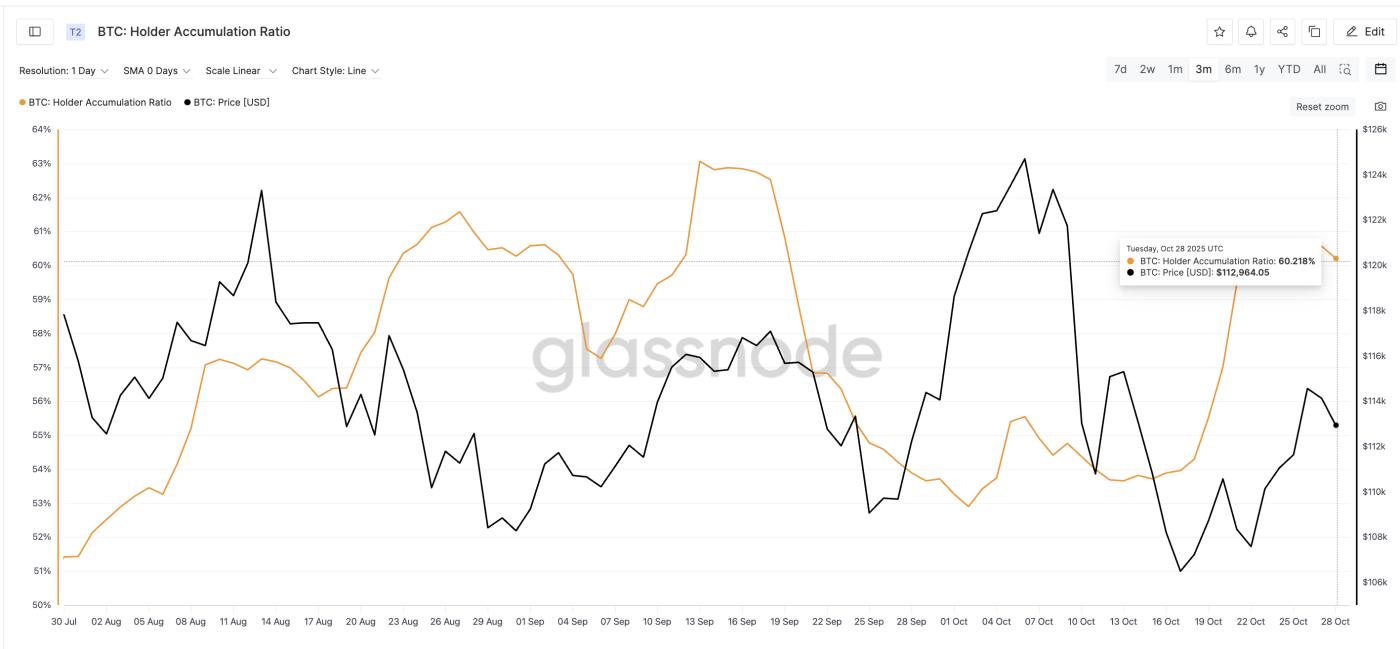 Bitcoin Accumulation Continues: Glassnode
This behavior is notable because it offsets short-term selling pressure from whales.
As long-term holders absorb the influx of coins, the market avoids deep corrections and maintains a stable structure. This keeps the door open for a new breakout if momentum returns.
Bitcoin Price Structure and Why a Recovery Is Expected
Bitcoin's current setup remains consistent with a clear technical structure — an inverse Vai and Vai pattern — which typically signals a shift from selling to buying pressure. This pattern remains valid as long as BTC holds above $106,600, which Vai as the base line of the pattern.
The Relative Strength Index (RSI) — an indicator that measures the strength of buying/selling momentum — first displayed a hidden bearish divergence between October 13, 2025, and October 26, 2025, coinciding with the breakout attempt.
During that period, Bitcoin price made lower highs, while RSI made higher highs, signaling weakening momentum despite buyers still trying to push the price up.
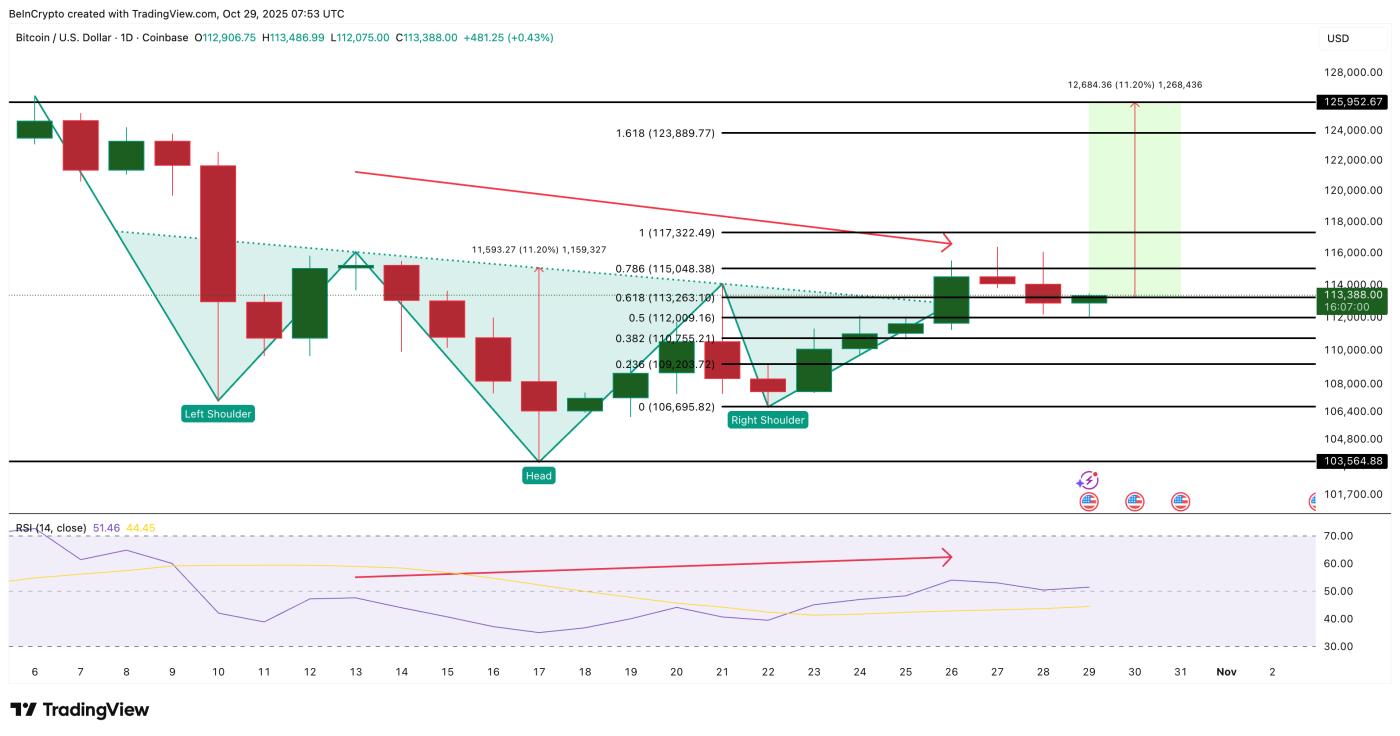 Bitcoin Price Analysis: TradingView
This mismatch is why many predicted the breakout would fail around $115,000. And that's exactly what happened — rejection and a short-term correction.
The divergence has now flattened, meaning that RSI and Bitcoin price are moving back in sync. This stabilization suggests that sellers are weakening and the structure for a rally is gathering strength. However, $115,000 remains the key test. This is the level that stopped the previous breakout and will determine whether the pattern continues to develop upwards.
If Bitcoin closes decisively above this level, a neckline breakout could open the way to $117,300 and $125,900 (near BTC's top). That would represent an 11% increase from the current level. If BTC fails and falls below $106,600, the bullish scenario would be invalidated. BTC could even be pushed to $103,500.