
Get the best data-driven crypto insights and analysis every week:
The Great De-Leveraging: Friday Flash Crash
By: Tanay Ved & The Coin Metrics Team
On Friday, October 10th crypto markets faced a tsunami of turbulence as macro headlines cascaded into the largest day of liquidations in crypto history. From pricing dislocations to leverage wipeouts and thinning liquidity, we unpack how the crash unfolded and what it reveals about the structure and stress points of today’s crypto market.
Anxiety began building on Thursday after China tightened export restrictions on rare earth elements, fueling concerns over supply chain disruptions and rising economic tensions. On Friday at around 3:00 pm (UTC), President Donald Trump criticized China’s restrictions on social media and warned of retaliatory action. Hours later, at 8:50pm UTC, an official policy announcement was put out, declaring a 100% tariff on all Chinese imports effective November 1st.
With traditional markets closed, crypto became the 24/7 barometer of global sentiment.
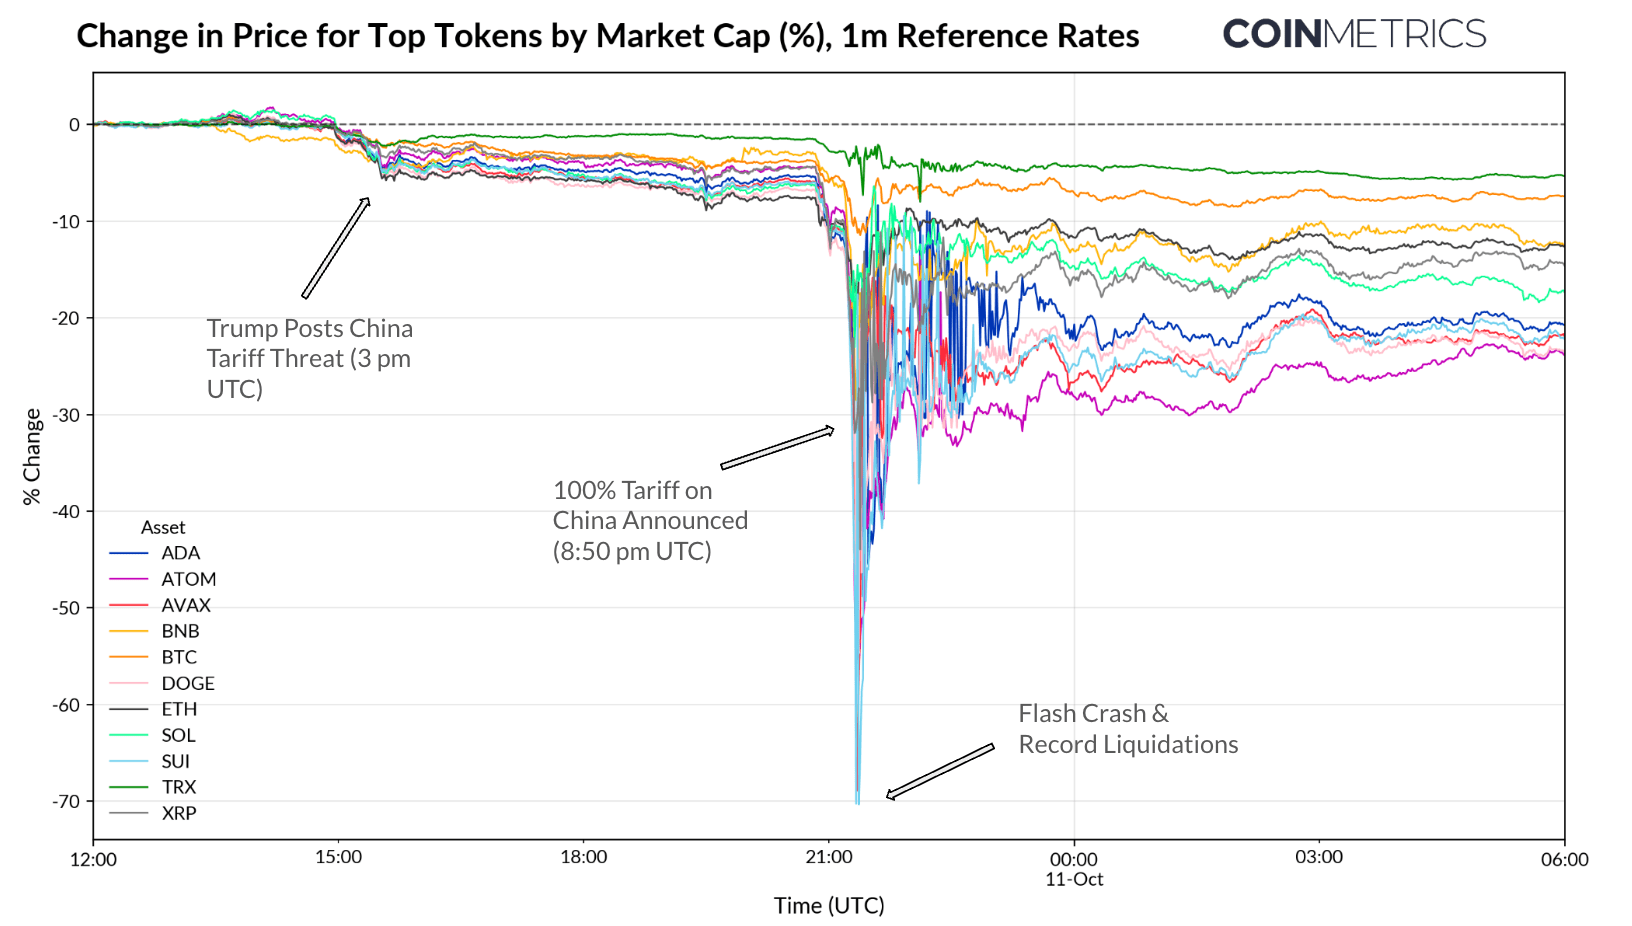
Source: Coin Metrics Reference Rates
After 9:00 pm UTC, Bitcoin (BTC) had dropped to $107K, while altcoins saw far steeper declines. Tokens like SUI, for example, fell by more than 70% within minutes in contrast to Bitcoin’s more modest move. This disparity suggests that the selloff wasn’t purely driven by broad market sentiment, but likely amplified by differences in liquidity, leverage, and market structure across assets and venues.
Liquidation Spiral & Leverage Wipeout
In the weeks leading up to the crash, there was a massive buildup in open interest in perpetual futures markets. This run-up in leverage, matched with thin liquidity and tariff headlines created an optimal backdrop for the turbulence that followed.
When prices began to slip, pressure rapidly mounted. As highly leveraged long positions fell underwater, exchanges automatically liquidated them to prevent further losses. Within an hour, over $3.5B in futures positions were wiped out across centralized exchanges (CEXs), driving prices even lower and setting off a feedback loop of liquidations as auto-deleveraging (ADL) mechanisms kicked in to forcibly close out positions under stress.
Across the day, total liquidations reached over $5B, roughly 17 times larger than the typical 3-month average of $300M, making it one of the most extreme forced unwind events in recent memory.
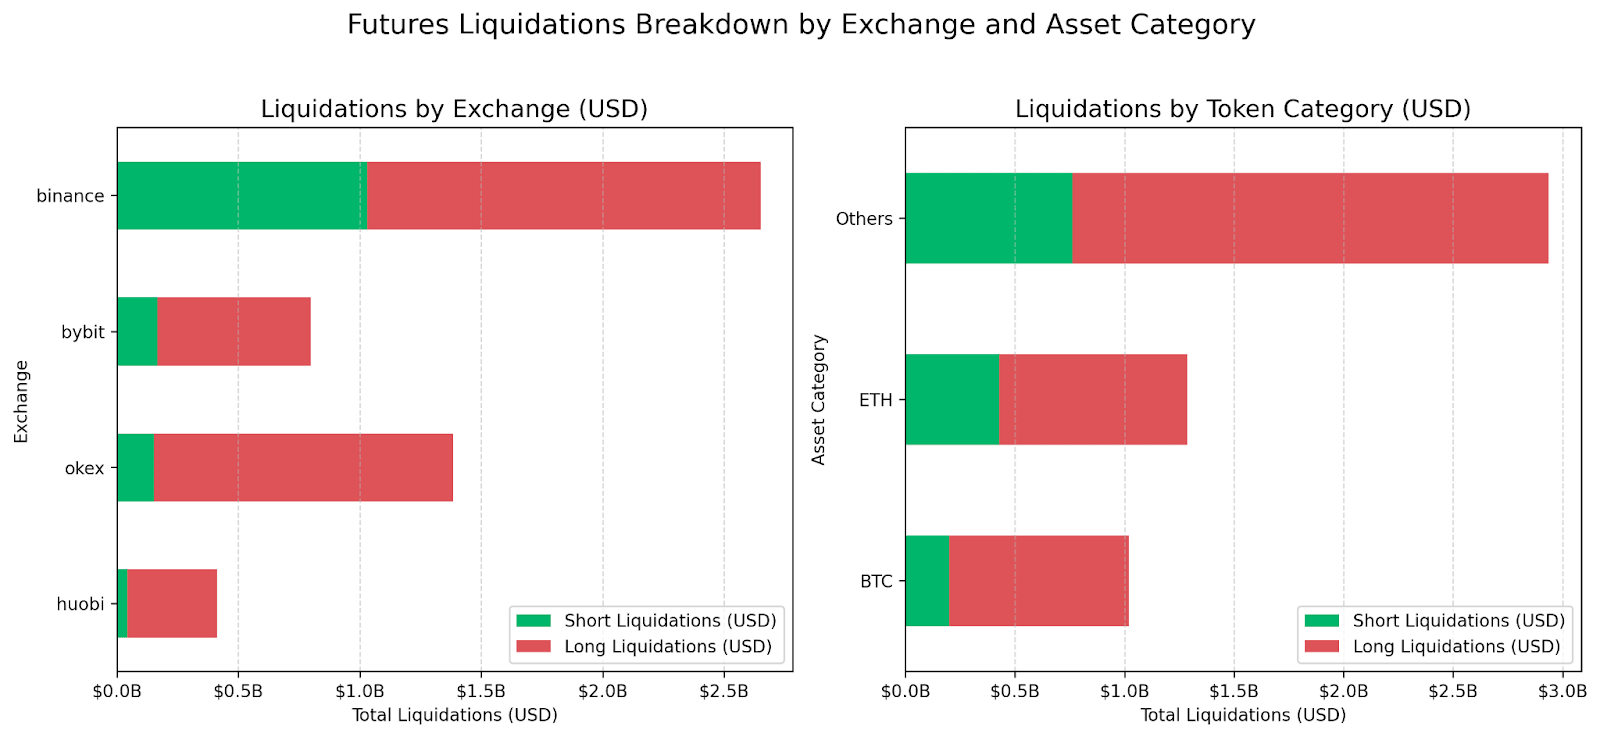
Source: Coin Metrics Market Data Pro
While the impact was felt across the board, the severity of the liquidations varied by venue and asset type. Altcoins accounted for the bulk of the wipeout, with open interest across non-BTC assets falling by more than 25%, compared to 15% for BTC and 24% for ETH between October 8th and October 10th. By venue, Binance, OKX and Bybit saw the largest liquidations, suggesting a higher share of leveraged activity with long liquidations dominating activity.
Vanishing Orderbook Liquidity Amplified Volatility
The violent liquidation cascade was further exacerbated by shallow market liquidity. This is observable in Binance’s BTC/USDT order book depth data. The chart below shows BTC/USDT depth within ±2% of the mid-price across crash week (Oct 6–13) versus the year-to-date (YTD) average.
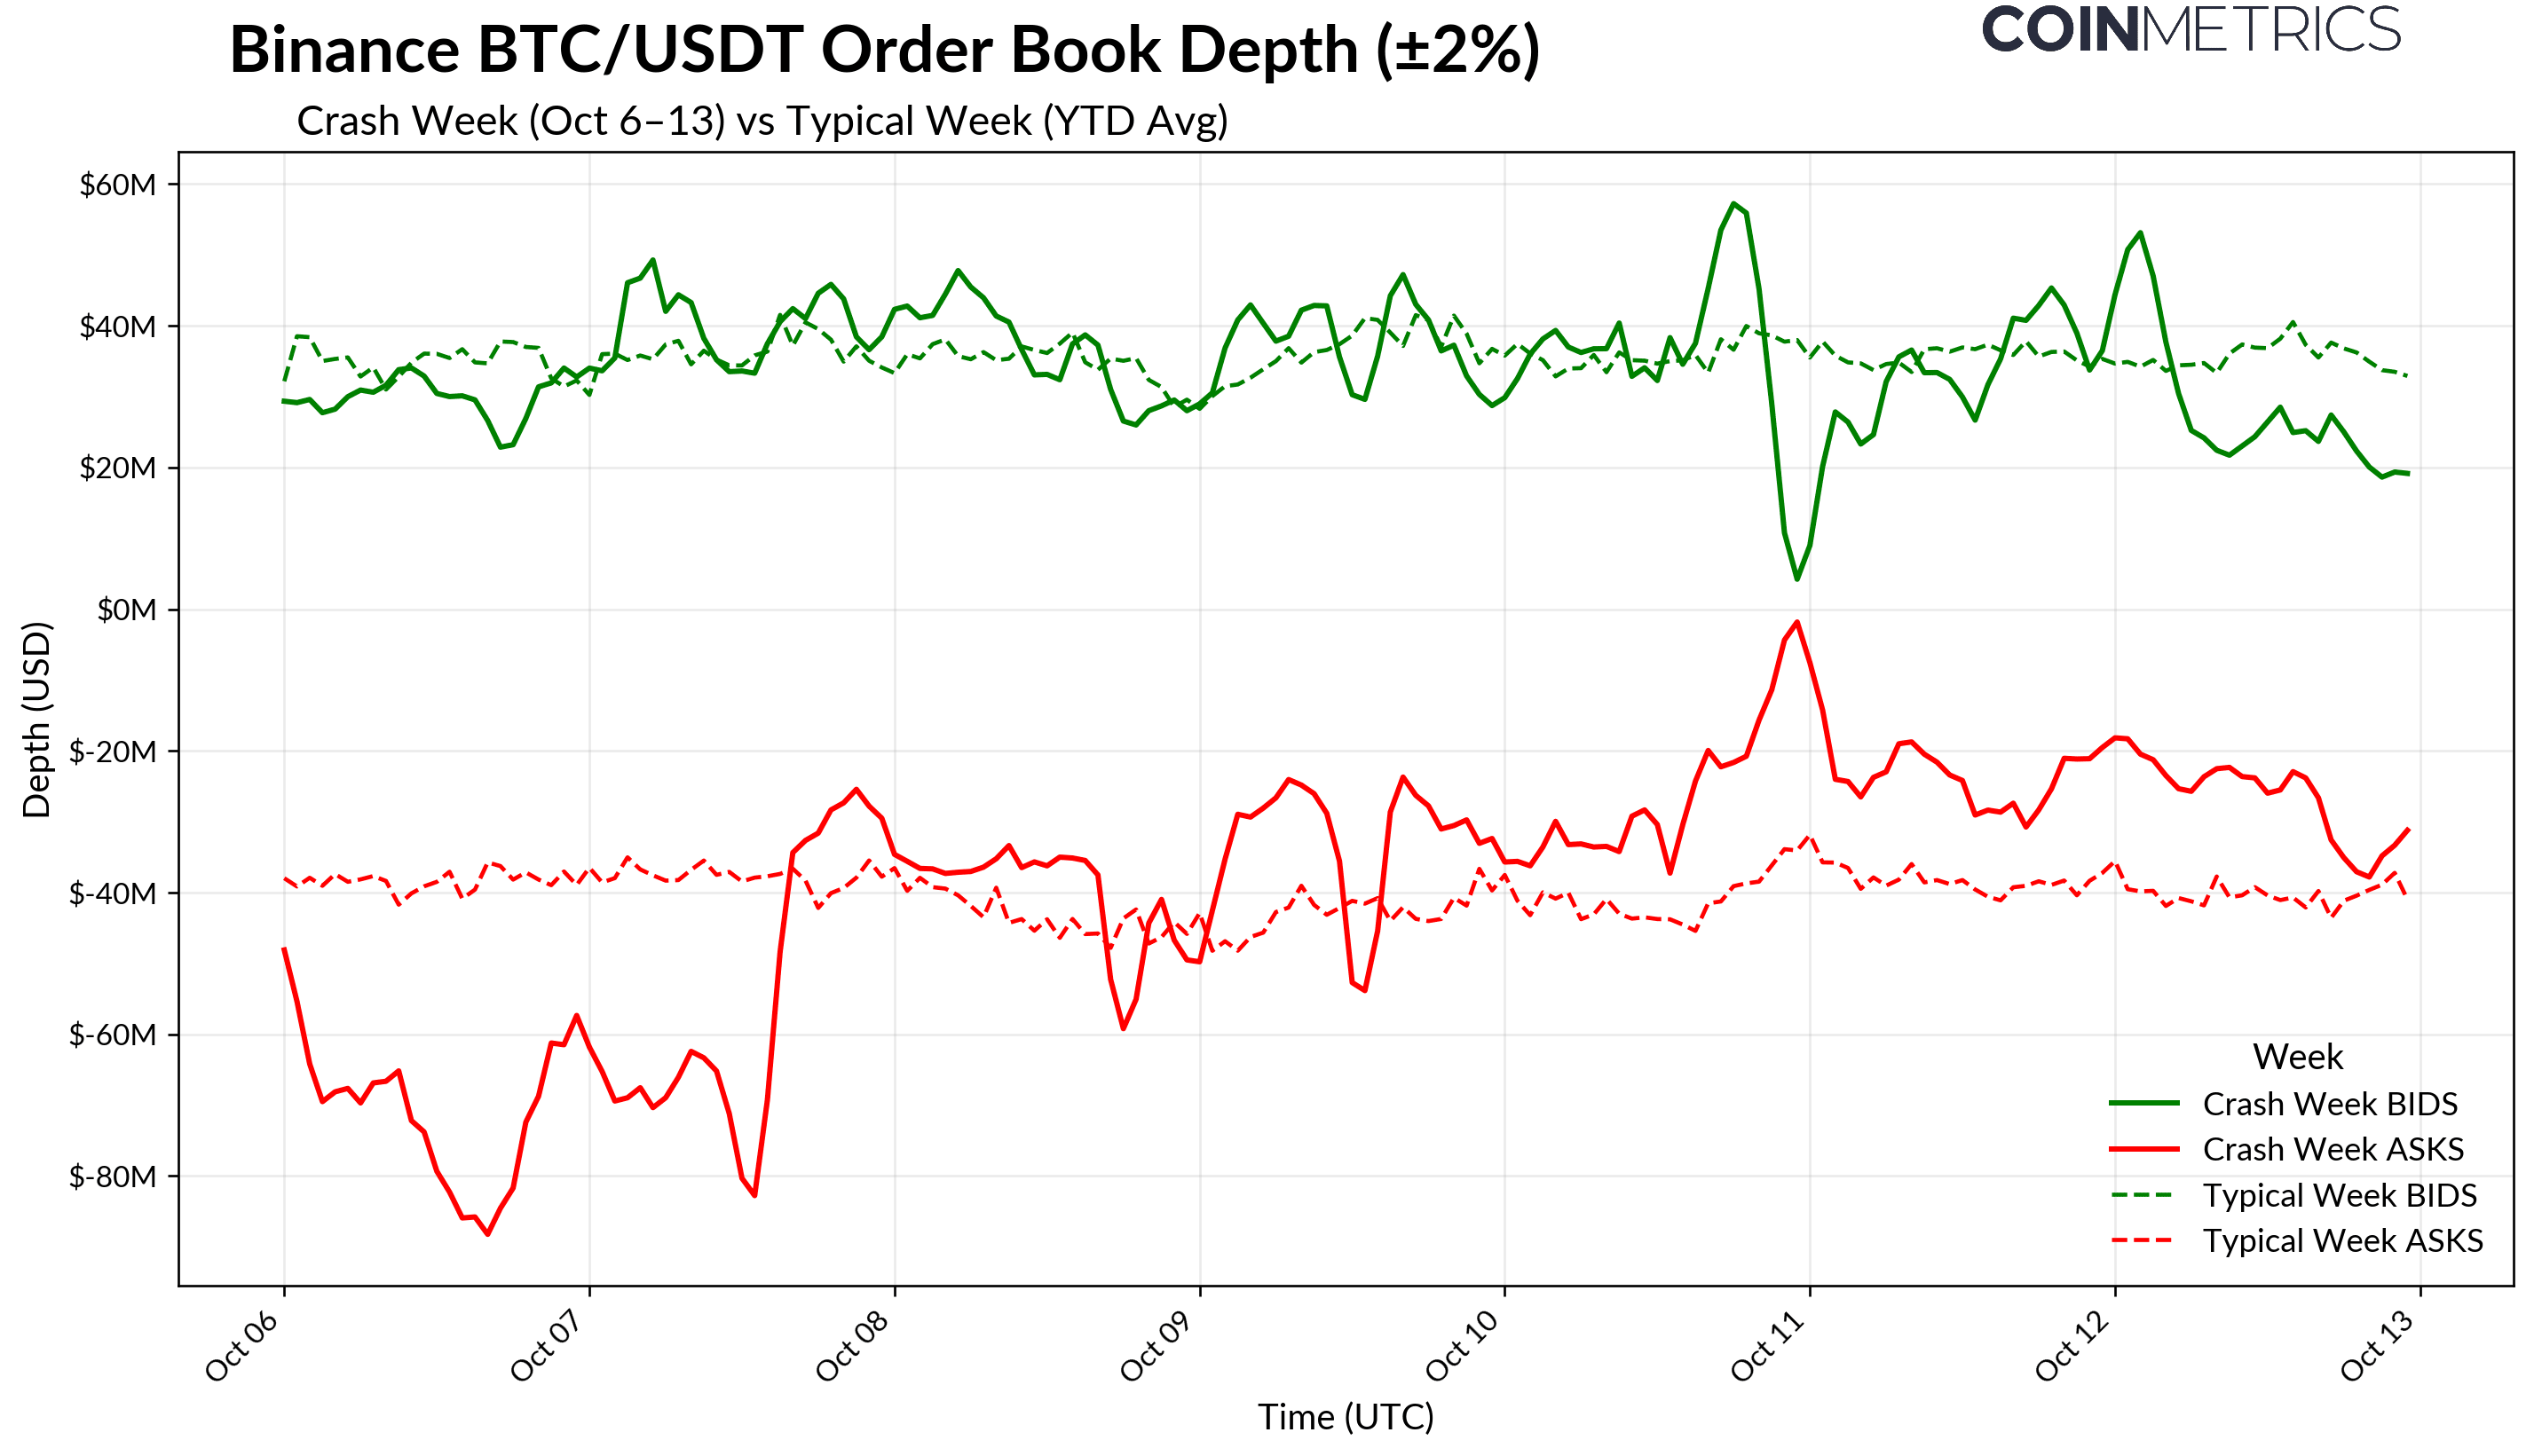
Source: Coin Metrics Market Data Pro
In typical conditions (dashed lines), BTC order book depth is relatively stable, with buy- and sell-side liquidity hovering around $40M. During the crash (solid lines), liquidity dramatically thinned out on both sides of the book. With less liquidity in place, even moderate sell pressure caused outsized price swings, accelerating the decline. For Bitcoin, this dynamic led to a swift but contained liquidity squeeze. For altcoins, where order books are already thinner, depth evaporated almost entirely, leading to exaggerated moves and wider spreads.
Ethena’s USDe Dislocation
Among the more notable casualties was Ethena’s synthetic dollar, USDe. Unlike fiat-backed stablecoins like USDT or USDC, USDe maintains its peg through a delta-neutral basis trade, pairing long spot exposure with equivalent short positions in perpetual futures contracts. It is primarily used as margin collateral on centralized exchanges like Binance (where it was incentivized by a high incentive yield program), while its staked version, sUSDe, is widely used as collateral on lending protocols. Because of this unique risk profile and usage across both off-chain and on-chain venues, USDe’s stability is closely tied to overall leverage conditions.
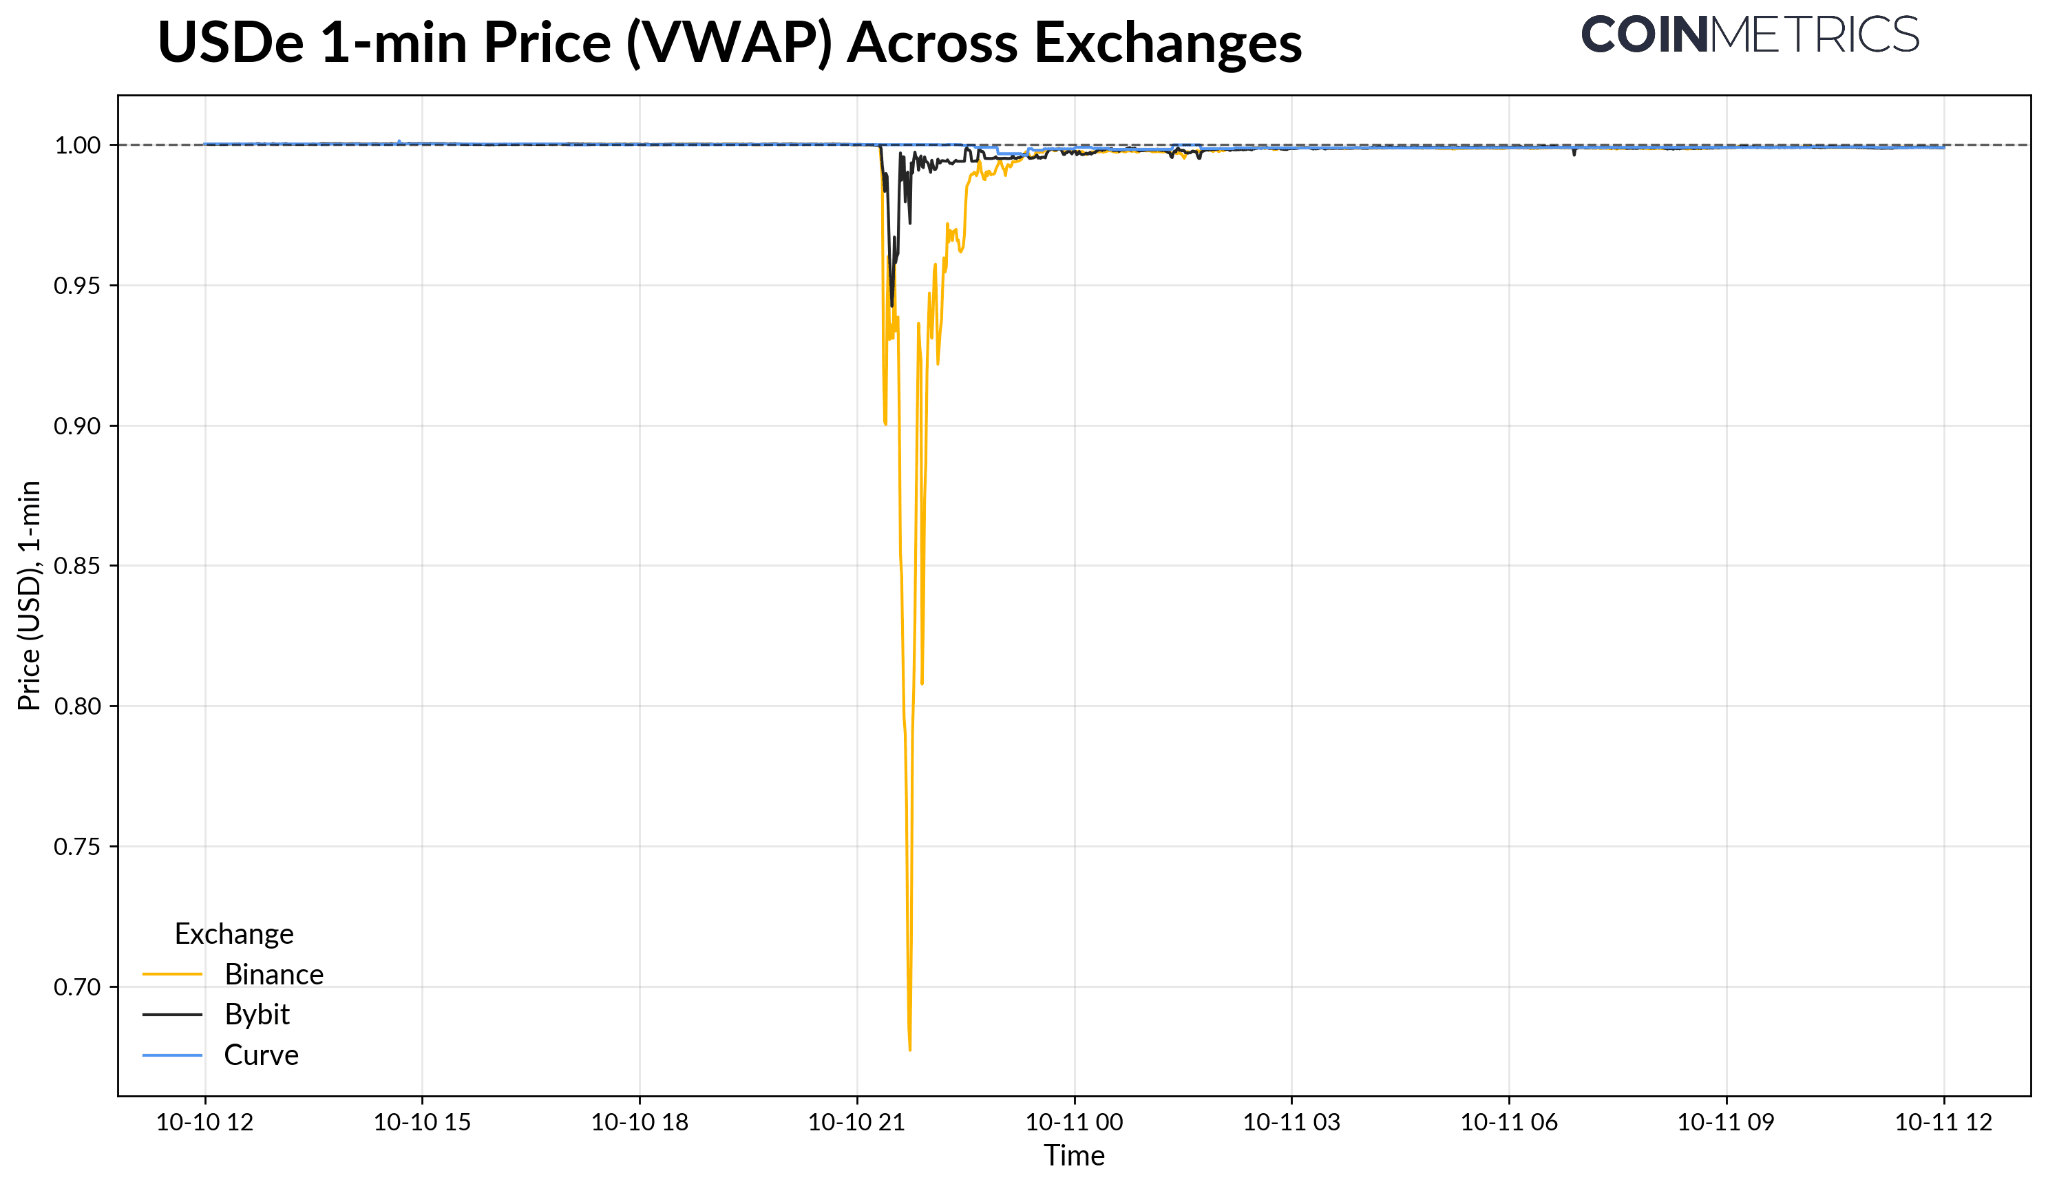
During the crash, USDe briefly fell to as low as $0.67, while fiat-backed stablecoins like USDT and USDC traded slightly above par.
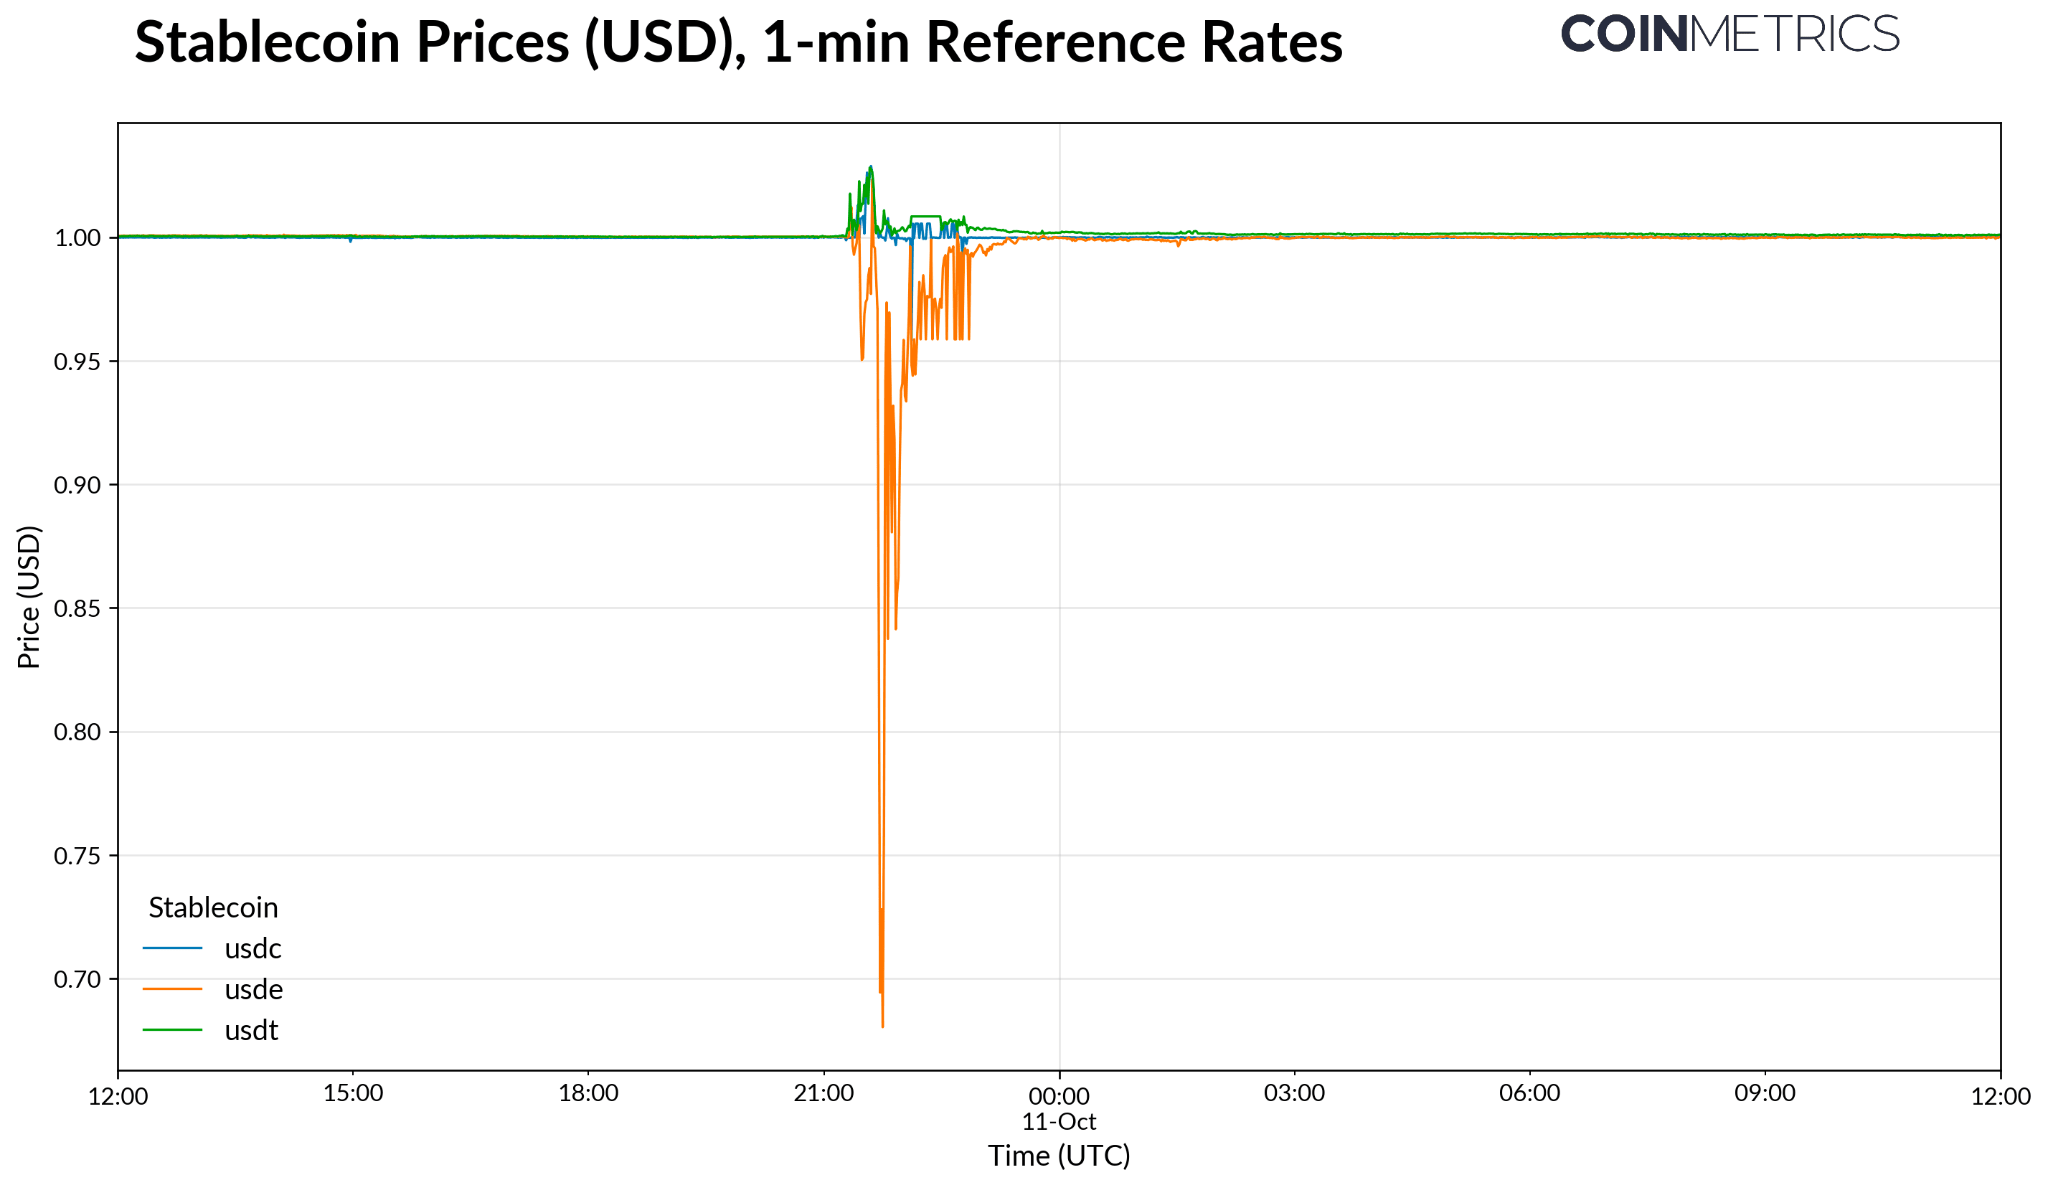
Source: Coin Metrics Reference Rates
The steepest dislocation occurred on Binance, where leverage exposure and trading activity in USDe were likely the highest. By contrast, USDe held closer to parity on Bybit (around $0.94) and decentralized exchanges like Curve ($0.99), suggesting deeper liquidity or lower leverage exposure on those venues. While the price shortly recovered, the episode highlighted the importance of an aggregated view into secondary market liquidity and the impact of fragmented pricing across venues.
Source: Coin Metrics Market Data Feed
While the incident did not fundamentally threaten Ethena’s design, USDe remained overcollateralized and mint and redeem functions remained operational, it revealed the risks of venue specific oracle pricing and leverage unwinds.
Key Takeaways Going Ahead
The weekend’s episode was a reminder of how quickly fragility can surface when leverage, liquidity, and macro shocks collide. While it exposed areas of structural weakness, it did not signal any fundamental change in the market’s long-term foundations.
Leverage and Liquidity: The buildup of leverage in perpetual futures on top of shallow liquidity created the backdrop for a rapid unwind. Once prices fell, liquidations and vanishing liquidity fed into each other,
24/7 Market Reflexivity: Crypto’s around-the-clock trading allowed shocks to unfold in real time. With no circuit breakers volatility was amplified, particularly during thin weekend liquidity.
Venue Fragmentation: Differences in liquidity and pricing across exchanges deepened dislocations, reinforcing the need for better aggregation, cross-venue risk management, and reliable pricing infrastructure.
Synthetic Asset Risk: The USDe dislocation showed how stress can move across off-chain and on-chain markets, especially as synthetic and tokenized assets become more integrated.
Network Resilience: Despite record volatility, on-chain networks remained resilient. Block production, throughput, and transaction fees held steady even as blockspace demand surged.
Structural Maturity: Although many altcoins saw sharp dislocations, Bitcoin and other major assets held up relatively well, reflecting a more resilient market structure and the influence of institutional participation.
In the end, the great de-leveraging was a stress event rather than a systemic failure. While disruptive, it helped flush out excess leverage and leaves the market on a healthier footing going forward.
Coin Metrics Updates
This week’s updates from the Coin Metrics team:
Follow Coin Metrics’ State of the Market newsletter which contextualizes the week’s crypto market movements with concise commentary, rich visuals, and timely data.
As always, if you have any feedback or requests please let us know here.
Subscribe and Past Issues
Coin Metrics’ State of the Network, is an unbiased, weekly view of the crypto market informed by our own network (on-chain) and market data.
If you’d like to get State of the Network in your inbox, please subscribe here. You can see previous issues of State of the Network here.