Ethereum (ETH) price has rebounded strongly from lows near $3,430, climbing to around $4,130 at the time of writing — up about 20%. While this may seem like a strong recovery, price charts and on- chain data suggest the move may not be straightforward.
Ethereum could continue to rise, but there may be a temporary correction before the next leg up forms.
Whales Buy ETH, But Cautious Group Keeps Market Chia
Ethereum's current rally appears to be driven by large wallets rather than retail investors. Data from Santiment shows that whale wallets have increased their holdings from 100.28 million to 100.36 million ETH since October 11, 2023.
That's about 80,000 ETH, worth about $330 million at current Ethereum (ETH) prices. The slow but steady increase in whale holdings suggests quiet accumulation after the crash, suggesting confidence from long-term players.
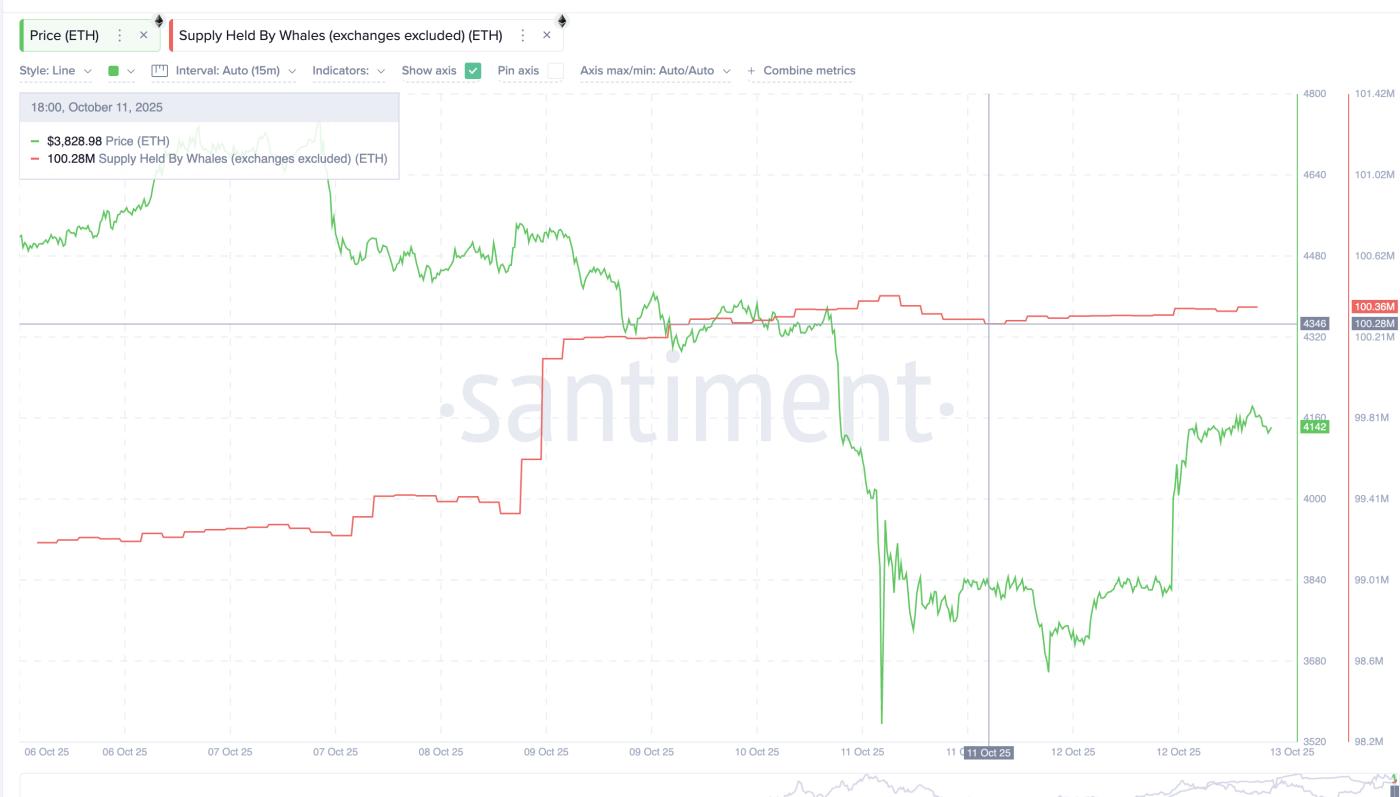 Ethereum Whales Are Slowly Adding: Santiment
However, some major groups of holders did not show the same confidence. According to Glassnode's HODL Waves, which breaks down coins by holding period, two major groups have reduced their exposure. The 1 week to 1 month group, typically short-term traders who react quickly to volatility, reduced their exposure from 8.84% to 8.37%.
Want more information on Token like this? Sign up for Editor Harsh Notariya's daily Crypto Newsletter here .
Meanwhile, the 1- to 2-year group, which are usually medium- and long-term holders that help stabilize prices during uncertain times, fell from 7.16% to 7.03% after the crash.
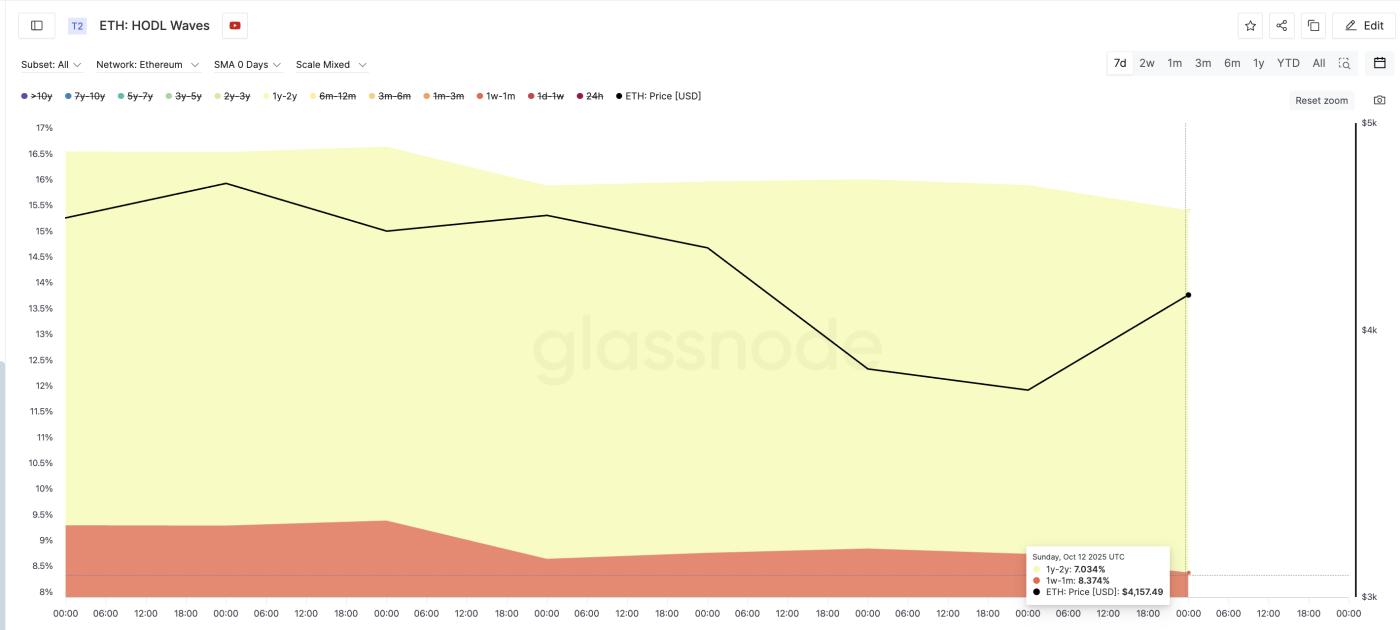 Ethereum Holders Remain Cautious: Glassnode
These are the groups that typically shape short-term momentum and sustain long-term recoveries. Their current caution explains why Ethereum’s recovery, while promising, still looks uneven. Until these traders and holders return to the market, the recovery is likely to remain largely whale-led. This will make Ethereum’s price action more volatile around resistance zones.
Cup pattern indicates Ethereum price is bullish, but further correction is likely
On the 4-hour chart, Ethereum is forming a cup pattern , which is often XEM as a bullish reversal signal. The structure shows the price curving up from around $3,640 to the $4,130–$4,390 range, with a stable shape on both sides. The long wick from the October 11, 2023 crash is excluded from the pattern as it is a quick anomaly that does not affect the broader structure.
The volume trend confirms this pattern. Large red candles appear on the left during the decline. Then, volume flattens at the Dip as the market stabilizes. And finally, green bars start to rise on the right as buying returns.
Based on this setup, Ethereum price could climb to around $4,390, completing the cup pattern and aligning both rims at the same level. Once that level is reached, an ETH price correction could occur as the handle begins to form.
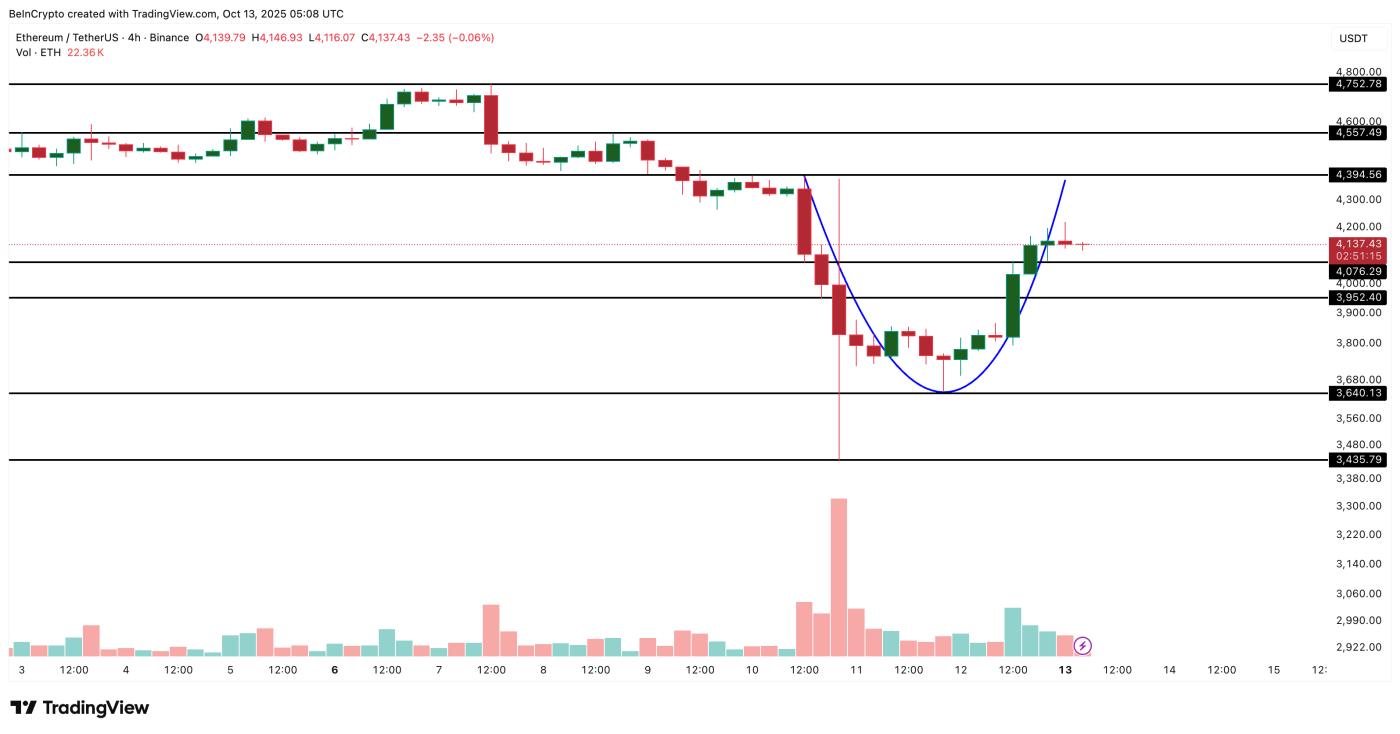 Ethereum Price Analysis: TradingView
A handle phase could take ETH down to $4,070, or possibly $3,950, without invalidating the structure. However, a close below $3,950 would break the pattern and signal weakness. If a handle forms clearly and momentum holds, a breakout above $4,390 could trigger the next leg up. That would target $4,550 and $4,750 in the short term.