Hedera (HBAR) has joined the list of altcoins recovering from the recent crypto market crash. HBAR price has increased by more than 9% in the past 24 hours, cutting part of the 15% loss on the week.
While HBAR is still down 20% over the past three months (in a bearish trend), the latest technical and on- chain indicators suggest the trend may be shifting from bearish to a recovery soon.
Whales join as selling pressure eases
HBAR 's selling pressure has been significantly reduced since October 11, 2023. Exchange inflows—which represent coins sent for sale—have dropped from $4.43 million to just $517,000, marking an 88% drop at the time of writing. This means fewer traders are Token Sale , and the short-term panic may have subsided.
Want more information on Token like this? Sign up for Editor Harsh Notariya's daily Crypto Newsletter here .
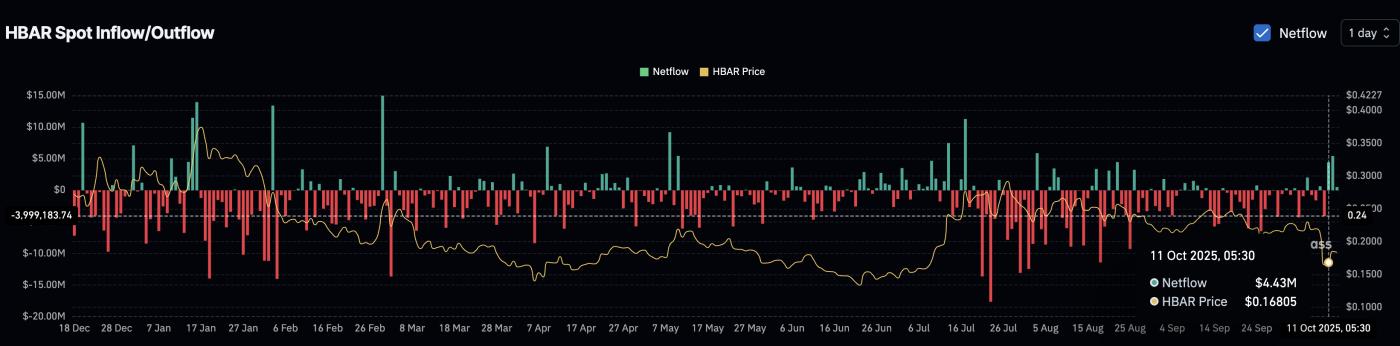 HBAR Exchange Inflows Have Declined: Coinglass
The Chaikin Money Flow (CMF) index, which tracks large wallet movements, has also turned sharply positive, currently around 0.10, confirming that whales are adding Capital rather than withdrawing. Notably, CMF started rising around October 7, 2023, and did not decline through the HBAR price crash — suggesting that large investors remained confident through the crash.
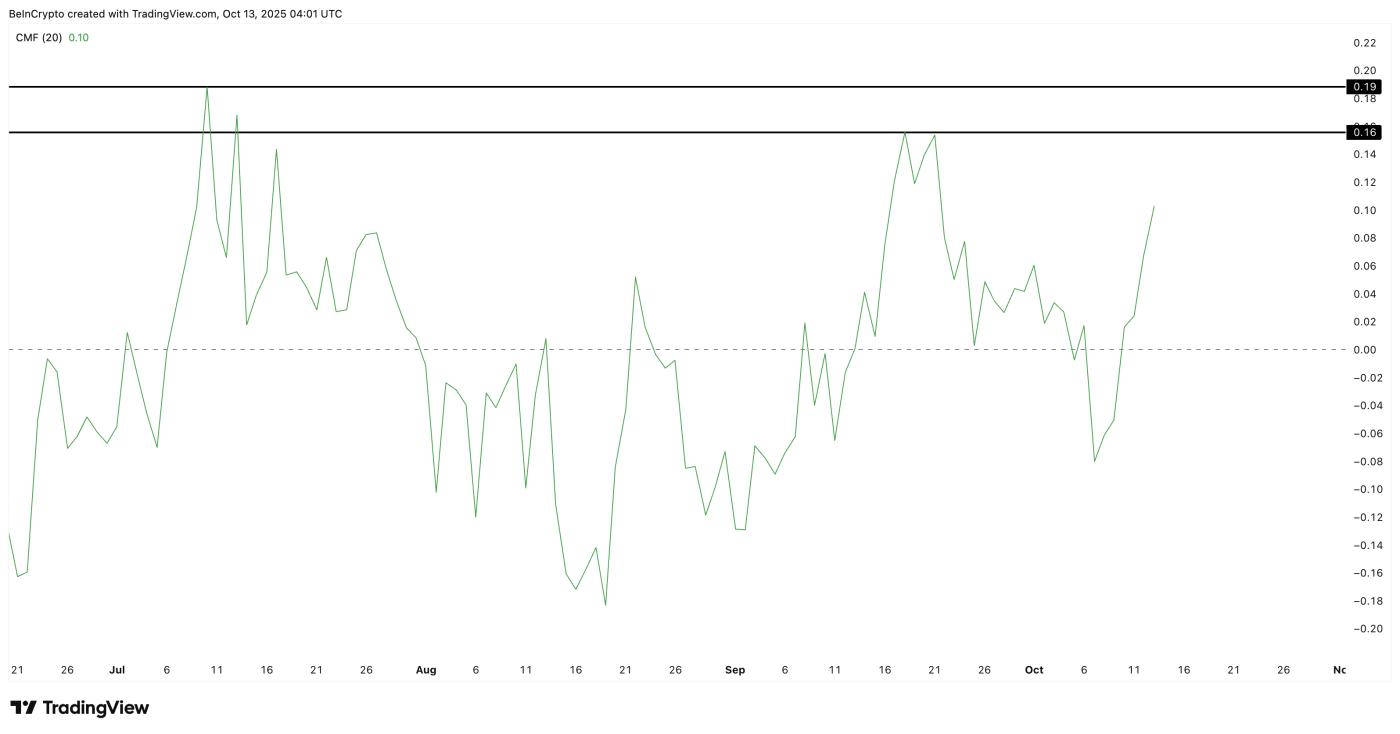 HBAR 's Big Wallets Remain Bullish: TradingView
Meanwhile, the Money Flow Index (MFI), which reflects overall trading activity and retail investor inflows, is trending down, indicating weaker retail participation and suggesting that whales may be the main force offsetting the current selling pressure.
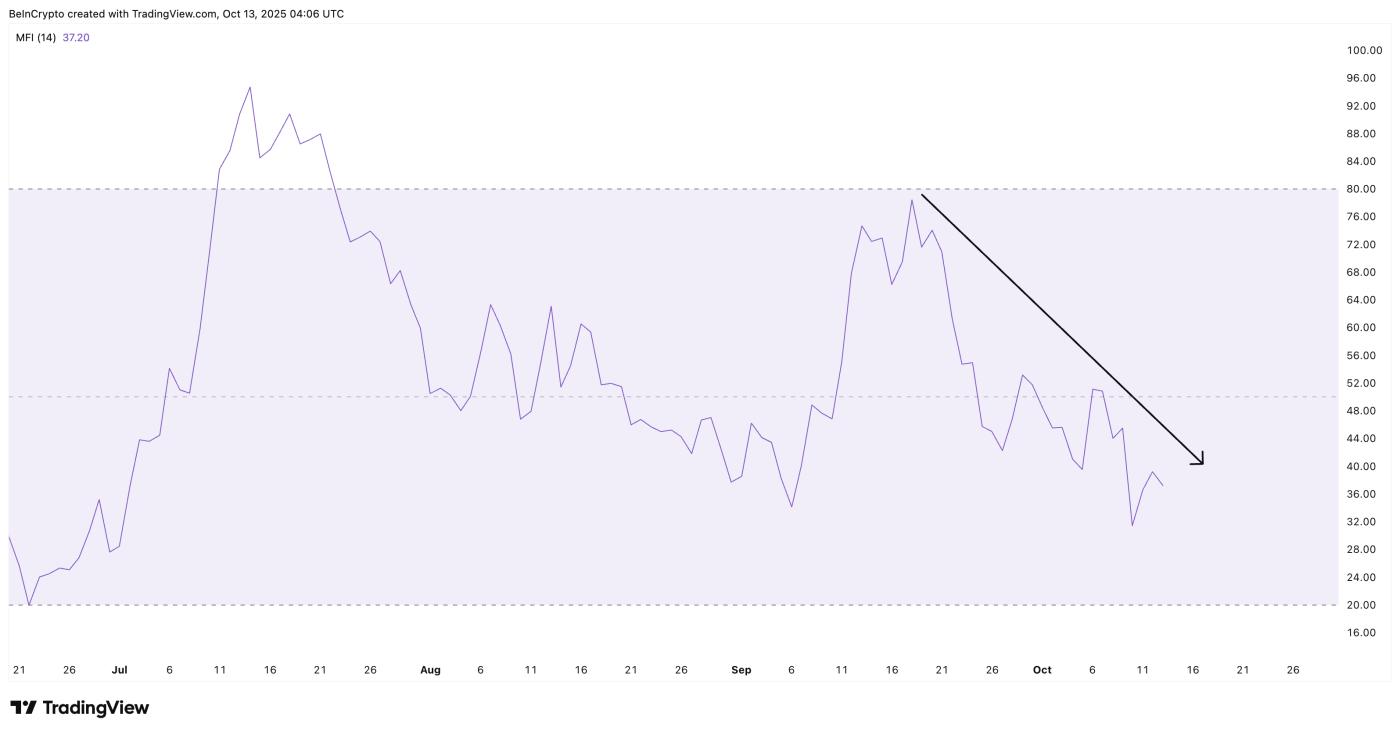 Retail investors have not participated in HBAR yet : TradingView
Coupled with the decline in exchange inflows, the rising CMF and softer MFI indicate an initial accumulation phase — possibly as large wallets prepare for a longer recovery phase. If retail investors join in the coming days, the HBAR price recovery story could become stronger.
Bullish divergence suggests a possible HBAR price reversal
The improving on chain picture is now also starting to emerge on the HBAR price chart . After weeks of selling pressure, HBAR ’s three-month 20% downtrend appears to be slowing. The price is still moving below the downtrend line, but early signs suggest that the bearish momentum may be fading — and a recovery may be forming.
The Relative Strength Index (RSI), which measures the strength of price moves, is showing bullish divergence — one of the first technical signs of a reversal. Between June 22, 2023, and October 10, 2023, the HBAR price made a lower low (due to the crash), but the RSI made a higher low. This pattern means that while the price continues to fall, the pace of selling is weakening.
The pressure that pushed HBAR prices lower is easing, possibly in line with “whales” starting to absorb supply.
If this shift continues, further confirmation would come when Hedera (HBAR) price breaks above $0.22, a resistance area that has blocked many recovery attempts in recent months. A successful move above it could allow HBAR to advance to $0.25, and if momentum holds, even $0.30 in the short term.
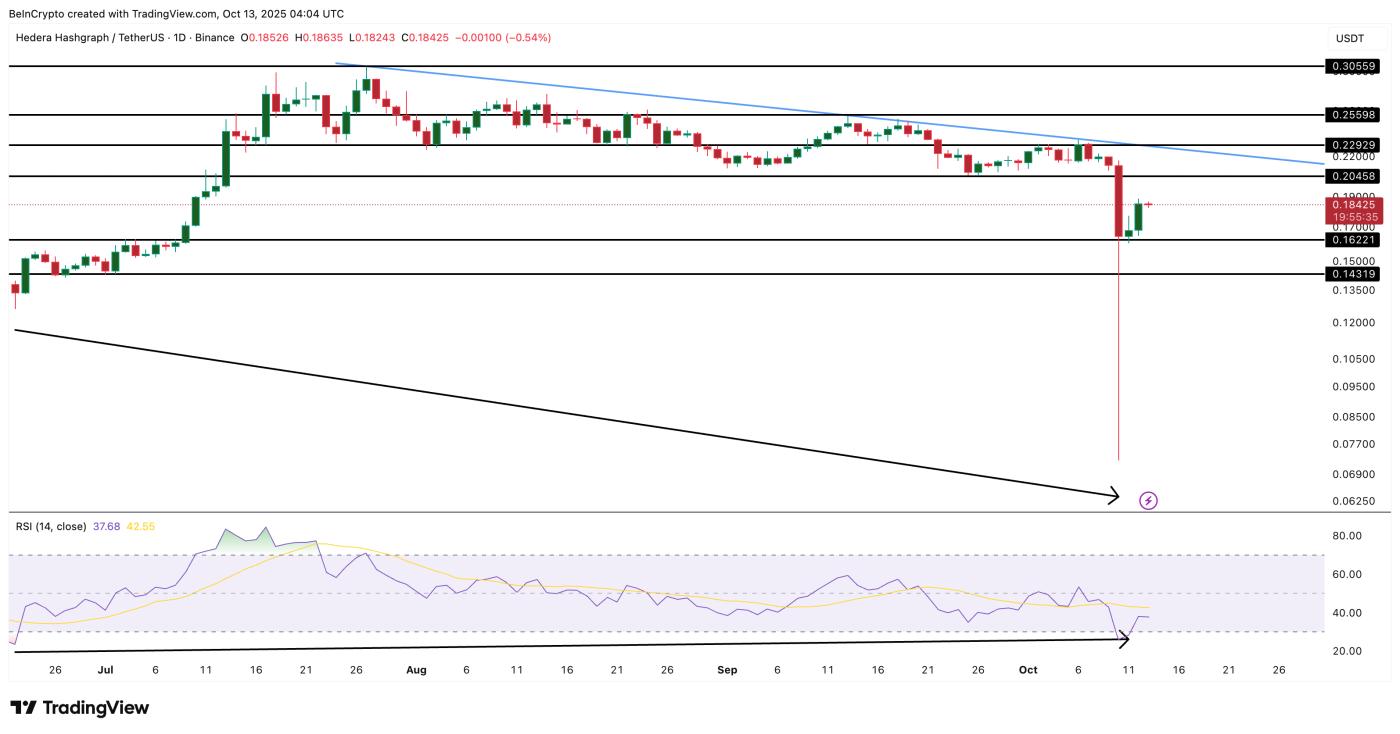 HBAR Price Analysis : TradingView
However, the structure remains fragile as long as HBAR price trades below that downtrend line. A drop below $0.16 could invalidate the recovery setup, exposing the next major support at $0.14 where buyers need to return to prevent deeper losses.