Author: kkk
Original Title: Reviewing Historical Cycles: Will the Market Definitely Rise After September Rate Cut?
A rate cut in September this year seems to be a high-probability event, and the biggest question now is: Will the market rise after the rate cut?
From historical experience, the answer is likely yes, but not an immediate rise right after the cut.
In market intuition, "rate cut" almost equates to a signal of liquidity release and asset price appreciation. However, if we extend the timeline to the past thirty-plus years, the Federal Reserve's rate cuts are far from simple. Sometimes they are preventive measures to forestall potential risks, and sometimes they are emergency relief measures during a crisis.
From 1990 to date, the Federal Reserve has experienced five major rate cut cycles, each with different economic backgrounds and policy motivations, and the stock market's reactions have presented entirely different appearances. To understand the relationship between rate cuts and the market, one cannot simply view it as a "bull market button" but must analyze it specifically by combining the macroeconomic environment and investor sentiment at the time.
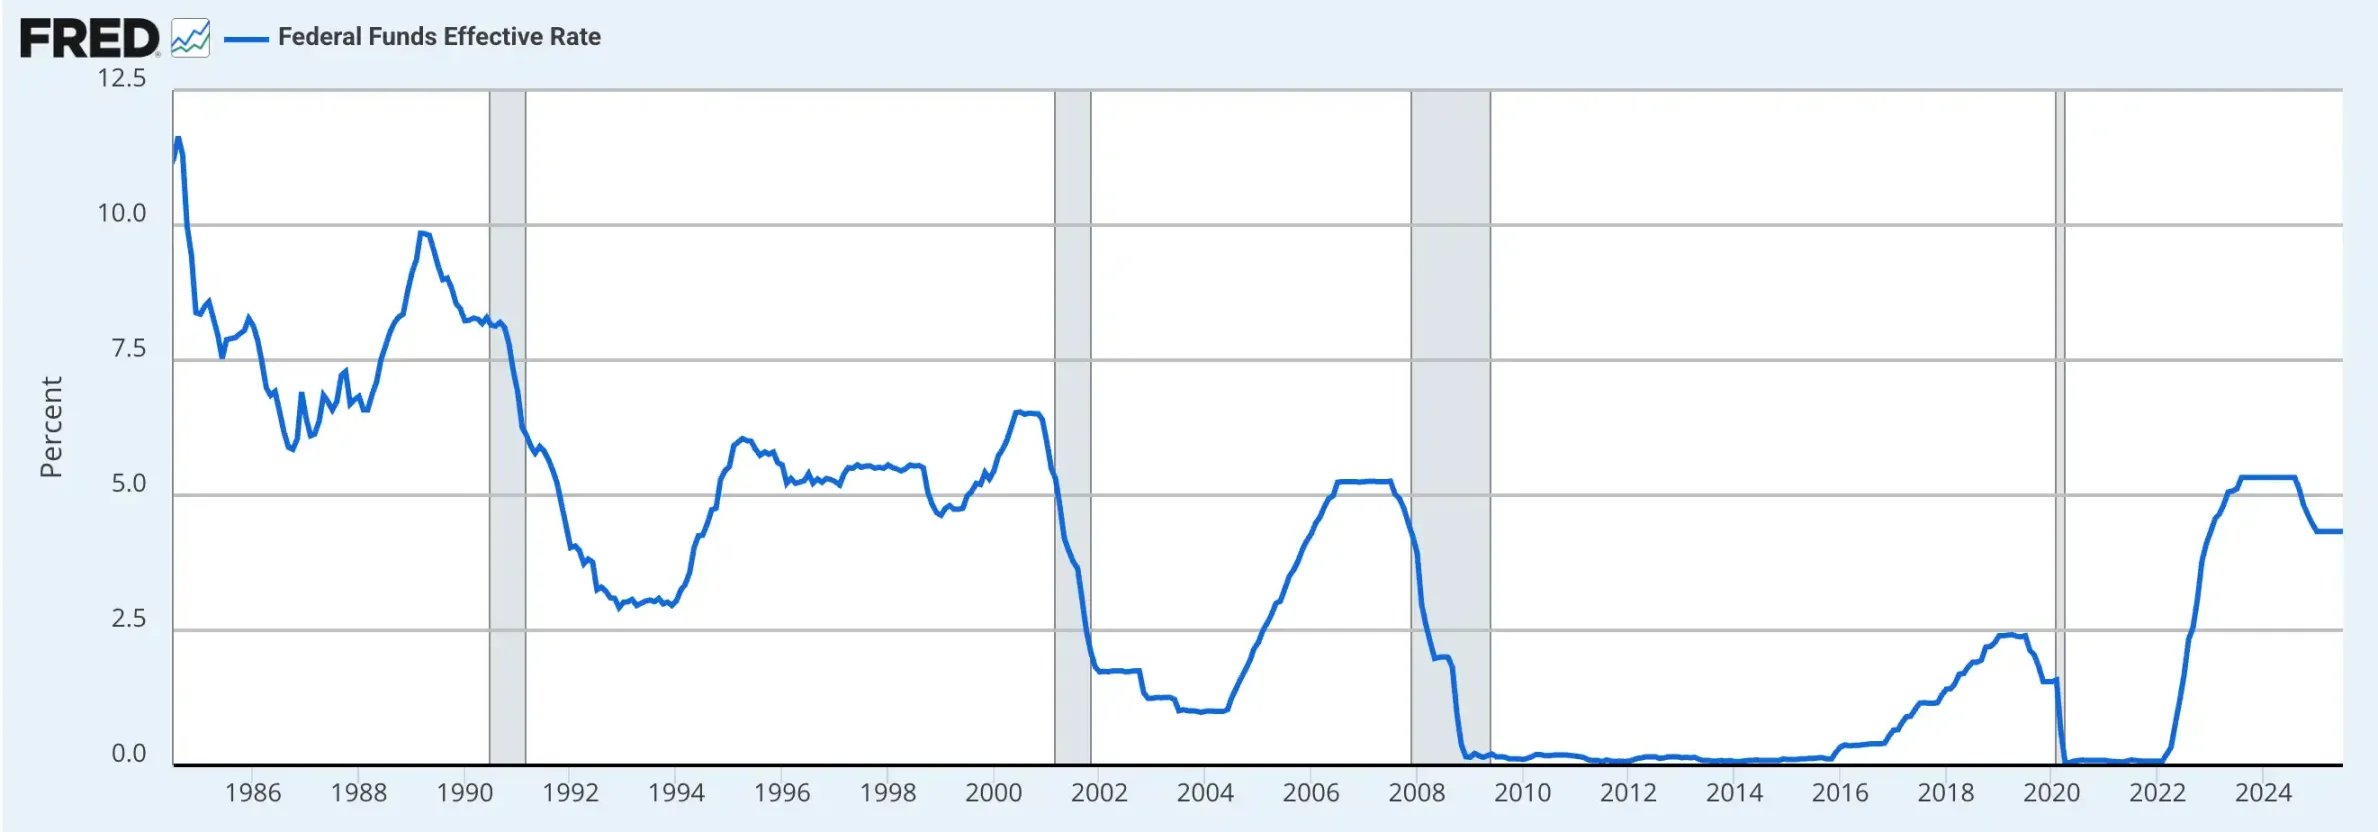
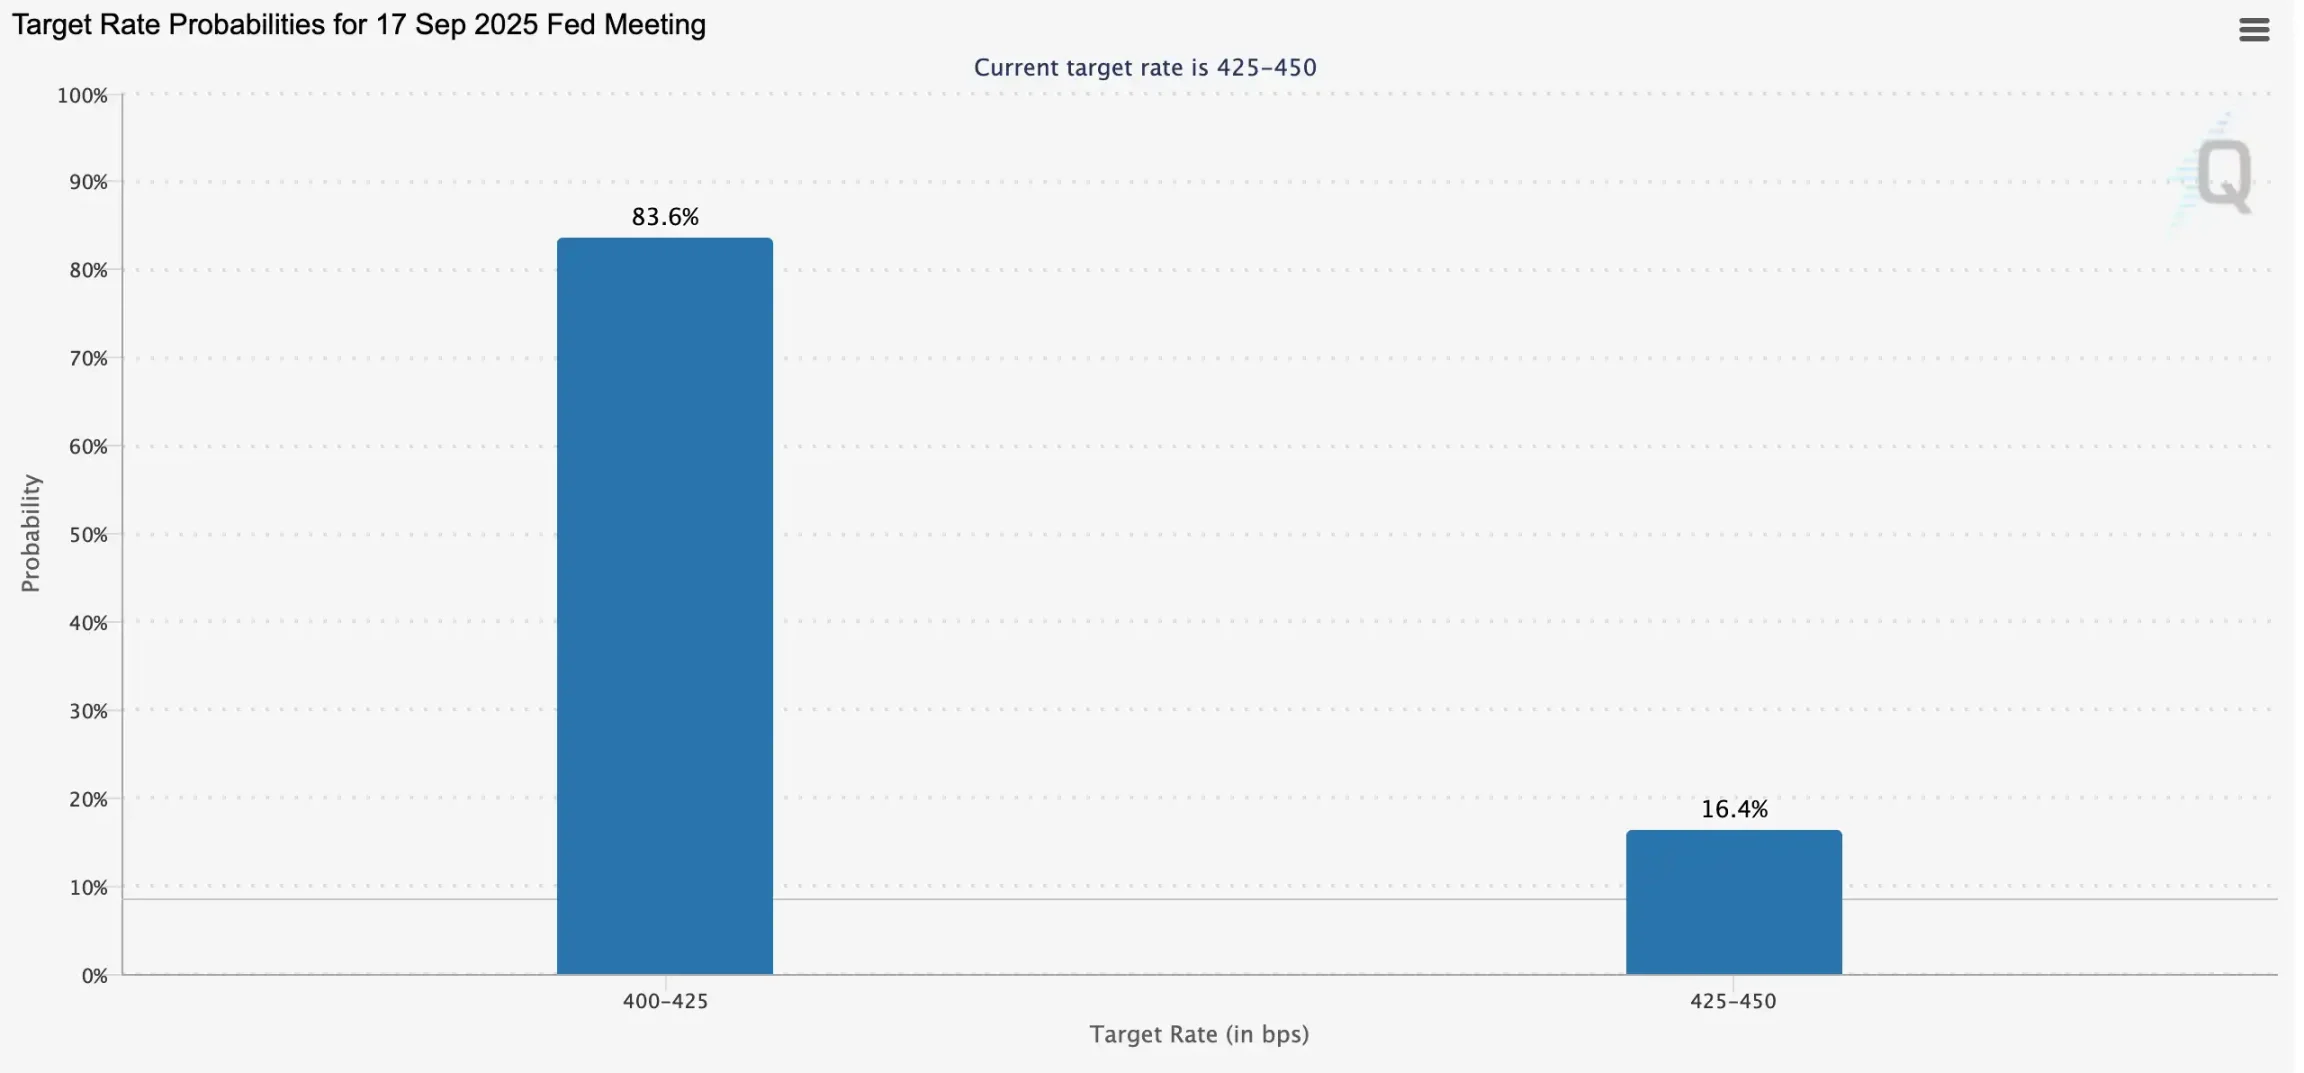
It has been a full year since the last rate cut, and the market is once again focusing on the September monetary policy meeting. According to FedWatch data, the probability of a 25 basis point rate cut by the Federal Reserve in September has reached 83.6%. Over the past year, after the rate cut, not only did the S&P and Nasdaq hit new historical highs, but Bitcoin also saw a surge, which has once again sparked market expectations of the "rate cut = bull market" logic, with Coinbase believing that a loose monetary cycle will bring an Altcoin season. However, is there really a necessary connection between rate cuts and market trends? This article will sort through the economic and stock market performance under the Federal Reserve's rate cut cycles since 1990, providing a more rational basis for judging whether a bull market is coming.
Rate Cuts and Bull Market: Stock Market Performance During Rate Cut Cycles
... [rest of the text continues in the same manner]2007–2009: Financial Crisis and Zero Interest Rate Era
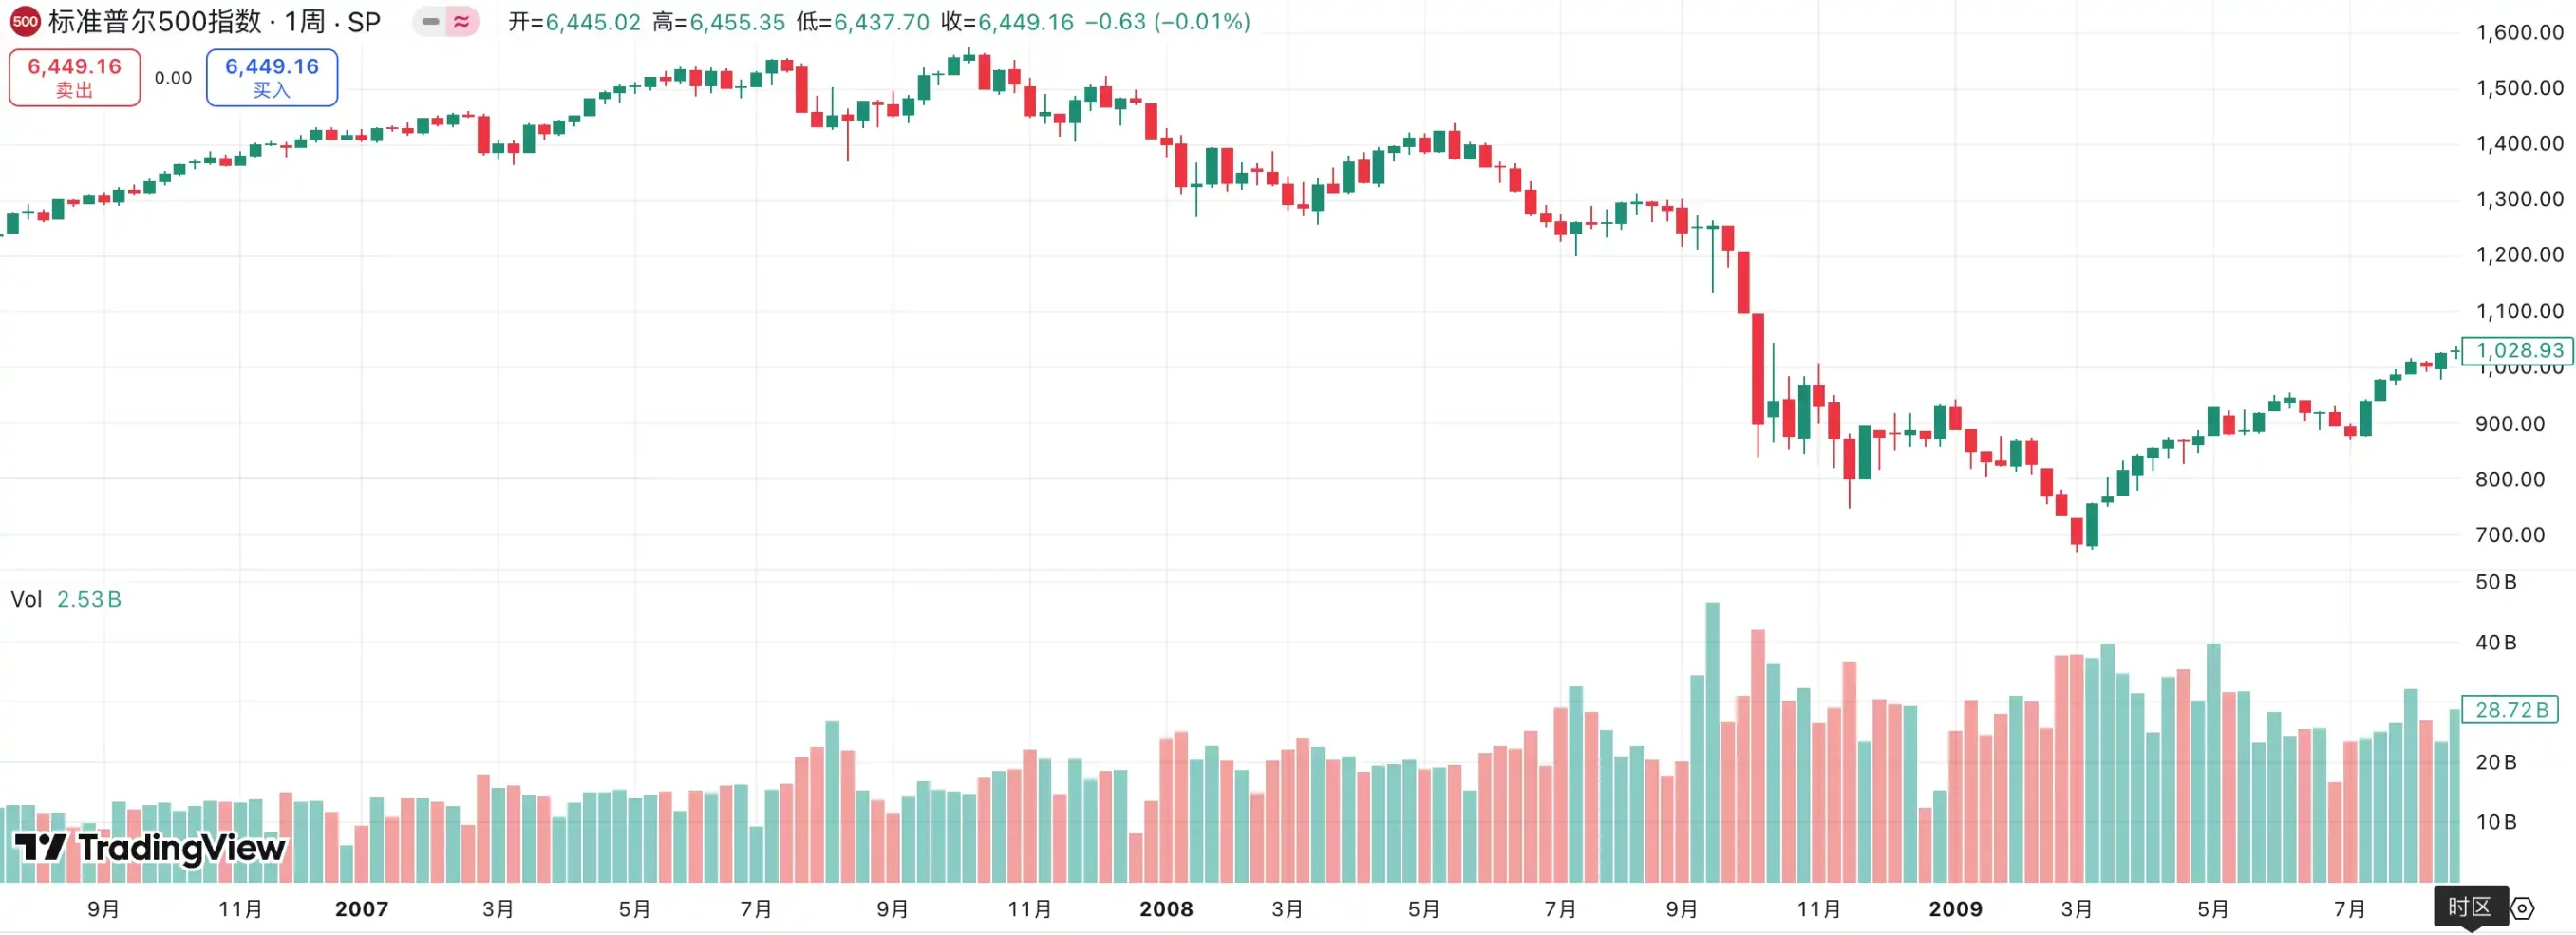
In 2007–2008, the global financial crisis broke out comprehensively, causing a profound impact on the US economy and financial system. The crisis originated from the burst of the real estate bubble and the concentrated outbreak of subprime mortgage issues. Previously, the US real estate market had been thriving, but as housing prices fell, numerous borrowers defaulted, and financial institutions suffered heavy losses from holding massive subprime loans and related derivatives, leading to a credit market freeze and sudden liquidity drought.
Facing the rapidly escalating crisis, the Federal Reserve began an aggressive interest rate cut cycle from September 2007, reducing the federal funds rate from 5.25% to the 0–0.25% range by the end of 2008, with a total reduction of 450 basis points, almost touching the zero interest rate lower limit. Its core purpose was to stabilize the financial market and banking system through extremely loose liquidity supply and mitigate the impact of credit contraction on the real economy. In March 2008, the Federal Reserve even facilitated Morgan Stanley's acquisition of the near-bankrupt Bear Stearns to prevent chain contagion of the crisis.
However, market panic did not dissipate. In September 2008, Lehman Brothers collapsed, marking the full-scale outbreak of the financial crisis. Subsequently, global markets fell into liquidity panic, with the US unemployment rate soaring above 10%, corporate and household assets significantly shrinking, and the economy falling into the most severe recession since the Great Depression. CPI experienced rare deflationary pressure, reflecting a cliff-like demand decline.
From macroeconomic data, interest rate cuts failed to stop the spread of economic recession. US GDP growth had dropped to 1.9% in 2007, further falling to -0.1% in 2008, and contracting to -2.5% in 2009. Until 2010, with the combined force of ultra-loose monetary and fiscal stimulus policies, the US economy gradually stabilized, with GDP growth rebounding to 2.6%, laying the foundation for a subsequent decade-long expansion cycle.
The stock market performance was even more brutal. Between 2007–2009, the Dow Jones Industrial Average plummeted 53.8%, the S&P 500 index plunged 56.8%, and the NASDAQ index fell 55.6%. This "Great Recession" revealed the difficulty of resolving crises through interest rate cuts alone.
2019–2021: Preventive Easing and Pandemic Impact
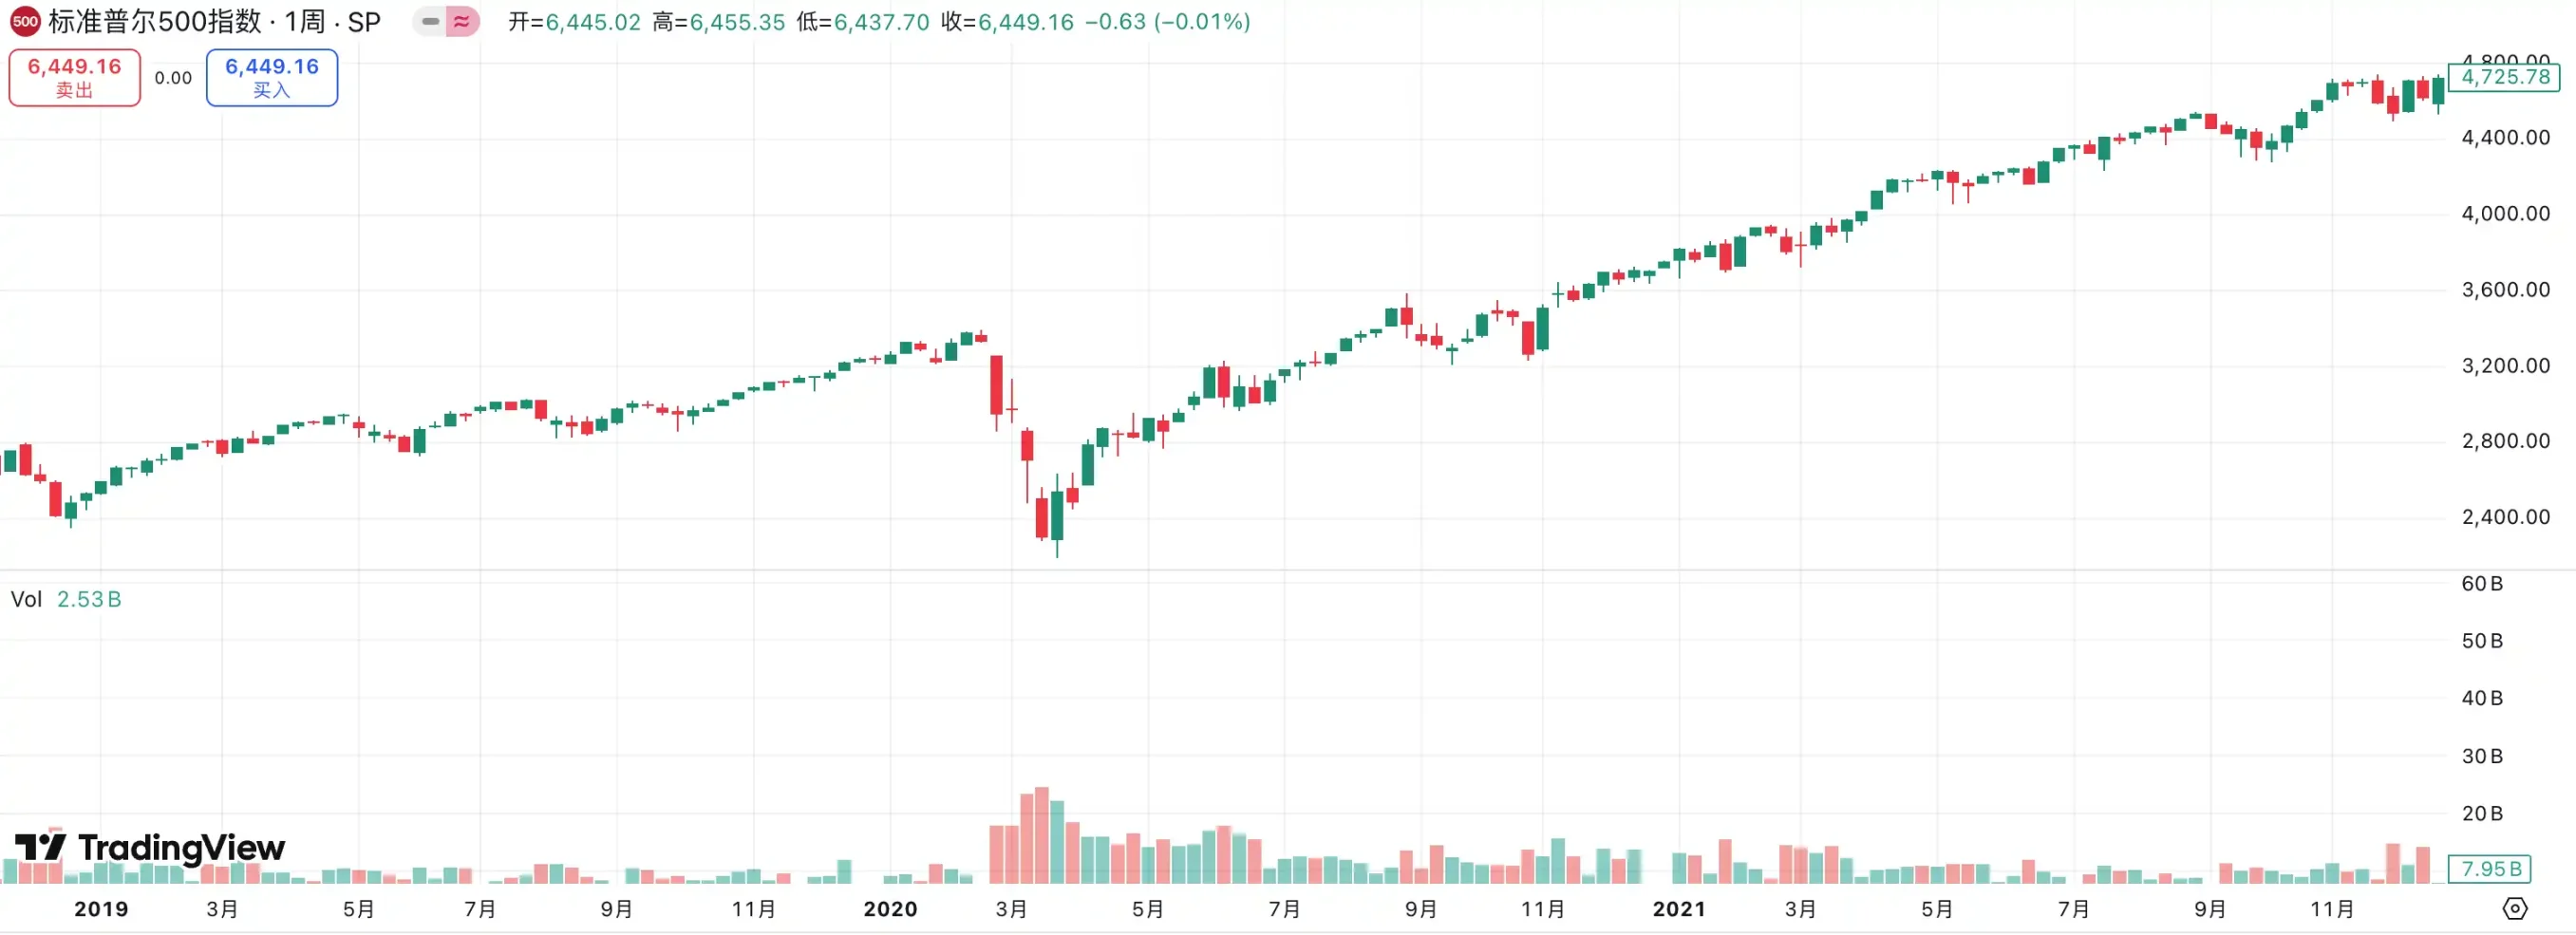
The Federal Reserve launched a new round of interest rate cuts in August 2019, initially aimed at addressing pressures from slowing global economic growth and uncertainties from US-China trade friction. However, this seemingly moderate preventive easing was pushed to the extreme by the sudden COVID-19 pandemic in early 2020. The pandemic spread rapidly, triggering unprecedented economic lockdowns and work stoppages, global supply chain disruptions, consumption plummets, soaring unemployment rates, and violent fluctuations in financial markets.
To stabilize the situation, the Federal Reserve urgently reduced the federal funds rate from 2.25% to near-zero levels of 0.25% in March 2020, accompanied by massive government fiscal stimulus and unlimited quantitative easing, with the balance sheet expanding dramatically. This was not just an interest rate cut but an extremely rare "unconventional operation" in monetary policy history, demonstrating the central bank's determination to stabilize the financial system and economic fundamentals.
From macroeconomic data, the US economy remained relatively stable in 2019, with GDP growth of 2.3%, though lower than previous years, still within a healthy range. However, 2020 became a turning point under the pandemic impact, with US GDP experiencing a historic contraction of -3.4%, the most severe since the 2008 financial crisis. Thanks to the ultra-loose monetary and fiscal policy combination, the US economy rapidly rebounded in 2021, with GDP growth reaching 5.7%, one of the fastest recoveries in forty years.
The stock market performance was equally thrilling. After the March 2020 crash, driven by loose policies and liquidity flood, US stocks staged a "V-shaped reversal" and subsequently soared: between 2019-2021, the S&P 500 index cumulatively rose 98.3%, NASDAQ surged 166.7%, and the Dow Jones Industrial Average recorded an impressive 53.6% increase. The extreme interest rate cuts and massive liquidity during the pandemic ultimately gave birth to the most rapid liquidity bull market in US stock market history.
How the Two Largest Bull Markets in Crypto History Occurred
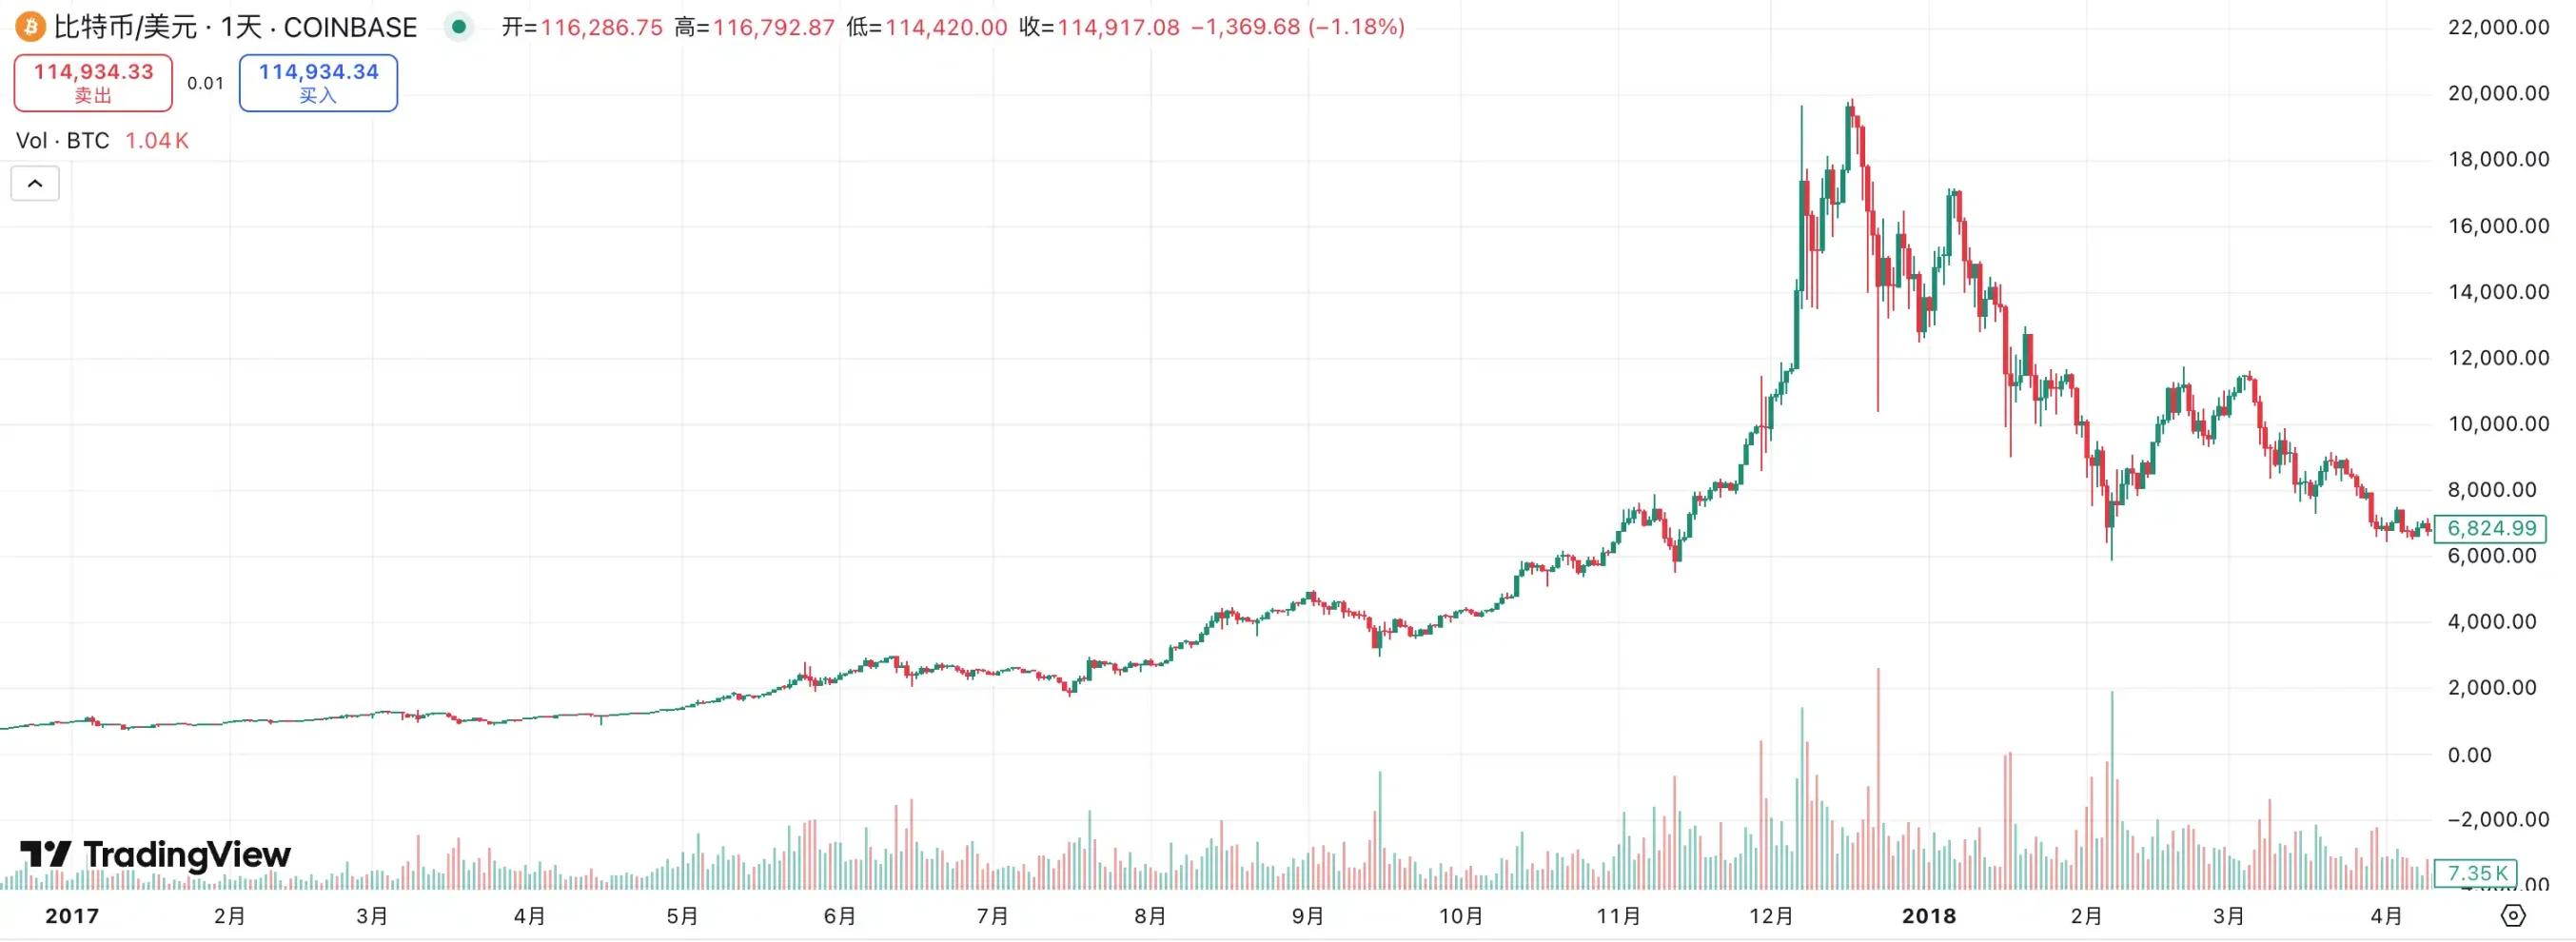
2017: ICO Frenzy and the First Crypto Bubble
2017 is widely regarded as the "first major outbreak" of the crypto market and the starting point when Altcoins truly entered the public eye. In the macroeconomic context, the global economy was in a recovery phase, with the US economy performing steadily. Although the Federal Reserve had begun attempting rate hikes, overall interest rates remained at historically low levels, with liquidity from previous years' monetary easing still lingering in the market. This macroeconomic environment provided fertile ground for speculative assets.
BTC prices surged from less than $1,000 at the beginning of the year to nearly $20,000 by year-end. The leading asset's surge directly attracted massive new funds and retail investors into the market. Against this backdrop, Altcoins experienced unprecedented prosperity. Unlike before, the primary driver of the 2017 Altcoin market was the ICO model: almost any project could complete financing quickly by issuing tokens on Ethereum.
Ethereum was undoubtedly the core beneficiary of this market trend. Since ICO projects were generally issued on Ethereum, it became the primary entry point for market funds. ETH prices soared from a few dollars to $1,400 within a year, driving the entire Altcoin sector's valuation. Simultaneously, from public chains and payment to storage and various new concept tokens, almost everything could attract funding in the short term, regardless of the narrative's substance.
However, enthusiasm often signifies a bubble. The 2017 Altcoin season was essentially a liquidity-driven speculative feast, with investment logic more dependent on "new stories" than actual applications. By early 2018, as BTC peaked and retreated, Altcoin prices generally experienced 80%–90% deep corrections. Many projects lacking fundamental value quickly went to zero.
Reviewing this history, the 2017 Altcoin season established the first global perception of crypto assets: they can generate massive wealth effects through liquidity and narrative but can also demonstrate extremely high risks when the bubble bursts.
2021: Liquidity Flood and DeFi, NFT Frenzy
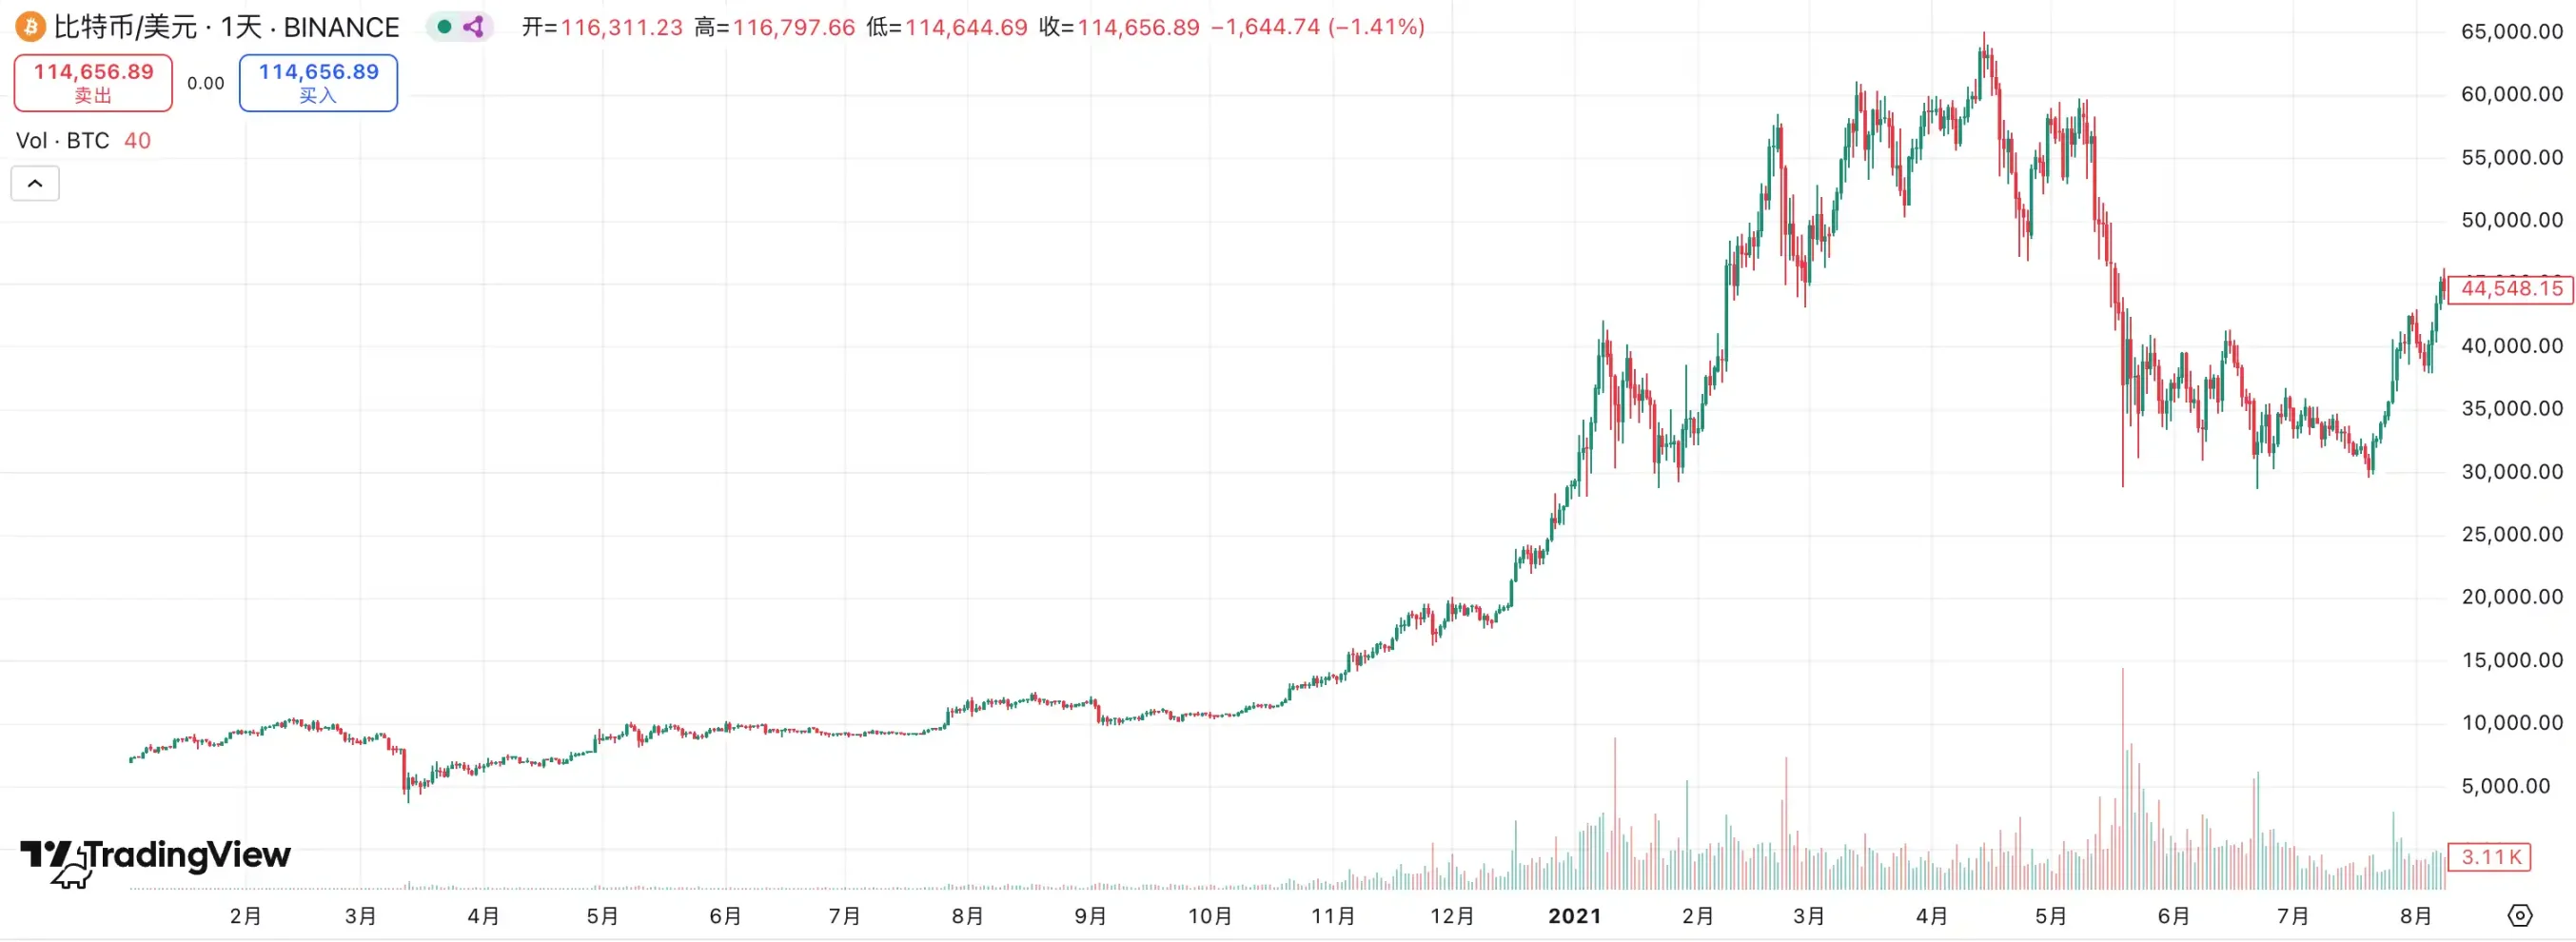
If the 2017 Altcoin season was a speculative feast ignited by ICOs, the 2021 Altcoin market was a comprehensive carnival against the backdrop of global liquidity flooding.
In terms of macroeconomic environment, the COVID-19 pandemic broke out in early 2020, and the Federal Reserve quickly reduced interest rates to near-zero and launched unprecedented quantitative easing (QE). Simultaneously, the US government introduced massive fiscal stimulus, directly issuing cash checks to residents. The loose monetary and fiscal dual stimulation caused financial market liquidity to overflow, with traditional and risk assets expanding simultaneously. After the US stock market's V-shaped rebound in 2020, BTC broke through the $20,000 mark by year-end and rapidly surged to $60,000 in the first quarter of 2021, opening space for the Altcoin market.
Unlike the "single point explosion" centered on ICO in 2017, the Altcoin season in 2021 presented a landscape of multi-track development. First, the rapid development of DeFi. Protocols like Uniswap, Aave, and Compound saw rapid growth in TVL, driving DeFi concept tokens to form an independent market trend; secondly, the emergence of Non-Fungible Token, with projects like CryptoPunks and Bored Ape making "digital collectibles" a globally discussed topic, and platforms like OpenSea experiencing explosive trading volume growth; meanwhile, Ethereum's ecosystem prosperity drove the rise of new public chains such as Solana, Avalanche, and Polygon, officially launching the public chain competition landscape.
Driven by this narrative, ETH rose from less than $1,000 at the beginning of the year to $4,800; SOL increased from less than $2 to $250, becoming one of the year's biggest dark horses. The entire crypto market capitalization broke through $3 trillion in November 2021, reaching a historical peak.
However, the rapid market expansion also planted the seeds of a bubble. Numerous imitation projects, over-financialized DeFi products, and MEME coins lacking basic support quickly gained popularity when hot money flowed in, but also significantly fell back after liquidity receded. As the Federal Reserve started its rate hike cycle in 2022, global liquidity tightened, and the crypto market quickly cooled down, with Altcoins generally experiencing a 70%-90% deep correction.
Looking back at this stage, the Altcoin season in 2021 demonstrated the extreme prosperity that the crypto market could achieve under the push of liquidity flood and diverse narratives.
Current Insights: Preventive Easing and Altcoin Season
From historical review, the Federal Reserve's rate cuts can be divided into two categories: preventive rate cuts and relief rate cuts. Those in 1990, 1995, and 2019 belong to the former, with rate cuts occurring before a comprehensive economic recession, mostly to hedge risks and often injecting new growth momentum into the market; while in 2001 and 2008, rate cuts were forced under the pressure of financial crises, with markets experiencing violent declines. In the current context, with a weak labor market, uncertainties from tariffs and geopolitics, but inflation showing signs of easing, the overall environment is closer to "preventive rate cuts" rather than a crisis background. It is precisely because of this that risk assets have continued to strengthen this year, with both Bitcoin and US stocks hitting historical highs.
The environment facing the crypto market is also different from before. Policy-wise, there are unprecedented positive signals: stablecoins are gradually being incorporated into compliance frameworks, digital asset treasuries (DAT) and treasury management represented by MicroStrategy are becoming enterprise allocation trends, institutions are officially entering through ETFs, and the narrative of tokenizing real-world assets (RWA) is also accelerating.
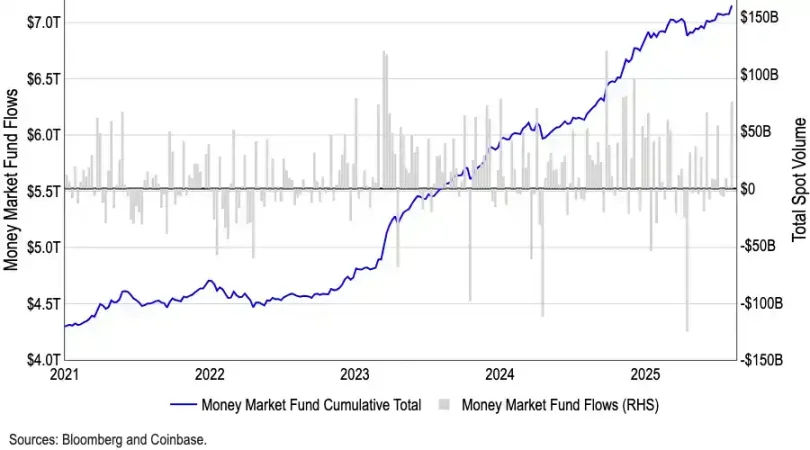
Although many debate whether the September rate cut will cause a short-term peak in the crypto market, from a capital flow perspective, such concerns may be exaggerated. The scale of US money market funds has reached a record $7.2 trillion, with a large amount of funds trapped in low-risk tools. Historically, capital outflows from money market funds often positively correlate with risk asset appreciation. As rate cuts land, their yield attractiveness will gradually weaken, and more funds are expected to be released into crypto and other high-risk assets.
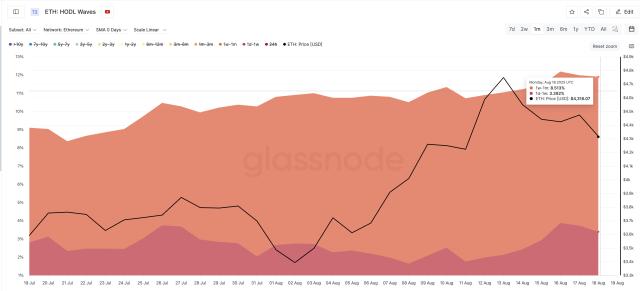
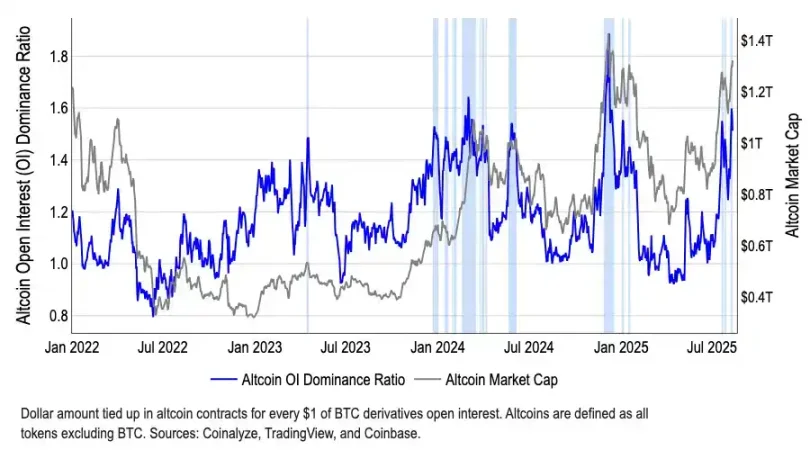
Moreover, structurally, capital has begun to gradually leave Bitcoin. BTC's market dominance has dropped from 65% in May to 59% in August, while the total market cap of Altcoins has grown by over 50% since early July, reaching $1.4 trillion. Although CoinMarketCap's "Altcoin season index" remains around 40, far from the traditional 75 threshold, this deviation between "low indicator - soaring market cap" precisely reveals that capital is selectively entering specific sectors, especially Ethereum (ETH).
Summary
The logic of this bull market is completely different from the past. Due to the vast number of projects, it is no longer possible to reproduce the grand scene of "all coins rising". Investors' focus is gradually shifting towards value investment and structural opportunities - capital is more willing to flow to top projects with real cash flow, compliance prospects, or narrative advantages, while long-tail assets lacking fundamental support are destined to be marginalized.
At the same time, the overall market valuation is already high, and whether treasury strategies are "over-financialized" remains unknown. If concentrated selling by institutions or project parties occurs, it could easily trigger a stampede effect, causing a deep market impact. Additionally, global macro uncertainties (such as tariffs and geopolitics) cannot be ignored by investors.
Therefore, although we are optimistic about crypto asset performance under the rate cut cycle and policy benefits, we must admit that this is more like a structural bull market, not an indiscriminate rise. Rational investment and carefully selecting tracks are the keys to navigating volatility.
Twitter: https://twitter.com/BitpushNewsCN
Bitpush Telegram Group: https://t.me/BitPushCommunity
Bitpush Telegram Subscription: https://t.me/bitpush