#BTC
- Technical indicators show short-term bearish momentum but long-term bullish structure remains intact
- Institutional interest and macro factors could override technical resistance levels
- Market awaits clearer signals from Fed policy and institutional flows for next major move
BTC Price Prediction
BTC Technical Analysis: Key Indicators and Trends
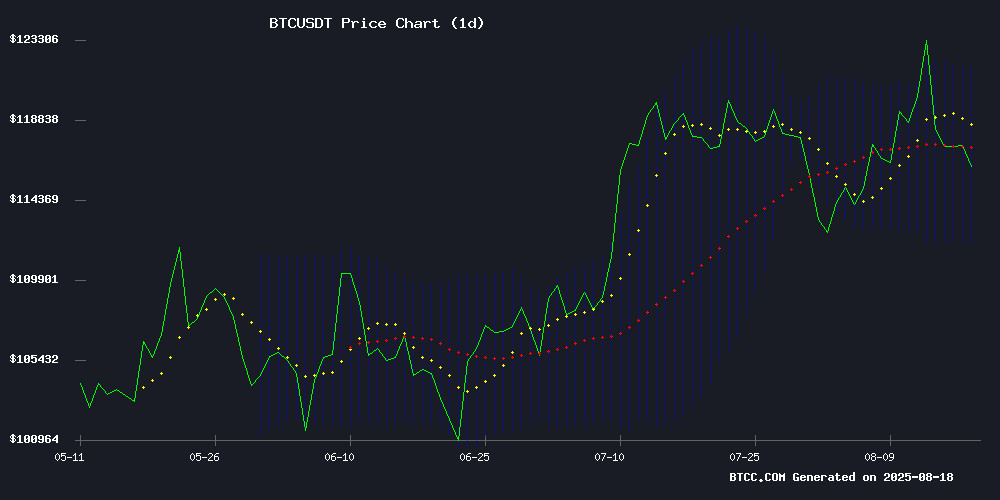
According to BTCC financial analyst Sophia, BTC is currently trading at $115,359.80, slightly below its 20-day moving average (MA) of $116,782.33. The MACD indicator shows a bearish crossover with a value of -1,168.65, suggesting short-term downward momentum. Bollinger Bands indicate moderate volatility, with the price hovering NEAR the middle band. Sophia notes that a break above the upper band at $121,717.49 could signal a bullish reversal, while a drop below the lower band at $111,847.17 may confirm further downside.
Market Sentiment: Mixed Signals Amid Volatility
BTCC financial analyst Sophia highlights conflicting market sentiment from recent headlines. While bullish catalysts like Michael Saylor's potential new Bitcoin purchases and Larry Fink's WEF appointment suggest institutional interest, warnings about a peaked bull run and $800M liquidations create uncertainty. Sophia observes that Bitcoin's consolidation near $118K reflects this tug-of-war between Optimism and caution, with Powell's upcoming Jackson Hole speech likely to provide clearer direction.
Factors Influencing BTC's Price
Bitcoin Price Tests $117K Support Amid $800M Liquidations
Bitcoin faced renewed selling pressure over the weekend, briefly dipping below $117,000 after more than $800 million in long positions were liquidated. The move sparked debate among analysts—was this a healthy consolidation or the beginning of a deeper correction? At press time, BTC hovered near $118,000.
Technical analysts flagged $120,000 as immediate resistance, reinforced by volume profiles and VWAP anchoring. Support clusters emerged at $118,200 and $116,300—the latter aligning with the 200-day EMA and key Fibonacci levels. Momentum indicators painted conflicting pictures: four-hour charts showed hidden bullish RSI divergence, while daily charts revealed bearish signals.
The $116,000-$117,000 zone has become a critical battleground. A breakdown could target $113,000-$110,000, while reclaiming $120,000 might open a path toward $126,000. Some traders see $130,000 as the next major hurdle if bullish momentum resumes.
Bitcoin Faces Pullback: Will Q4 Rally Push Price Over $130,000?
Bitcoin's recent surge to an all-time high of $124,000 was short-lived as the asset faced a pullback, marked by two consecutive bearish candles. Investors remain cautious, yet optimistic, as historical patterns suggest a potential Q4 rally.
August saw subdued price action, with Bitcoin consolidating in a tight range. Analysts note that such periods of calm often precede significant volatility. Daan Crypto Trades highlights the lack of clear directional momentum, though seasonal trends point to a robust year-end rally.
Profit-taking has slowed, but SOPR divergence signals potential market instability. A deeper retracement in the coming weeks could set the stage for a repeat of previous bull market cycles, where Q4 delivered explosive gains.
Bitcoin Eyes Upside as Michael Saylor Signals Potential New Buy
Bitcoin shows signs of a potential rally as MicroStrategy's Michael Saylor hints at further accumulation. The company currently holds 628,946 BTC, valued at approximately $75 billion, with market watchers anticipating price movement following any additional purchases.
Trading at $117,949 with a $2.35 trillion market capitalization, Bitcoin posted modest 0.11% gains over 24 hours despite weak recent price action. Analysts suggest the cryptocurrency may be poised for stronger upward momentum in coming sessions.
Market dynamics show declining trading volume alongside slightly rising open interest, suggesting a potential breakout after the current consolidation phase. Saylor's cryptic 'Insufficient Orange' tweet has reignited speculation about institutional buying pressure.
BlackRock CEO Larry Fink Named WEF Interim Co-Chair, Signaling Potential Boost for Digital Assets
Larry Fink's appointment as interim co-chair of the World Economic Forum marks a pivotal moment for institutional crypto adoption. The BlackRock CEO brings his firm's trillion-dollar influence and pro-Bitcoin stance to one of the world's most influential policy platforms.
BlackRock's landmark Bitcoin ETF approval earlier this year already reshaped institutional investment strategies. Fink's new role at WEF could accelerate the integration of digital assets like BTC into global financial infrastructure and policy discussions.
The move follows WEF's governance recalibration and comes as questions of institutional trust and cross-border cooperation dominate economic forums. Fink's ESG leadership at BlackRock aligns with WEF's climate resilience priorities, potentially creating synergies for blockchain-based solutions.
Bitcoin Set to Outperform Gold as Kiyosaki Hails It as 'People's Money'
Bitcoin continues to assert its dominance over gold, with the precious metal slipping nearly 2% this week. The divergence fuels growing speculation that BTC may be emerging as the superior hedge against inflation and macroeconomic instability.
Technical indicators suggest a brewing breakout. Bitcoin trades in a tight range between $117,200-$118,500—a compression zone historically preceding volatile moves. Critical support at $116,963 shows substantial accumulation per Glassnode's URPD metric. A hold above this level could establish a new base for upward momentum.
The daily chart reveals a bullish ascending triangle formation, reinforced by long-term moving averages. While the RSI at 53 leaves room for upside, MACD signals near-term consolidation. A decisive break above $123,235 may trigger a rally toward $127,300 and potentially $131,500. Conversely, failure to maintain $116,700 risks a pullback to the 50-day SMA at $112,500.
Institutional adoption remains a key driver. Spot BTC ETF flows demonstrate sustained demand, with the instrument's growing traction among traditional investors contributing to Bitcoin's resilience amid market fluctuations.
Bitcoin Price Consolidates Near Key Support Levels Amid Market Volatility
Bitcoin's price hovered around $118,000 after a week of significant volatility, briefly touching a record high above $124,000. Analysts point to a Wyckoff Accumulation pattern, suggesting institutional demand may drive further gains. Key support levels at $117,000 and $114,000 remain robust, with on-chain data reinforcing buyer confidence.
The recent rally followed the US Producer Price Index release, which triggered volatility across risk assets. According to analyst Ted, Bitcoin's current phase aligns with the 'Sign of Strength' stage in the Wyckoff framework, indicating potential for continued upward momentum. The Wyckoff model, a century-old market structure tool, is often used to identify institutional accumulation phases.
Market participants are divided on whether the pullback represents a healthy consolidation or exhaustion. However, technical indicators and on-chain metrics suggest sustained buying interest at current levels. The cryptocurrency's ability to hold above critical support zones could set the stage for another leg higher.
Bitcoin Mining Profitability Rises 2% in July Amid BTC Price Rally
Bitcoin mining profitability climbed 2% in July as the cryptocurrency's price surged 7%, according to a Jefferies research report. The network hashrate increased 5%, reflecting heightened competition among miners.
U.S.-listed mining firms produced 3,622 BTC during the month, up from 3,379 in June. These companies accounted for 26% of total network production, with IREN and MARA Holdings leading output at 728 and 703 BTC respectively.
MARA maintained sector dominance with 58.9 EH/s hashrate, followed by CleanSpark at 50 EH/s. Revenue metrics showed improvement, with hypothetical 1 EH/s operations generating $57k daily in July versus $56k in June.
Market Volatility Drops Ahead of Powell's Jackson Hole Speech
A pronounced calm has settled across global markets as traders await Federal Reserve Chairman Jerome Powell's keynote at the Jackson Hole Symposium. Bitcoin's 30-day implied volatility plunged to two-year lows near 36%, mirroring similar contractions in gold, Treasuries, and equity volatility gauges.
The synchronised decline reflects expectations for policy easing from restrictive levels rather than crisis-driven interventions. "Central banks aren't cutting from emergency settings like 2008 or 2020," noted one strategist. "This is deliberate normalization from hawkish peaks."
CME's gold volatility index halved since April to 15.22%, while the MOVE index for Treasury volatility hit 3.5-year lows. Wall Street's VIX fear gauge collapsed from 45% to sub-14% in four months, with FX majors like EUR/USD showing parallel compression.
Tether's Sovereign-Scale Reserves Spark Comparisons to Central Banks
Tether's Q2 2025 attestation reveals a balance sheet rivaling nation-states, with $162.57 billion in assets dwarfing most private entities. The stablecoin issuer now holds $127 billion in U.S. Treasuries—more than Germany or the UAE—positioning it as the 18th largest global holder of U.S. debt.
The $5.46 billion surplus above liabilities creates a safety buffer unprecedented in crypto. Tether's reserve structure mirrors the Federal Reserve's at 1/40th scale: 65% U.S. Treasuries, 5.5% Bitcoin and gold, and 3.4% equity surplus. This alignment with central bank asset allocation raises questions about systemic influence.
With $8.9 billion in Bitcoin holdings, Tether's treasury strategy increasingly impacts crypto markets. The company's secured loans ($10.1B) and alternative assets now exceed the GDP of small nations, blurring lines between private enterprise and monetary authority.
Analyst Warns Bitcoin Bull Run May Have Peaked Amid Market Uncertainty
Bitcoin faces renewed scrutiny as veteran trader Peter Brandt suggests the cryptocurrency may have already hit its cycle top. With BTC trading below $117,500, Brandt assigns a 30% probability that the bull market has concluded prematurely, potentially ushering in a correction phase lasting until 2026. Price projections indicate a possible retreat to $60,000-$70,000 before the next major rally.
Despite short-term bearish signals, Brandt maintains long-term conviction in Bitcoin's value proposition. His $500,000 price target reflects Bitcoin's enduring superiority over gold as a store of value. The analysis incorporates insights from crypto researcher 'Colin Talks Crypto,' whose historical cycle models inform Brandt's tempered outlook.
Bitcoin Holds Steady Near $118K Amid Pullback Warnings and Altcoin Rotation
Bitcoin stabilized around $118,348 with a modest 0.39% gain as analysts warned of potential downside risks. Lark Davis highlighted a critical support zone between $108,000 and $112,000, anchored by historical resistance-turned-support levels and Fibonacci retracement markers. The 20-week exponential moving average further reinforces this area as a likely battleground for buyers and sellers.
Technical traders are watching for confluence—where multiple signals align—as these zones often attract price tests. Meanwhile, the market's sideways action leaves room for altcoins to capture attention, though Bitcoin's dominance remains the primary narrative.
Will BTC Price Hit 200000?
Sophia from BTCC provides a measured outlook: 'While $200,000 remains possible in this cycle, current technicals suggest consolidation is more likely in the near term. The 20-day MA at $116,782 and MACD divergence show weakening momentum. However, fundamental factors like institutional adoption could drive prices higher in Q4.'
| Key Levels | Value |
|---|---|
| Current Price | $115,359.80 |
| 20-day MA | $116,782.33 |
| Upper Bollinger | $121,717.49 |
| Projected Q4 Target | $130,000-$150,000 |
cautiously optimistic