In the past two days, the market has returned to a "Trump-determines" trend, meaning his remarks influence market ups and downs. Recent sharp drops and rises are related to trade negotiations. Trump announced before the US stock market opening that he had something to declare, which the market viewed as positive, leading to a rally in US stocks and driving up the cryptocurrency market. Bitcoin has recovered to the $115,000 level.
VX:TZ7971
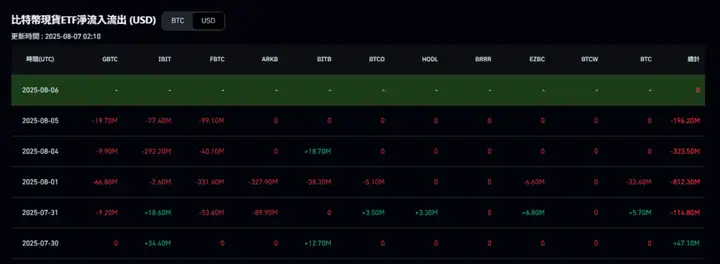
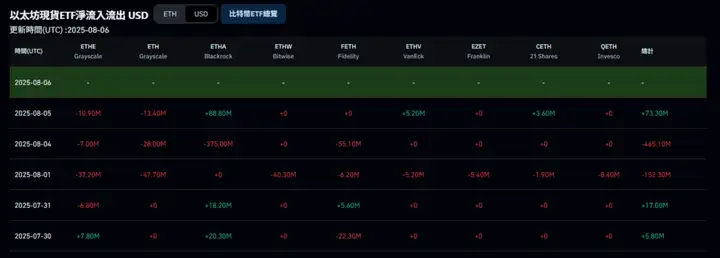
However, the US spot ETF shows a different trend. The BTC ETF has experienced net outflows for four consecutive days, with the outflow starting around the time of the non-farm payrolls data issue. The ETH ETF performance is more optimistic, with Ethereum turning to net inflows, while Bitcoin remains in net outflow. This reflects investors' recent higher confidence in Ethereum, likely due to multiple institutional buying and hype effects.
Tonight, the US will release unemployment data. Given the recent non-farm payrolls event, the market is expected to pay close attention to these numbers. With several Federal Reserve board members suggesting it's time to cut rates, the market is likely to lean towards optimism. The ongoing Russia-Ukraine peace talks and EU-India tariff issues have increased market uncertainty, so it's important to watch Trump's recent statements.
Bitcoin is currently consolidating in a small "liquidity gap" between $110,000 and $116,000, as the market awaits new demand to establish a more stable price level.
After reaching a historical high of over $123,000 in mid-July, BTC has now pulled back to $113,000. This trend has left many recent investors at a loss and created a supply cluster with a cost basis above $116,000.
This cluster has repeatedly supported price increases until BTC broke through and entered the liquidity gap on July 31. Historically, such liquidity-thin areas often become accumulation zones as buyers enter, hoping to get a bargain.
Glassnode compared the URPD (Realized Price Distribution) data between July 31 and August 4 to assess buy the dips activity.
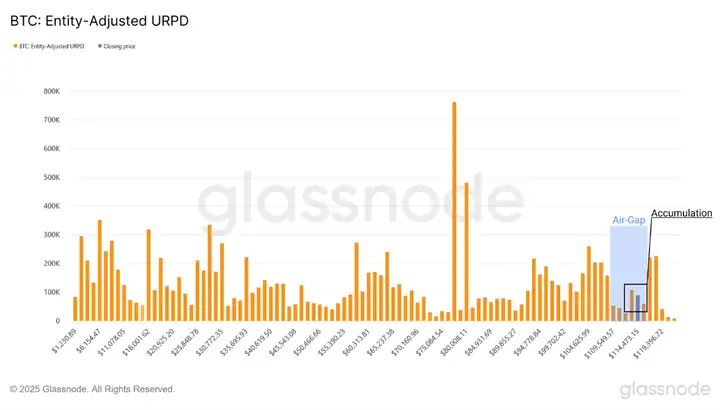
After rebounding from the $112,000 region, investors bought around 120,000 BTC, pushing spot prices above $114,000, indicating opportunistic buying remains active. However, the $110,000 to $116,000 area still lacks clear accumulated supply. This accumulation period could serve as a springboard for the next rally.
New Resistance and Indicators Not Overheated
Currently, this rally has not yet broken through the cost of BTC held by investors for about a week to a month—significant resistance exists around $116,900. Successfully breaking this level might signal demand has regained control. Conversely, failure to break through could drag BTC back, testing the historical high around $110,000.
According to glassnode, BTC price remains "warm" but not overheated. The price is above the short-term holder (STH) average cost of $106,000—a threshold typically marking the division between bullish and bearish phases in a bull market cycle.
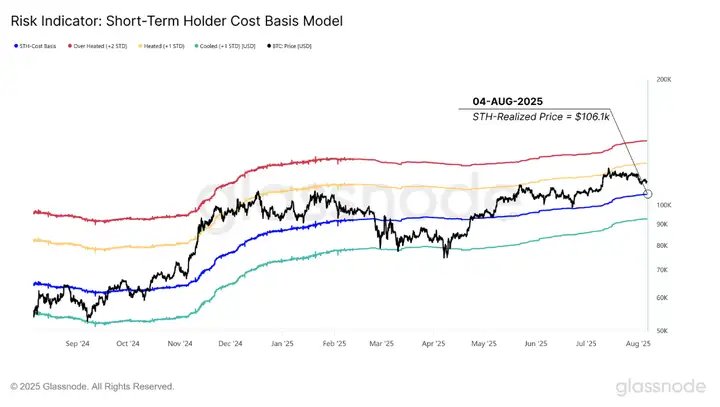
During this pullback, the number of BTC held by short-term investors with profits dropped from 100% to 70%, in line with the average of previous bull market cycles. Their profitable trading volume also decreased to 45%, below the neutral threshold—indicating a balanced market without a clear dominant position.
ETF and Derivatives Market
On August 5, the US spot Bitcoin ETF recorded approximately 1,500 BTC in outflows, the largest net outflow since April 2025. While such outflows are typically temporary, monitoring long-term trends is crucial.
In the derivatives market, perpetual contract funding rates have fallen below 0.1% (neutral zone), reflecting cooling speculative interest and more cautious recent bullish sentiment.
Bitcoin remains in the $110,000 to $116,000 price range, accumulating supply and waiting for sufficiently strong demand to break through $116,900 and reaffirm the upward trend.