
Key Indicators (July 21st 4 PM Hong Kong Time to July 28th 4 PM Hong Kong Time)
- BTC/USD -0.3% (119,400 USD → 119,000 USD), ETH/USD +2.4% (3,800 USD → 3,890 USD)
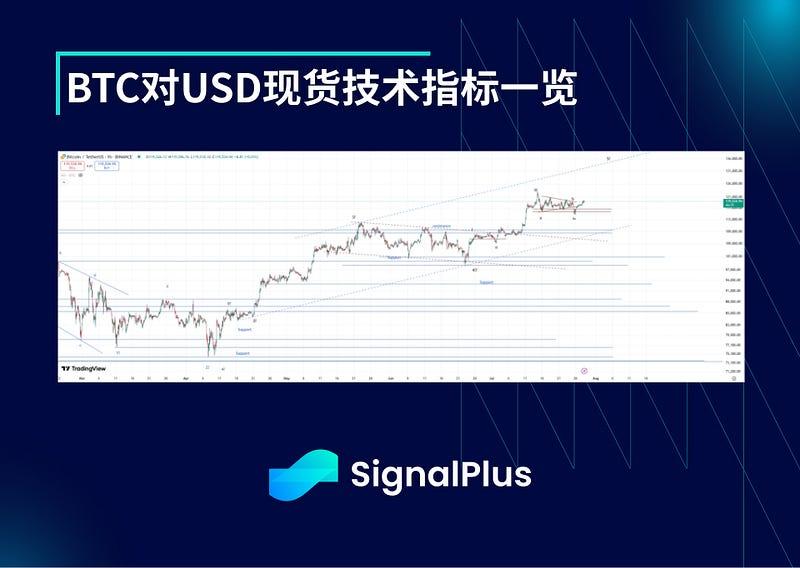
- Last week, the market entered a consolidation phase. On Friday, it attempted to explore the support level of 115,000 USD, briefly breaking through before quickly rebounding and ultimately holding the line. Currently, the price has returned to the consolidation range, with increased upward momentum. On the surface, this formation lays a strong foundation for returning to the all-time high (ATH), and if successfully broken through, the target price may point to the 125,000–135,000 USD range.
- If 115,000 USD is breached, the pullback may continue to deepen, potentially dropping to around 112,000 USD. If the stronger support level of 109,000 USD is lost, it could lead to a more significant price decline, requiring us to reassess the trend.
Market Themes
- Overall, market sentiment remains optimistic: US stock earnings data remains robust, continuing the "Goldilocks" scenario, and economic data paves the way for potential Fed rate cuts in the coming months, with no significant signs of inflation resurgence. Although tariff issues persist, the peak of uncertainty has passed, with most countries (except China) ultimately compromising to US/Trump demands, benefiting the US the most.
- Cryptocurrencies remain generally strong in this environment, but crypto-related stocks (such as $SBET and $BMNR ETH concept stocks) significantly gave back their previous exaggerated gains last week due to market rationalization and the fading meme craze. However, spot prices were not significantly impacted: ETH remained stable above 3,700 USD; BTC, despite facing selling pressure of 9 billion USD through Galaxy by some long-term holders (executed last Friday), still showed strong support around 115,000 USD and rebounded to above 119,000 USD over the weekend. Current bull market participation is slightly subdued due to the summer off-season, but may attract more capital inflow in the coming months if the macro environment remains stable.
BTC USD ATM Implied Volatility
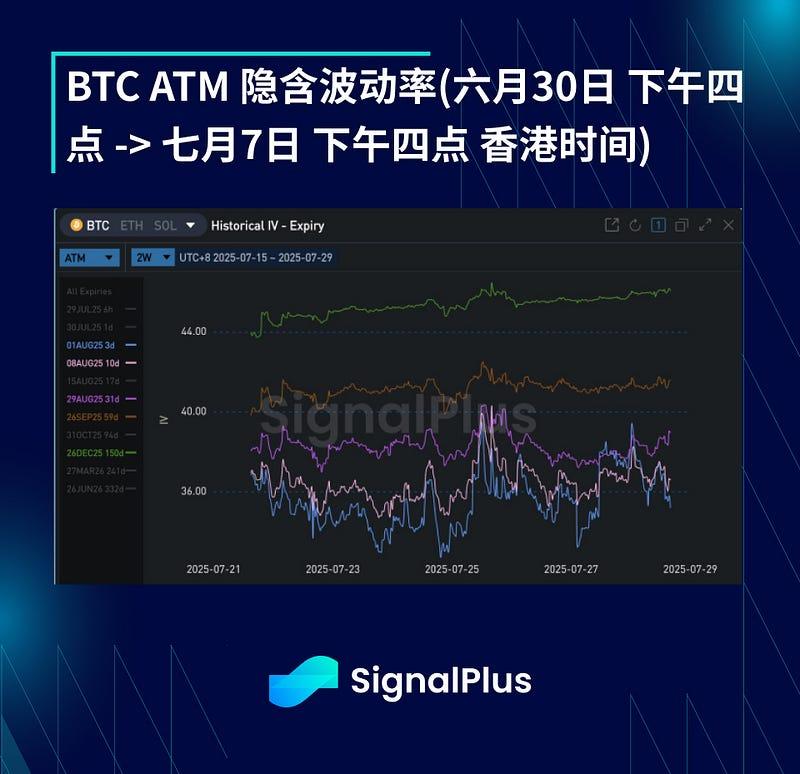
- Actual volatility dropped to the mid-20% range early last week (as spot prices remained stuck at 118,000–119,000 USD), but briefly explored 120,000 USD before the weekend due to MSTR announcing an additional 25 billion USD stock issuance (originally planned at 5 billion USD), followed by a drop to 115,000 USD on Friday due to 9 billion USD selling pressure. Although it recovered to 118,000 USD and explored 120,000 USD on Monday morning, short-term implied volatility continues to decline as the market is clearly in the 115,000–121,000 USD range with excess long Gamma.
- The term structure is gradually steepening but remains relatively flat compared to historical levels, making it difficult to price long-term term premiums. However, long-term option seller liquidity is drying up, and localized price fluctuations (such as dropping to 114,600 USD on Friday) have led the market to continuously seek directional opportunities through 9–12 month expiration options — considering lower base volatility and higher leverage.
BTC USD Skew/Kurtosis
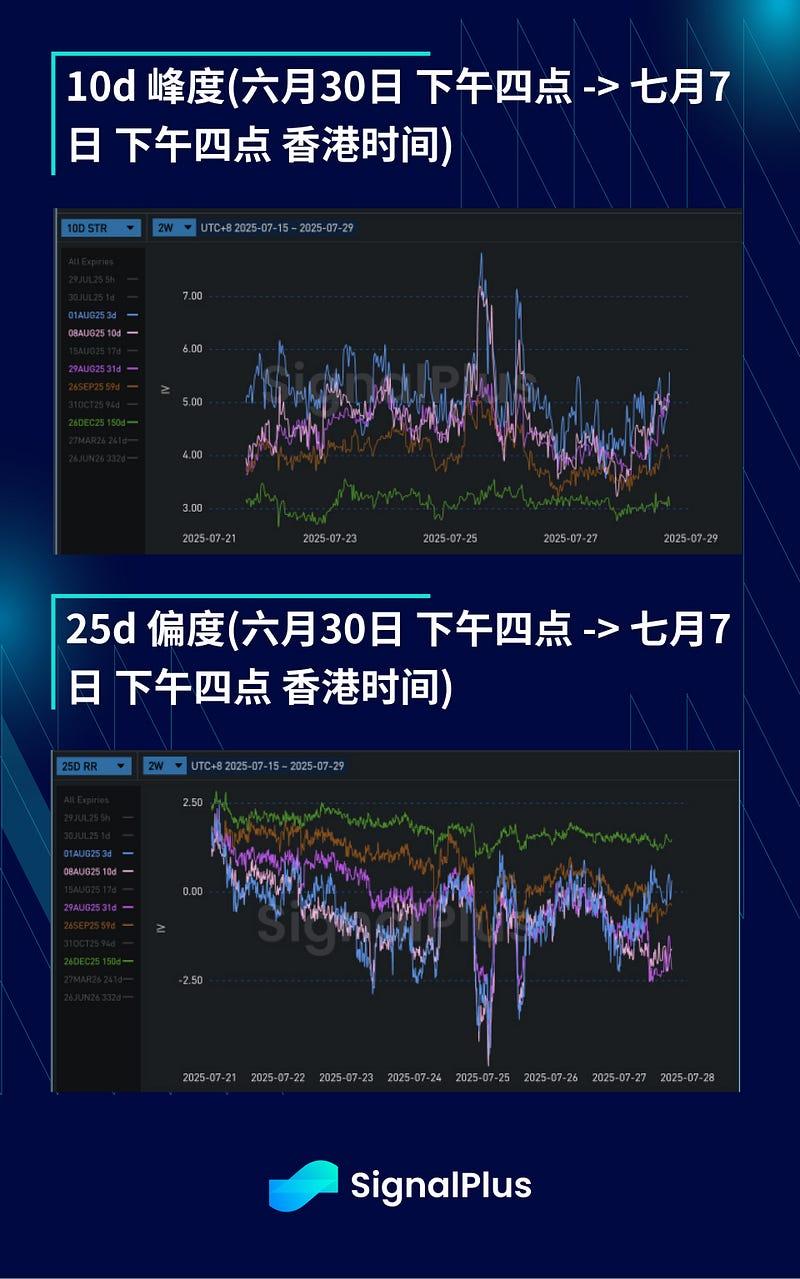
- Skew: Short-term put option demand surged (due to Friday's sell-off raising concerns about a deep 112,000–110,000 USD pullback), with 1–2 week 110,000 USD strike price hedging further pushing up put skew. Although actual volatility has not significantly increased, and price rebounds are equally volatile, the skewed price is expected to be unsustainable at current levels unless 115,000 USD is confirmed to be breached. Long-term demand remains focused on call options, supporting upward skew.
- Kurtosis: Short-term kurtosis increased due to rising put hedge demand in the wings. The butterfly curve is severely inverted, and with BTC asset volatility at historical highs, the strategy of "long long-term butterfly options + short short-term butterfly options" offers good value.
- Wishing you a successful trading week!