ETH is strongly supported between $2,500 and $3,000, with signs of Altcoin season emerging.
Written by: UkuriaOC, CryptoVizArt, glassnode
Translated by: AididaoJP, Foresight News
As Bitcoin breaks through $120,000, Altcoins generally show strong momentum, but the surge in open interest across the industry indicates that a speculative bubble may be forming, which also means the risk of increased market volatility is gradually increasing.
Summary
Bitcoin's realized market cap has first broken through the $1 trillion mark. This is a unique milestone achievement, highlighting Bitcoin's ample liquidity characteristics and growing importance on the macro international stage.
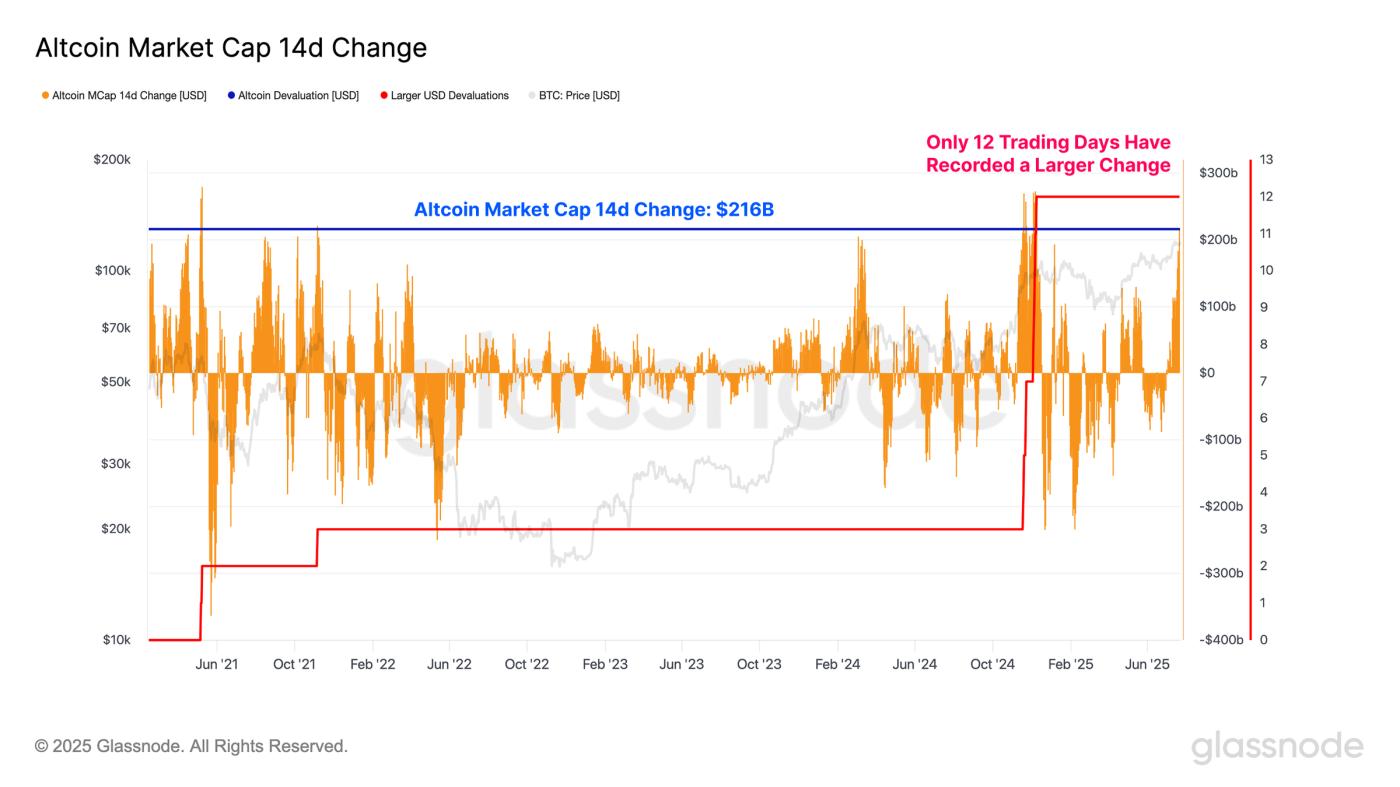
Over the past week, the performance of all Altcoin sectors has been better than Bitcoin, with Ethereum particularly standing out. The total Altcoin market cap increased by $216 billion in the past two weeks.
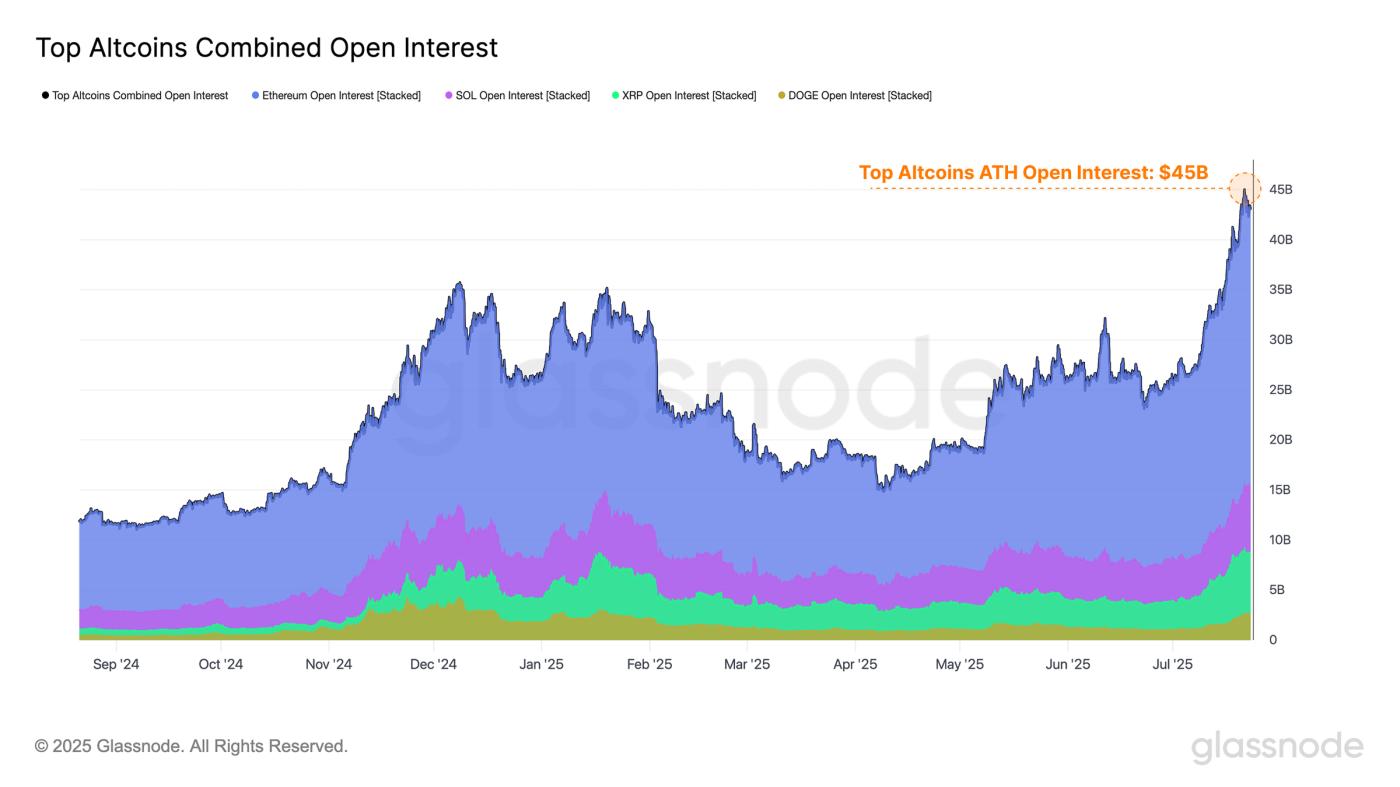
Since July, the open interest of major Altcoins has surged from $26 billion to $44 billion. The rise in leverage levels often amplifies volatility of ups and downs and may lead to a more sensitive and fragile market environment.
Ethereum has strongly broken through multiple key on-chain indicator resistance levels, including active investor price and true market average. However, significant selling pressure is expected around the $4,500 region.
One Trillion Dollars
July was a month of explosive growth for Bitcoin, with its price volatility rising sharply from a weekly low of $105,400 to a new historical high of $122,700. Approaching the weekend, short-term momentum cooled, and Bitcoin's price has been consolidating below the historical high.
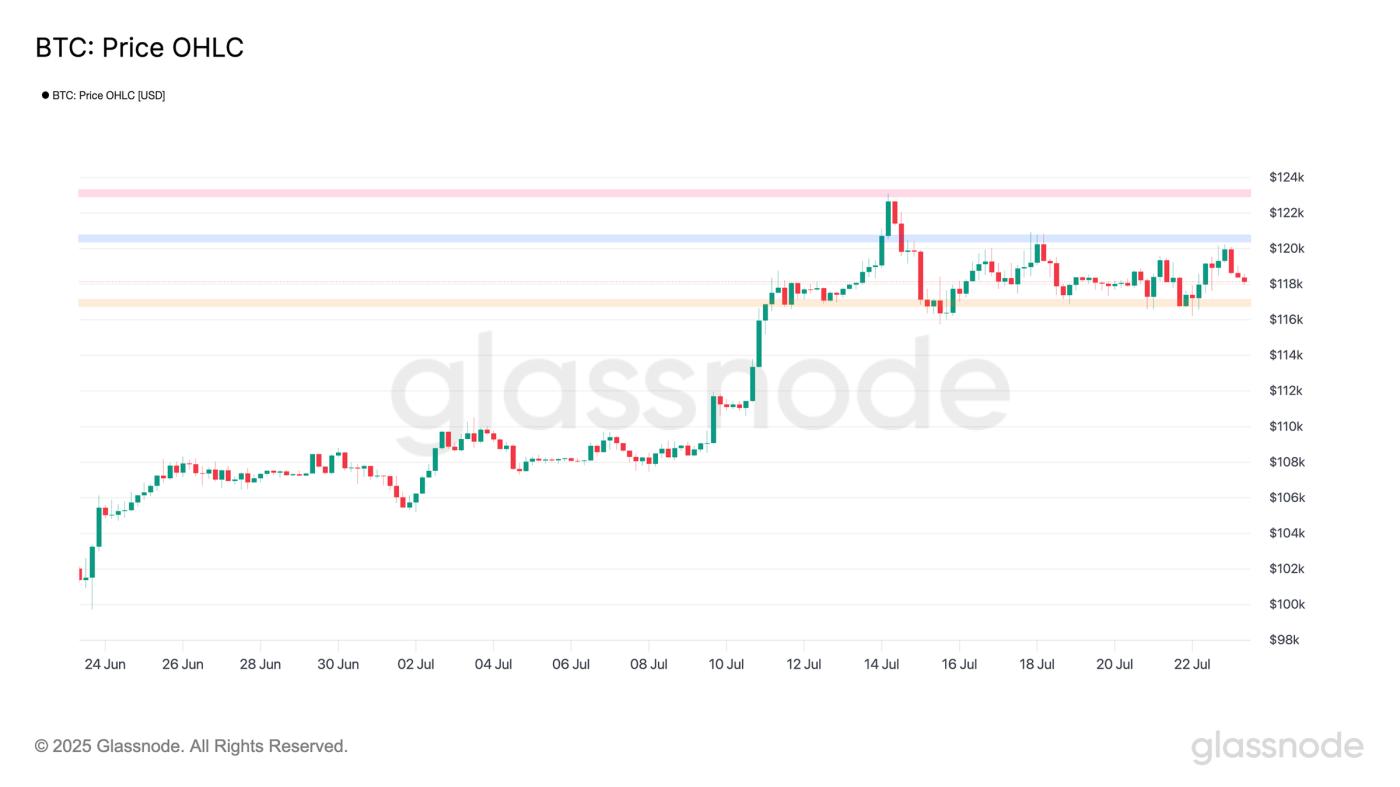
The significant price increase prompted profit-taking by holders while also attracting new buying. This phenomenon is comprehensively tracked through the "realized market cap" indicator, which measures the accumulated dollar liquidity in assets.
Recent capital inflows have pushed Bitcoin's realized market cap to break through $1 trillion for the first time. This is indeed a milestone achievement for Bitcoin, highlighting its deep liquidity characteristics and growing importance on the macro stage. The larger Bitcoin's scale, the more capital it can store, and the larger the scale of transaction settlements.
Altcoin Speculation Heating Up
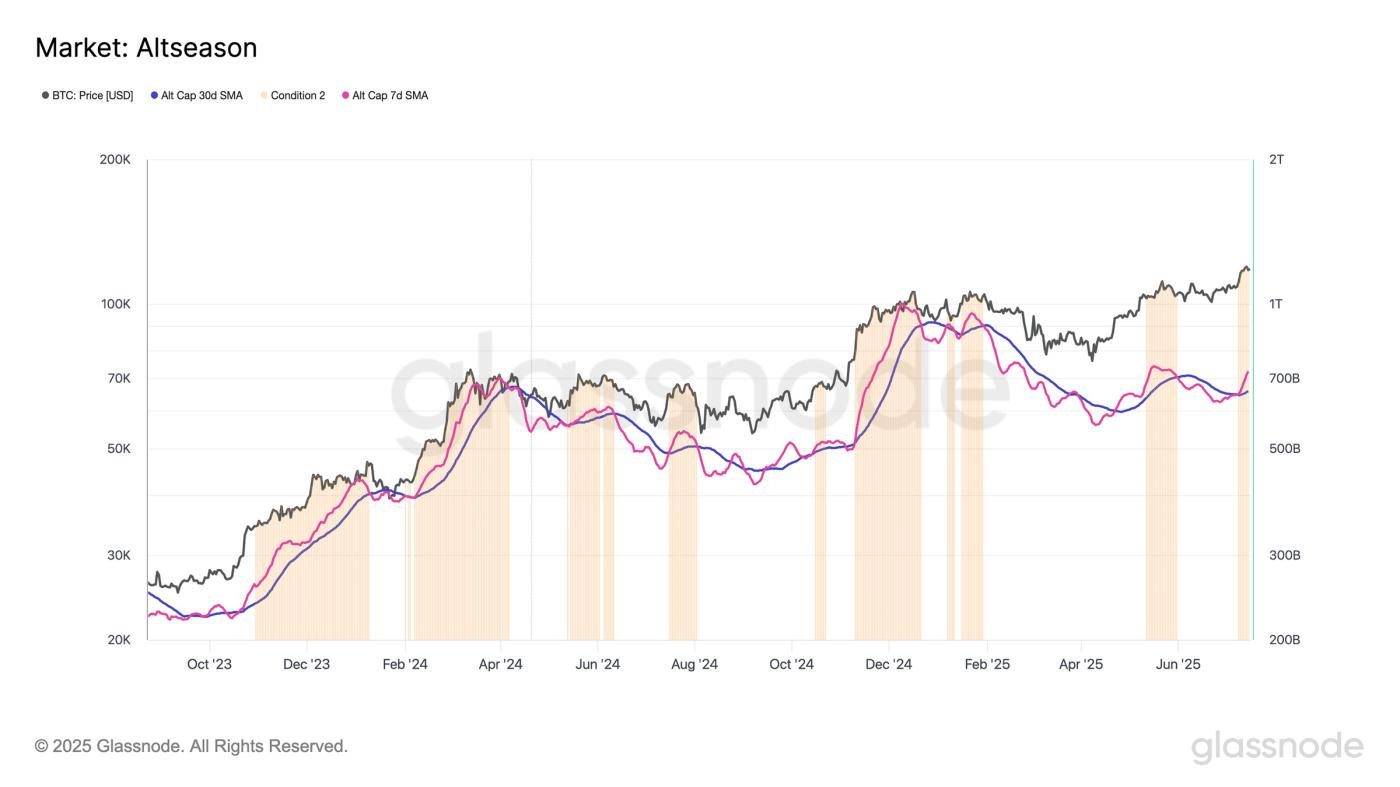
As Bitcoin's market cap continues to expand, we turn our gaze to the broader crypto market to observe its reaction to Bitcoin's recent performance. To assess this, we use the "Altcoin season indicator", which gives a positive signal when the following conditions are met:
- Continuous on-chain fund inflows for Bitcoin and ETH.
- Stablecoin supply is increasing, indicating more off-exchange funds.
- Total Altcoin market cap shows upward momentum through moving average crossovers.
This framework aims to capture the dynamics of fund rotation along the risk curve. As Bitcoin and ETH attract funds and stablecoin liquidity grows, conditions become increasingly favorable for fund rotation into high-risk Altcoins. When this environment coincides with a momentum crossover in total Altcoin market cap, it indicates funds are actively flowing into Altcoins and driving valuation expansion.
From the perspective of this model, Altcoin season conditions first appeared on July 9 and have continued since, indicating funds are being reallocated more broadly in the crypto realm.
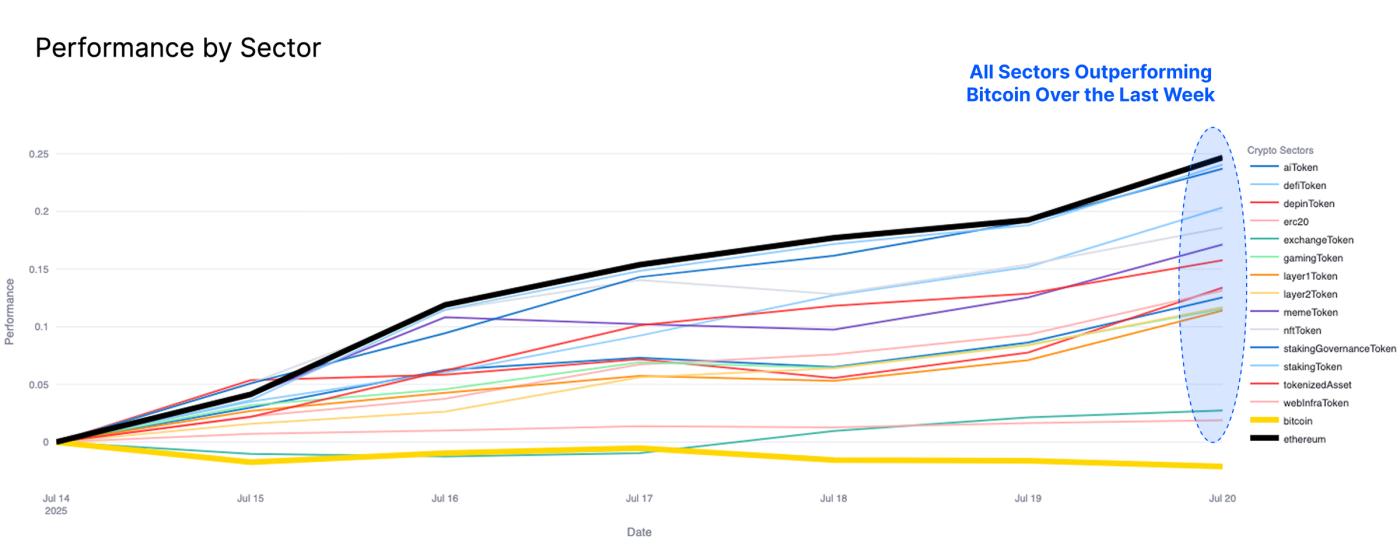
We can verify this observation by analyzing the performance of various digital asset ecosystem sectors over the past week. Bitcoin's recent consolidation is evident, with prices essentially flat over the past week. In contrast, the performance of all other digital asset sectors has been better than Bitcoin, with Ethereum particularly standing out. This mechanism is a typical example of funds rotating along the risk curve.
However, considering Bitcoin's dominance in the ecosystem (over 64%), any sustained weakness in its performance could pose resistance to the Altcoin market, thereby suppressing the momentum of this broad-based rally.
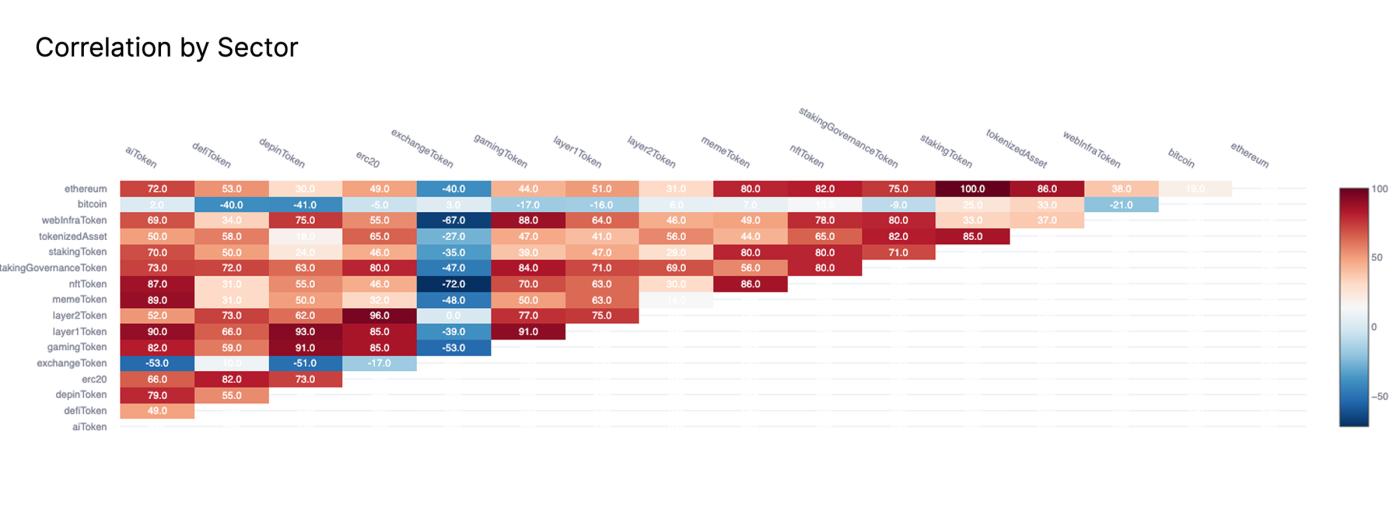
This trend is further confirmed in sector correlation analysis. The trends of almost all Altcoin sectors are now highly synchronized, reflecting a broad market rally that is decoupled from any asset-specific fundamentals.
Meanwhile, the correlation between Altcoin sectors and Bitcoin has significantly decreased, highlighting the increasing price behavior divergence and confirming the recent price trend independence between Bitcoin and the broader Altcoin ecosystem.
The recent change in Altcoin total market cap has been quite significant, with we noting an increase of $216 billion in Altcoin total market cap over the past two weeks. This is one of the largest increases in Altcoin total market cap in dollar terms, further proving the existence of the current Altcoin season impulse.
Derivatives Market Explosion
Having established the significant rise in the Altcoin market, it is necessary to analyze its surrounding derivatives market to further assess current market participants' risk appetite.
The total open interest of major Altcoins (ETH, Solana, XRP, Doge) has dramatically grown from $26 billion in early July to an astonishing $44 billion. The sharp rise in futures leverage reflects a clear acceleration of speculative activity, with traders increasingly opening leveraged positions.
This situation indicates the beginning of a certain degree of bubble formation and may make it more prone to violent fluctuations. The rise in leverage levels often amplifies volatility of ups and downs and may lead to a more sensitive and fragile market environment.
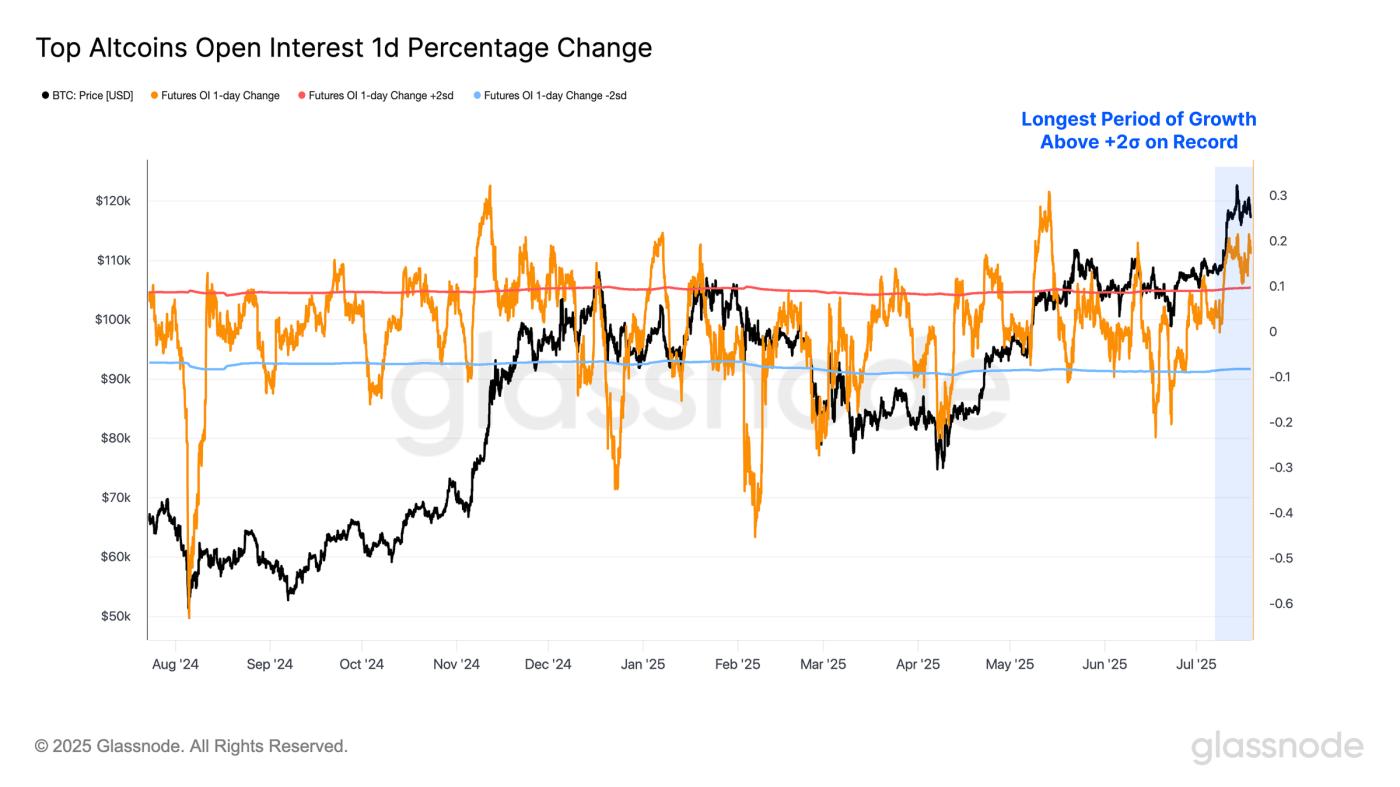
In assessing the magnitude of open interest growth, we found that the daily increase has remained above the +2 standard deviation threshold for over 12 consecutive days, the longest such period on record.
This not only emphasizes the scale of recent open interest expansion but also highlights its persistence, potentially signaling a significant shift in market participants' speculative behavior.
The cumulative funding premium paid by long futures contracts over the past 30 days can serve as a useful indicator of speculative preference. We observed the monthly premium for major Altcoin assets and found that the total cost of leverage has reached about $32.9 million/month.
This figure is comparable to the approximately $42 million/month observed when Bitcoin hit its historical high in March 2024, but still lower than the peak frenzy level of about $70 million/month when Bitcoin first broke through $100,000 in late 2024.
These high funding costs indicate a significant increase in demand for leveraged long exposure, highlighting that market participants are becoming increasingly optimistic and more aggressive in their position layouts.

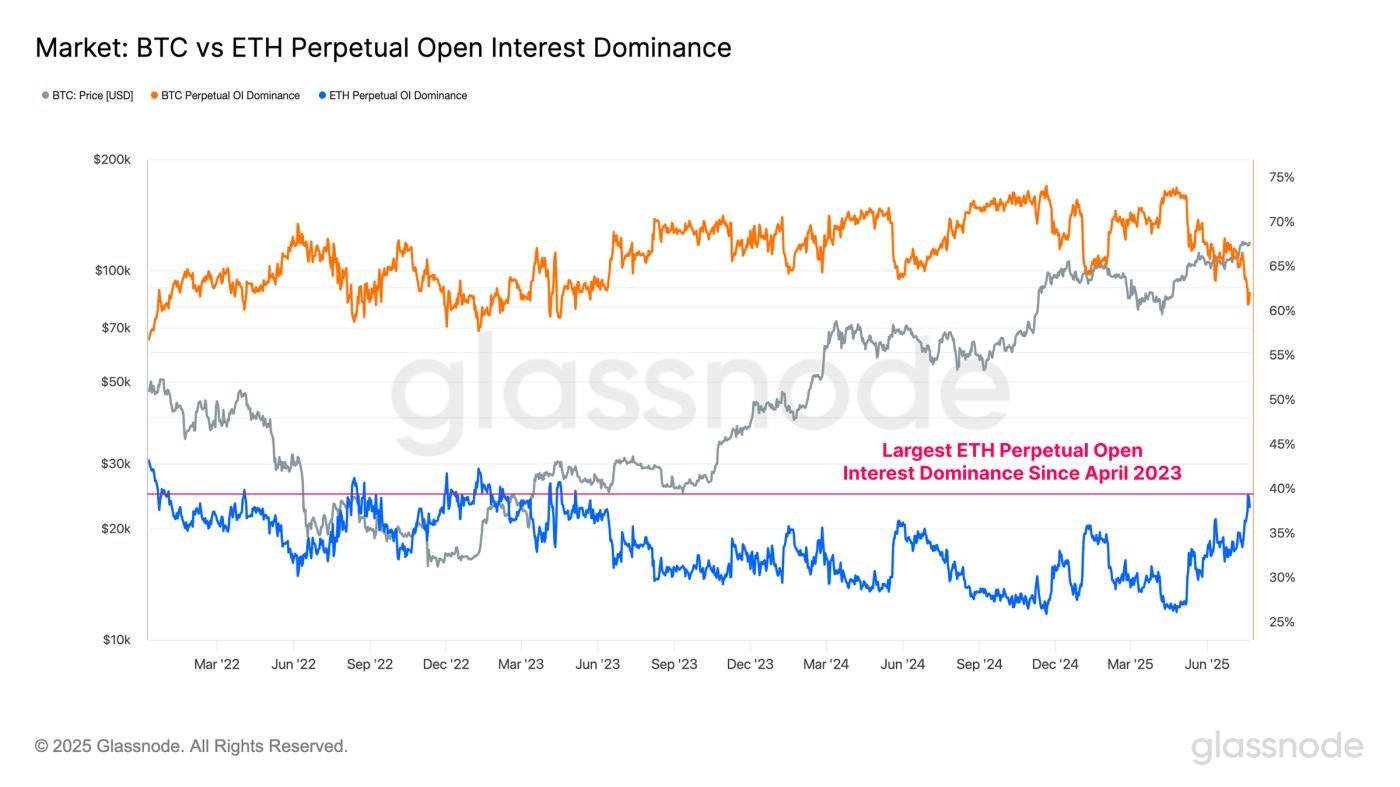
When assessing open interest dominance, it is clear that ETH's leveraged positions are expanding significantly faster than Bitcoin's.
- Bitcoin open interest dominance: 62%
- ETH open interest dominance: 38%
ETH's open interest dominance is rising, highlighting a significant rotation of market focus. Funds and speculative activity are increasingly tilting towards ETH rather than Bitcoin at the margin.
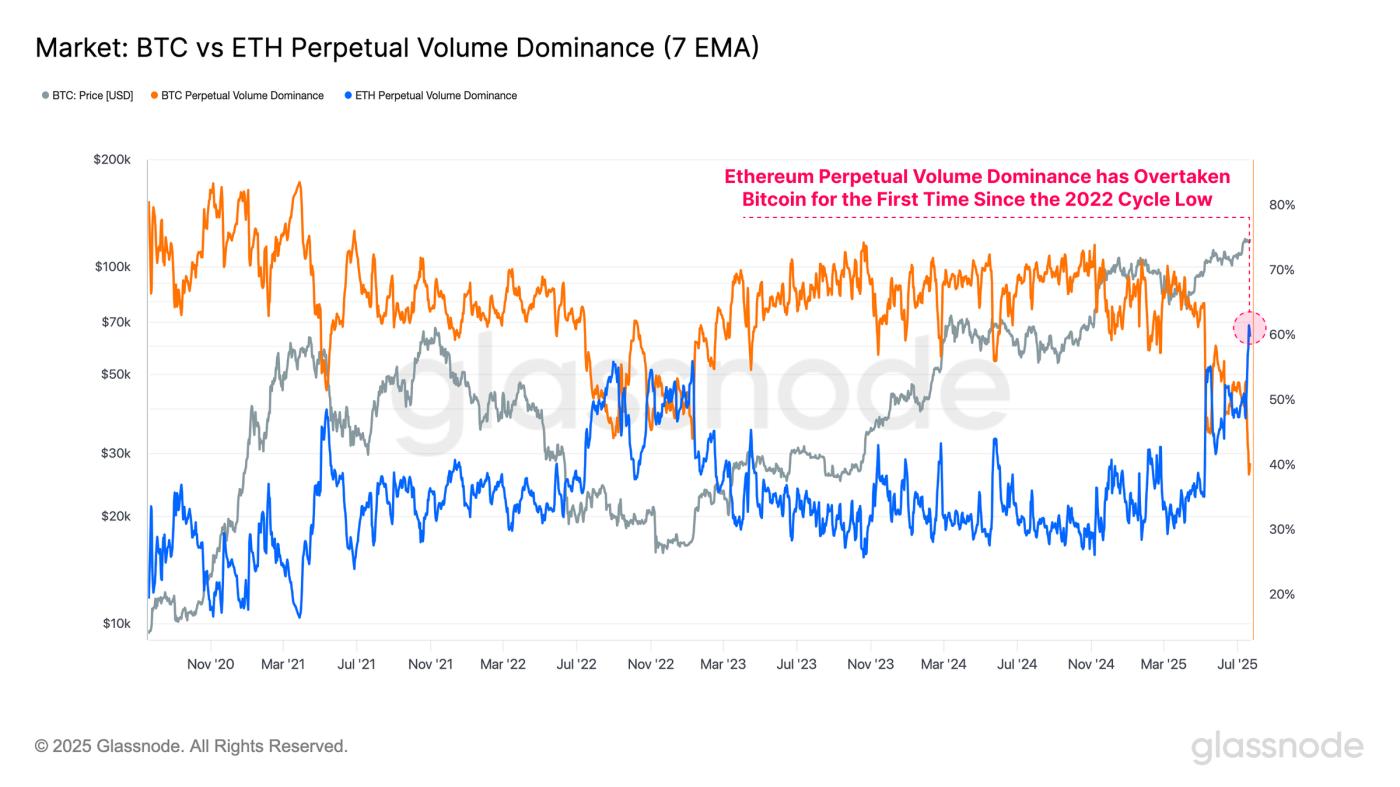
To illustrate the significance of this trend, Ethereum's open interest dominance has now reached its highest level since April 2023, with only 5% of trading days recording higher values, marking it as a notable event and a signal of rising speculative activity.
This trend becomes more apparent when assessing the trading volume dominance between Bitcoin and Ethereum. Interestingly, Ethereum's perpetual contract trading volume dominance has surpassed Bitcoin for the first time since the 2022 cycle low, representing the largest trading volume tilt in Ethereum's recorded history.
Such a significant volume rotation further confirms the scale of capital shifting towards the Altcoin sector, which has struggled to attract speculative interest over the past many months.
Ethereum Market Navigation
As Ethereum's price surges and leads a broader Altcoin rally, we can focus on Ethereum's on-chain data to map out key price levels.
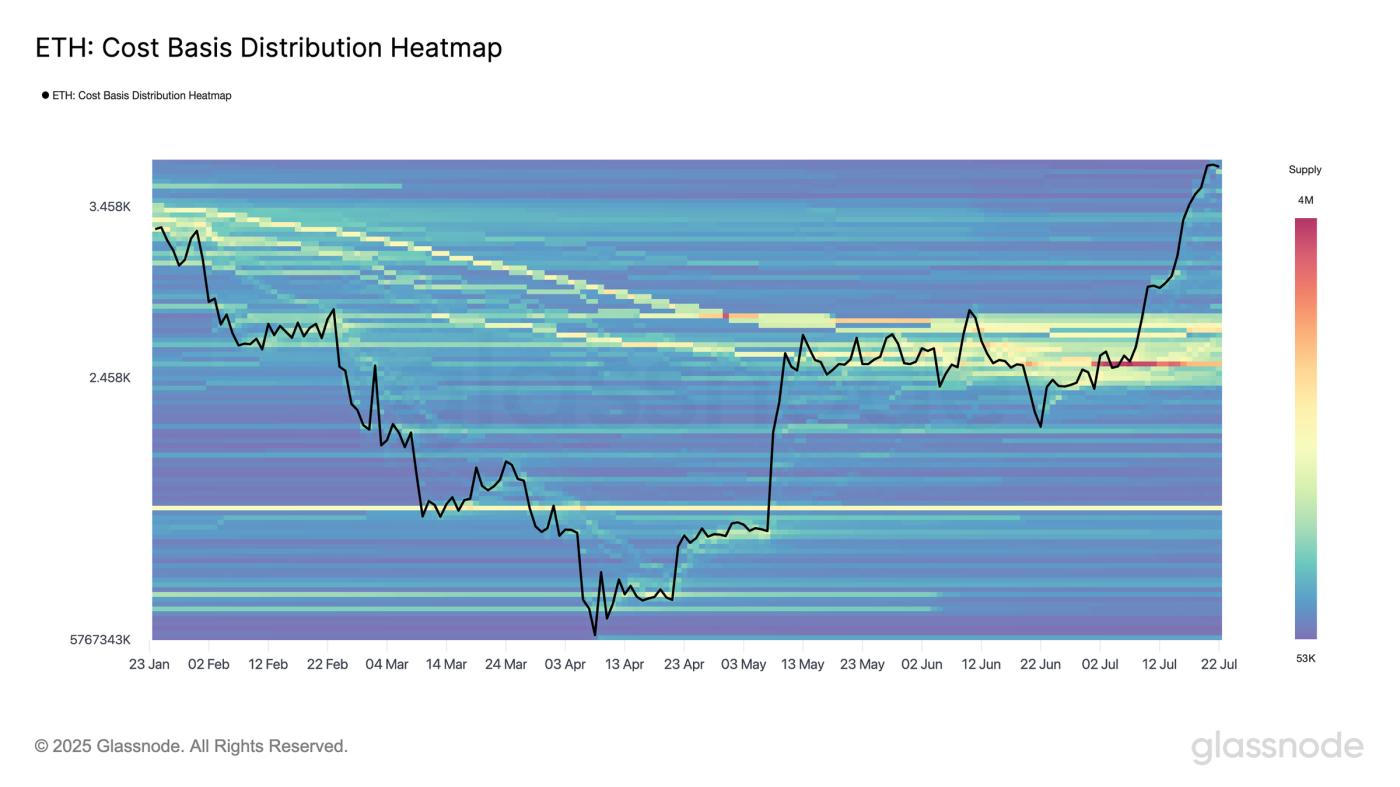
By analyzing Ethereum's cost basis distribution, we notice a significant concentration of investor cost basis in the $2,400 to $2,800 range. The price has decisively broken through this dense supply area and is currently trading at price levels with relatively low holdings.
Investors who last purchased ETH tokens between $2,400 and $2,800 are now beginning to sell, with the $3,800 area becoming a point of profit-taking for many.
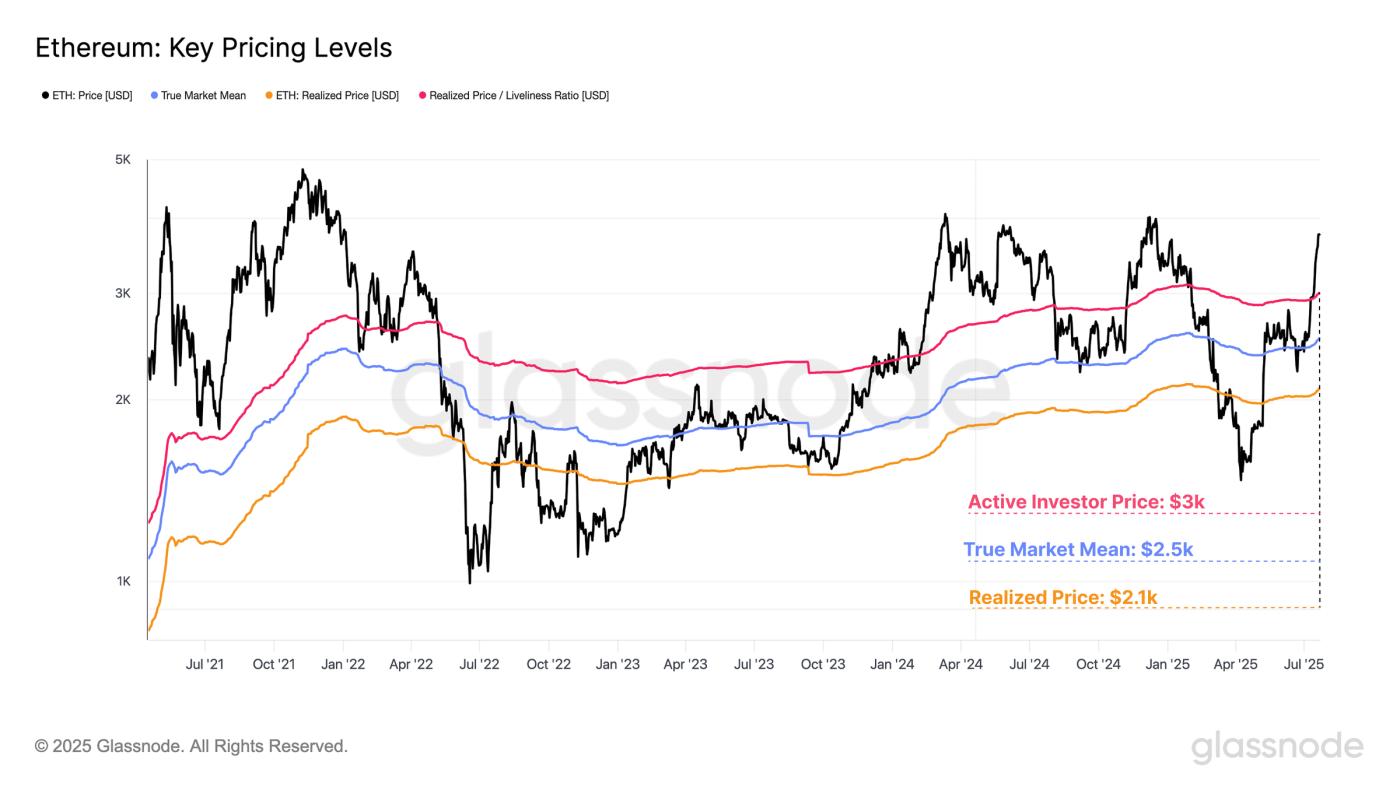
We can find consistency between multiple on-chain valuation models and trading volume distribution data for Ethereum. Specifically, the "True Market Mean" and "Active Realized Price" provide two adjusted cost basis models, excluding long-term dormant and lost tokens. These adjustments offer a clearer picture, comparing the average purchase price of economically active investors with the realized price (average cost basis per ETH unit).
- True Market Mean: $2,500
- Active Realized Price: $3,000
- Realized Price: $2,100
Notably, these valuation anchors align with the dense token distribution observed in the cost basis distribution indicators. This consistency reinforces the observation that Ethereum has broken through an important psychological price range. If the price retraces to this interval, this price range is likely to serve as a significant support level.
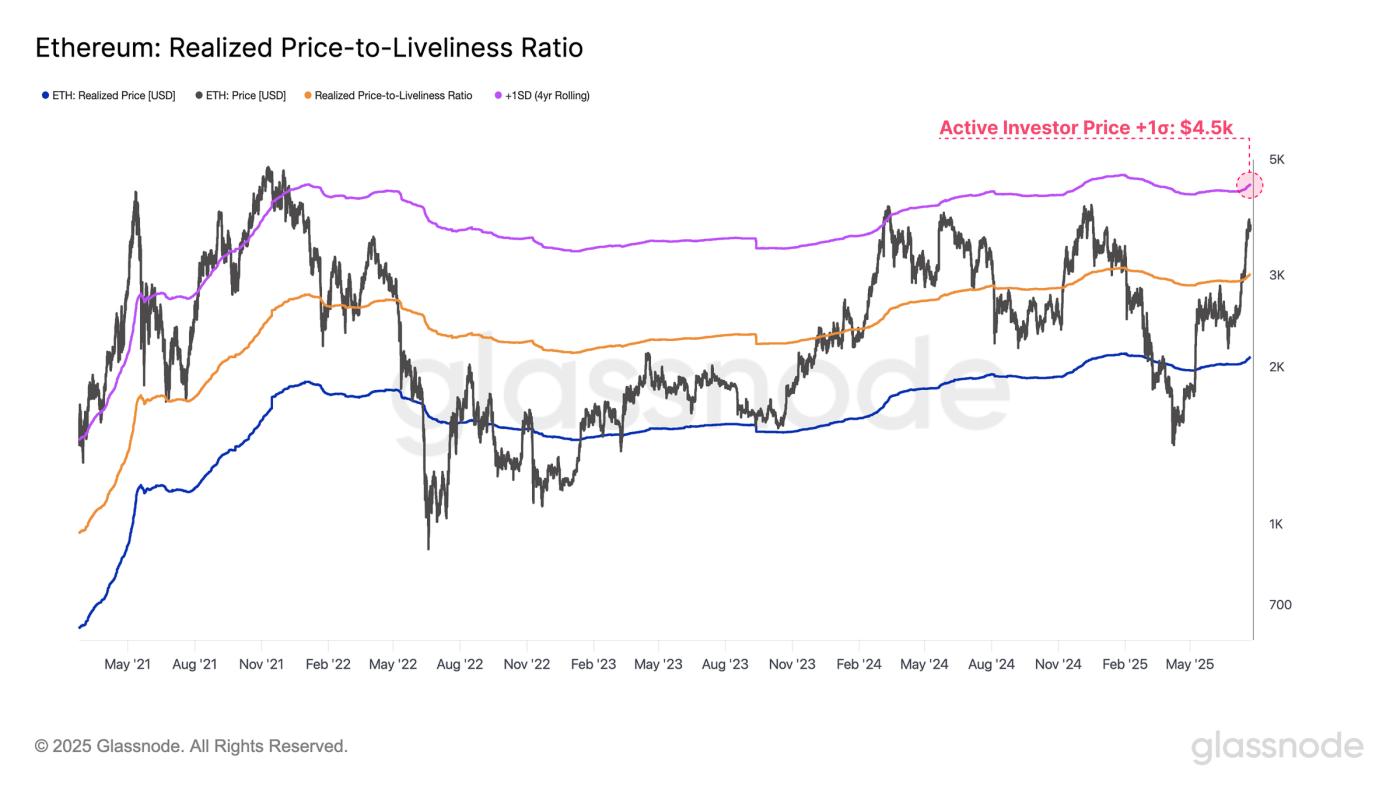
To assess the upward target for Ethereum's current rally, we can reference the +1 standard deviation band of Ethereum's active realized price. This level is the threshold where selling pressure may begin to intensify. Currently, this +1σ level is at $4,500, which would be considered an overheated area under current market conditions.
In the current cycle, this price band has served as a resistance level in March 2024 and during the previous 2020-21 cycle. Breaking this threshold often coincides with market euphoria and unsustainable market structures.
Therefore, $4,500 can be viewed as a critical level to watch during the upward movement, especially as Ethereum's upward trend continues and speculative bubbles further expand.
Summary and Conclusion
The Altcoin sector has generally performed poorly throughout the cycle, and the recent surge marks a significant shift in investor behavior. This is particularly evident in the perpetual futures market, where Ethereum's perpetual contract dominance has reached a historical high, surpassing Bitcoin for the first time since the 2022 cycle low.
The surge in market attention has spread to the derivatives market, with the total open interest for major Altcoins (ETH, SOL, XRP, DOGE) rising from $26 billion to $44 billion in July. This rapid growth indicates that speculative positions are accelerating, and market bubble levels are increasing. High leverage can both amplify gains and exacerbate losses, introducing greater reflexivity and making the market more susceptible to volatility shocks.