Ethereum ’s popularity continues to rise, but has the real bull market just begun?
Mike Nadeau from DeFi Report joins us for a deep dive into Ethereum’s Q2 fundamentals and shares 10 of the most bullish charts from his latest report.
We’ll explore why institutional demand could be a key driver of this rally, how ETF flows and treasury holdings could accelerate this trend, and whether Ethereum remains undervalued despite its recent gains.
Additionally, we’ll delve into the Genius Bill, the growth trends of stablecoins, real-world assets on-chain, and key on-chain metrics that could drive Ethereum’s next bull run.
Summary of highlights
- Bitcoin funds are gradually flowing into the early rotation stage of Ethereum, and this trend may continue for a longer time and have more far-reaching effects.
- With the support of the Genius Bill, all major banks will also launch their own stablecoin strategies.
- The market's trust and confidence in Ethereum is growing.
- The current asset size on Ethereum has reached $7.5 billion, and this figure is expected to show explosive growth in the future. Stablecoins and stocks that may be listed on the chain at some point in the future will be the main driving force for this growth.
- The crypto market is highly reflexive, and sometimes the key factor driving market development is actually the price of ETH itself. The rise in ETH prices will attract more assets to the chain, more users to enter the chain ecosystem, and other fundamental factors will also improve accordingly.
- Key data: Active loans on Ethereum increased by 98%; the annual growth rate of RWA on the chain has reached 200%; the asset management scale on the Ethereum chain has reached an all-time high; the ETH balance on CEX is at an all-time low
Introduction
Ryan:
The price of Ethereum is rising, and today we are sharing 10 of the most bullish Ethereum charts. Today, we have Mike Nadeau, who just released the Q2 Ethereum Quarterly Report. We have selected five of the most bullish charts and will discuss them in detail.
The current price of Ethereum is $3,225. Although this price is still far below its all-time high, I would also like to remind you that it is also lower than the $4,100 in December last year. But Ethereum has indeed shown good upward momentum recently.
Do you think this momentum can be explained by the fundamental data in Q2? Are you optimistic about the market?
Mike:
I think so. I hope so. We just had our earnings call yesterday. Today, I want to highlight some key points. In the call, we mainly provide data rather than share opinions. Today, we will explore the meaning behind these data in a deeper way and try to do some forward-looking analysis.
Ryan:
There were a lot of interesting things that happened this week. I think the national debt issue became particularly tense this week. But at the same time, we saw Ethereum rise on days when Bitcoin was falling. This happened a few times this week, and it's something I haven't seen in a long time. I can't even remember it happening again in this cycle. While there are occasional days when Bitcoin is up a little bit and Ethereum is up more, it's not common. And there was one day this week, maybe yesterday, Monday, or Tuesday, when Bitcoin was down 2% in 24 hours and Ethereum was up about 4%. This is very rare.
Mike:
This is a pretty significant shift, and it's exactly what I've been watching for. I was probably one of the early ones to notice this, and a lot of people predicted this shift in the Ethereum to Bitcoin price ratio (EBTC ratio) early on, but it really feels like we've hit the bottom. As you said, we're at a five-year low. I've never seen Bitcoin go down and Ethereum go up 4% or 5% before. So, to me, this is exactly what I've been waiting for. This seems to be an early rotation of Bitcoin money into Ethereum, and this trend may continue for longer and have more far-reaching consequences.
Peter Thiel buys 9.1% stake in Tom Lee's ETH Treasury
Ryan:
Interestingly, institutions seem to be leading this trend, or institutional inflows may be driving the rise in Ethereum prices. I saw a news yesterday that Peter Thiel recently purchased a 9.1% stake in Tom Lee's East Treasury. As you may know, the stock code of this company is MNR, which is actually an Ethereum treasury. Peter Thiel disclosed that he holds about 9% of the shares. I think this has an important impact on the current market momentum. Therefore, we will discuss some of the most bullish charts today. These charts may be one of the most representative things to pick out from your ETH Q2 report. In addition, there are some other charts worth paying attention to in the report, such as data such as declining revenue, lower fees, and rising L2 usage. It is recommended that you check these charts to get a comprehensive understanding of Ethereum's overall performance.
Institutional adoption of stablecoins
Ryan:
Let's talk about the trend of institutional adoption of stablecoins through some charts. I think the story has to start with stablecoins. Tom Lee likened stablecoins to the ChatGPT moment in the cryptocurrency field, and he talked about this topic almost every day on CNBC. When you look at the stablecoin supply chart of Ethereum, what do you see? This is the first chart we analyze Ethereum today.
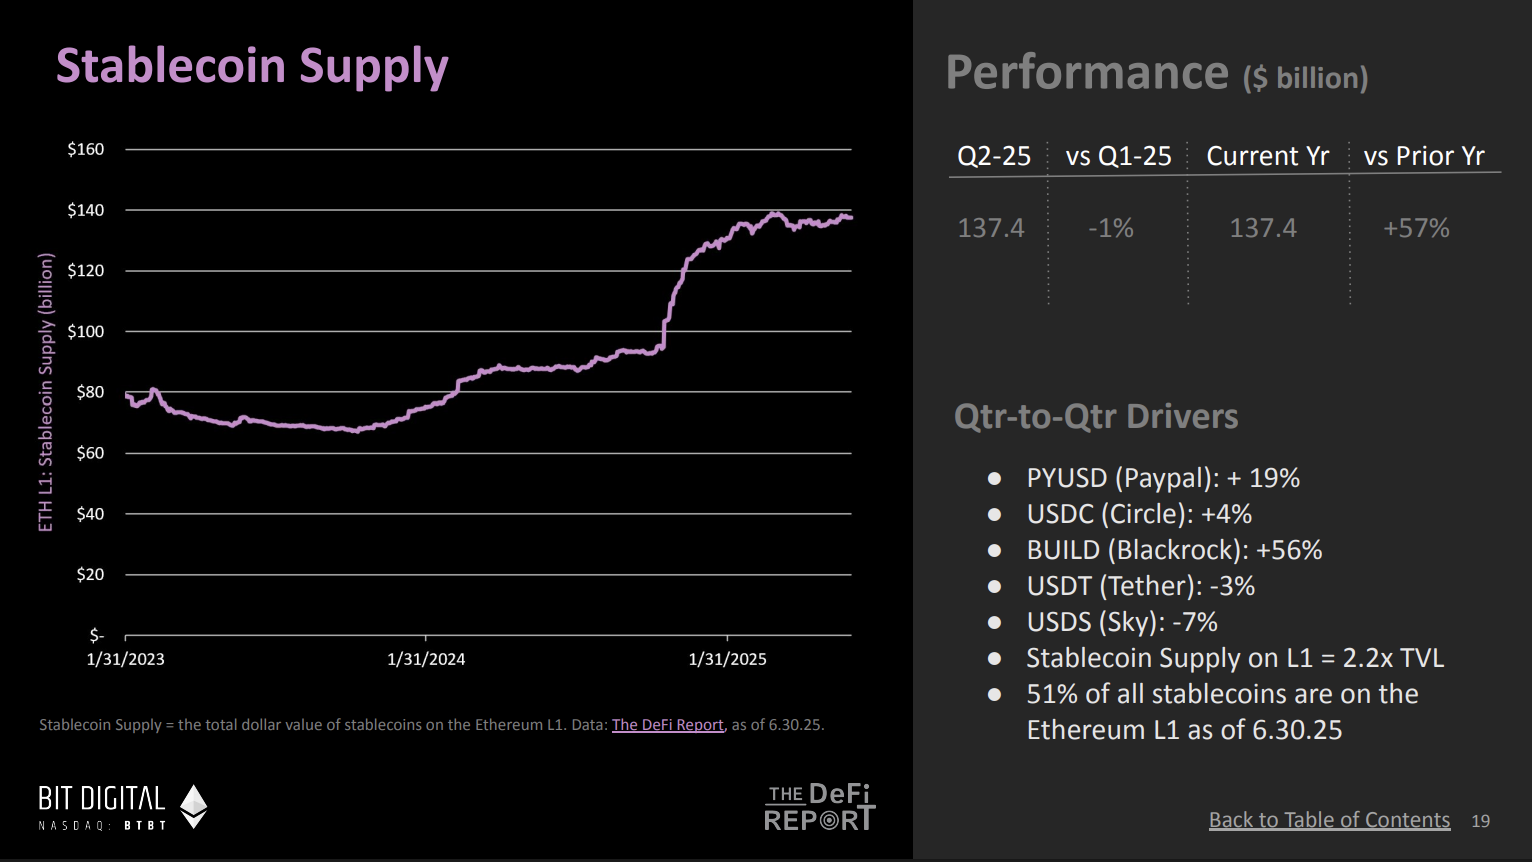
(Chart taken from The ETH Report – DeFi Report )
Mike:
Yes, it was refreshing to see Tom Lee speak publicly about stablecoins on CNBC. He is very well respected in the financial community and believes that stablecoins are a critical moment for cryptocurrencies. I think it is an important part of the Ethereum ecosystem.
We are seeing a 95% chance of passing the Genius Bill related to stablecoins this year. The general consensus is that the bill will pass this summer. This would be a major milestone for Ethereum and the entire cryptocurrency market.
The concept of stablecoins is easy to understand. Anyone familiar with the crypto space knows the potential of stablecoins, and their impact is gradually coming to the public. I am currently writing a report analyzing the possible impact of this bill and what it means for fintech companies. We have seen that almost all fintech companies will soon launch their own stablecoins, and the banking industry may also take the lead in launching their own stablecoins. This will have a profound impact on e-commerce payments and global financial inclusion. Bitcoin was originally considered a tool to achieve these goals, but I believe that stablecoins are the best solution to achieve financial inclusion. Last year I spent five weeks in Buenos Aires, Argentina. In the United States, people may not understand the need for stablecoins because the inflation rate here is low. But in Argentina, stablecoins have become an indispensable part of people's daily life.
I think this is a huge opportunity. From the chart, the supply of stablecoins shows a long-term growth trend. Although it has stabilized in the second quarter, I expect this trend to grow rapidly with the passage of the Genius Bill.
Ryan:
According to the chart, by the end of the second quarter, the supply of stablecoins on Ethereum had reached about $140 billion. This number already accounts for the source of most stablecoin supply, and you also predict that this number will increase further.
Regarding the Genius Bill, Trump called it "Crypto Week". I think they hope to pass and promote this bill within this week. Although Congress encountered some resistance earlier, Trump is working hard to convince the remaining opponents in the party to ensure the smooth passage of the bill. Therefore, this bill may not only pass in the summer, but also be completed as legislation within this week. If passed, this will further promote the growth of stablecoin supply on Ethereum. I also saw a news last night that Jamie Dimon, who is well known for not supporting cryptocurrencies, also said that even JP Morgan is considering doubling down on stablecoins. Jamie Dimon's original words were: "I don't quite understand the purpose of people using these things, but we will make a big move in this field." Similar statements. Now we have seen PayPal, Circle, BlackRock, and crypto-native companies like Tether actively promote the development of stablecoins. I think with the support of the Genius Bill, all major banks will also launch their own stablecoin strategies.
Mike:
Totally agree. I expect Stripe to also launch its own stablecoin. With this bill, I think another area worth watching is payroll. How do you get everyone to have a crypto wallet and start using stablecoins? I think there needs to be some kind of enforcement mechanism to make that happen. Payroll could be that mechanism. If you can speed up the payment process and get away from the traditional weekly or biweekly payroll model, I think that would be an important breakthrough.
We can observe changes in this area in the next one to two years. But stablecoins must be put into everyone's hands and circulated on the blockchain. I believe this will significantly increase economic activity on the Ethereum chain. Currently, 51% of the stablecoins in the crypto market are on the Ethereum main chain (L1), and there are another 4% to 5% on the second layer network (L2). Therefore, overall, about 55% of stablecoins are in the Ethereum ecosystem. This is a critical moment, and we even see major retailers such as Walmart discussing the launch of stablecoins. Such trends show that stablecoins have great potential for development, and Genius Bill may become a catalyst for this trend. Looking back at the previous cycle in 2021, a bill related to stablecoins passed the OCC's review, and Ethereum subsequently ushered in a bull market. Therefore, Genius Bill may once again become a key factor in driving the market.
Active loans on Ethereum increased by 98%
Ryan:
I guess when institutions deploy stablecoins, they may also choose to buy Ethereum (ETH) as part of their strategy to deploy in the Ethereum ecosystem. This is a chart reflecting the activity of Ethereum and its L2 network, which is worth paying attention to. This chart shows the active loan data on Ethereum, and this number has reached an all-time high. So, what is the significance of this?
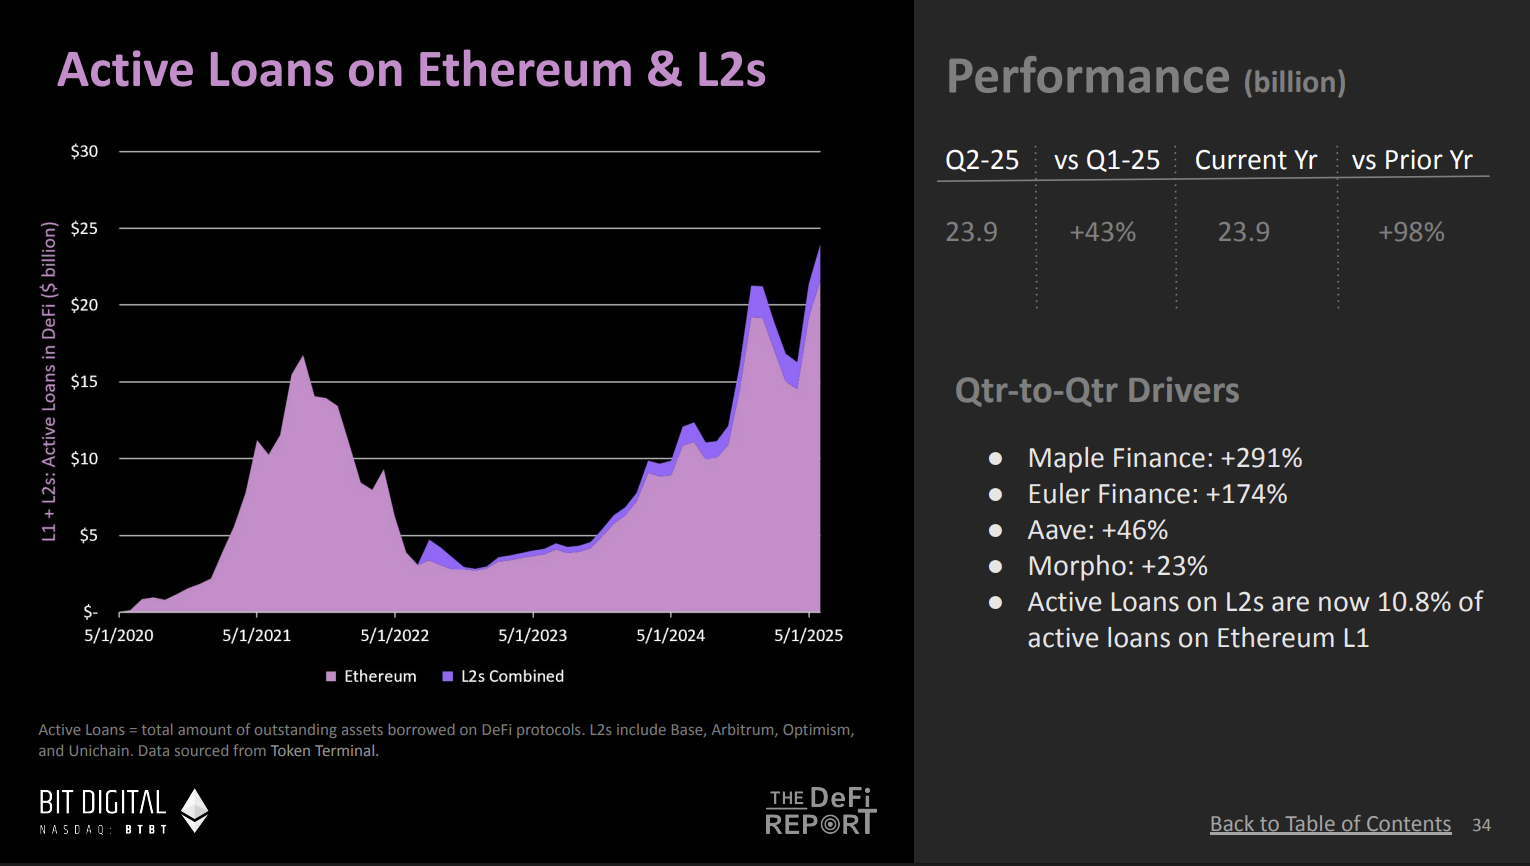
(Chart taken from The ETH Report – DeFi Report)
Mike:
This is very important because it shows that the market's trust and confidence in Ethereum is growing. We also see that the staking rate of Ethereum has reached an all-time high, accounting for an increasing percentage of the circulating supply. This not only shows the market's confidence in the Ethereum protocol itself, but also shows that users are increasingly interested in lending and accessing decentralized finance (DeFi). At the same time, we may also observe more re-hypothecation cycles, which refers to the process of increasing leverage by reusing collateral, which means that the activity in the Ethereum ecosystem is increasing significantly.
To me, this chart is a sign that the market demand for access to DeFi, using collateral and taking the corresponding risks is rising. From the chart, this reflects the overall trend of the past five years, and the current active loan data has broken through the historical high point of the previous cycle. I expect that this number may continue to climb during this cycle.
Ryan:
Active loans on Ethereum have grown 98% compared to last year. I think the importance of this growth is also that it is closely related to the treasury strategy of institutions. Billions of dollars are currently driving competition among several listed treasury companies to compete for more Ethereum assets. It's not just the scale of billions of dollars. I think many of these companies are actively deploying ETH as a productive asset to Ethereum and its broader ecosystem. This trend may bring about the "late boom effect" of the DeFi market, that is, with the massive influx of institutional funds, the DeFi market will usher in a rapid development stage. Imagine these treasury companies, they are actually like actively managed funds, and where do their income come from? First of all, staking is a low-risk way to earn income, but in addition to staking, they may also use some decentralized lending protocols, such as platforms such as Aave. Therefore, I think this is a very worthy story to watch.
The annual growth rate of on-chain RWA has reached 200%
Ryan:
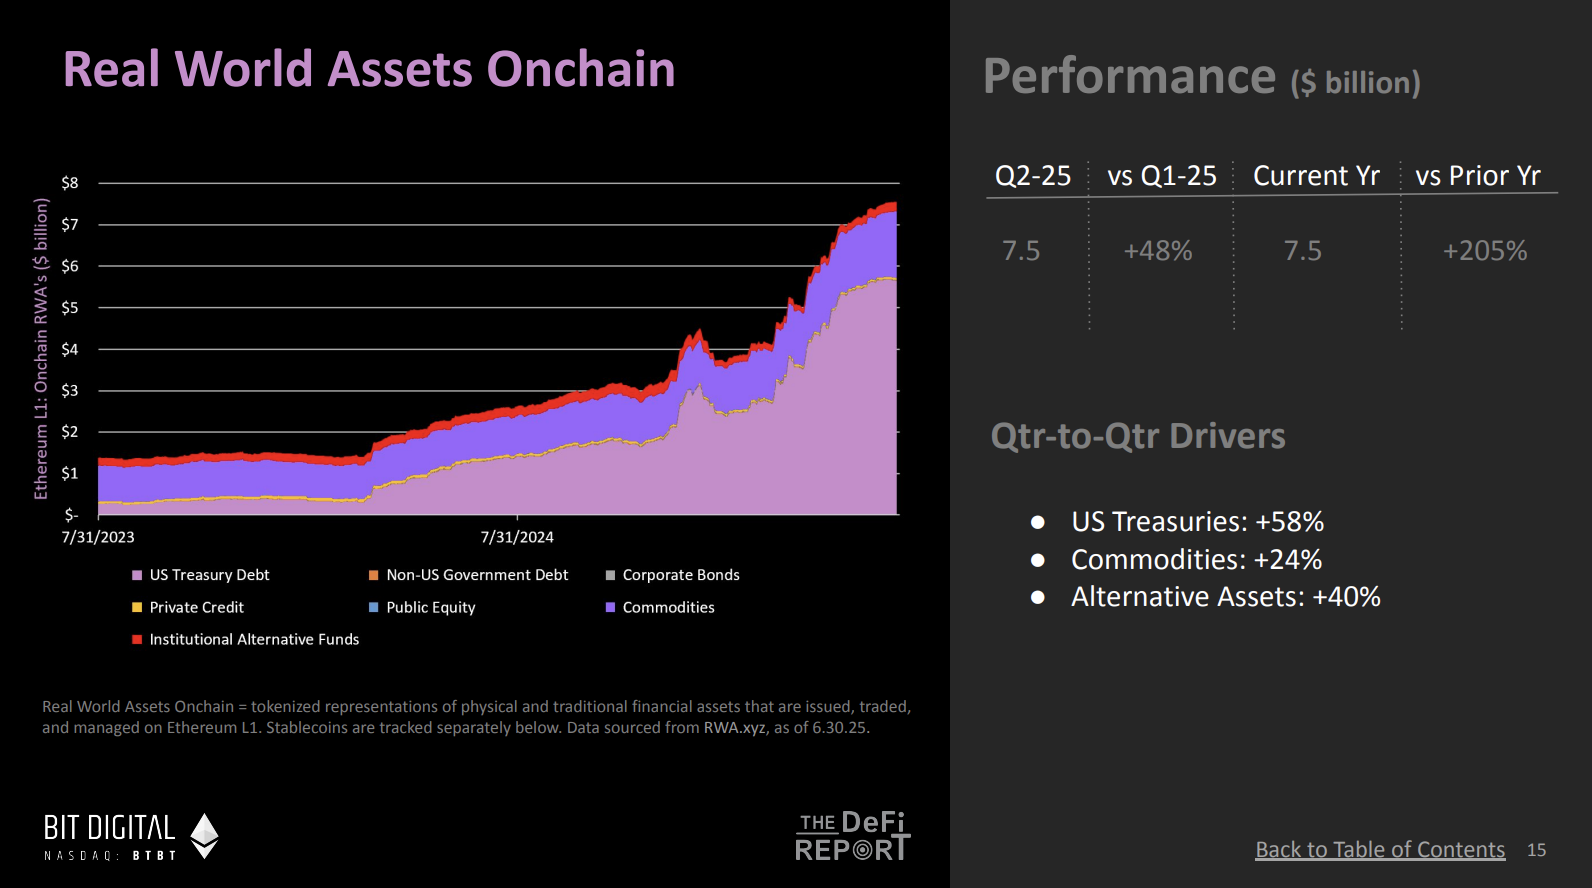
Real-world assets on the chain are another important part of Ethereum's institutional development. We have observed that the growth of these assets has shown a hockey stick-shaped trend since last year, with a very significant growth rate. Currently, the annual growth rate of real-world assets on Ethereum has reached 205%. What do you think this phenomenon reflects?
(Chart taken from The ETH Report – DeFi Report)
Mike:
This chart is very meaningful, it shows that more and more assets are migrating to Ethereum. The current asset size on Ethereum has reached 7.5 billion US dollars, and this number is expected to show explosive growth in the future. In my opinion, stablecoins and stocks that may be on the chain at some point in the future will be the main drivers of this growth. It is worth noting that companies like Robinhood have already begun to build related work in the Ethereum ecosystem.
Putting assets on-chain is a critical first step in driving this trend, and making these assets liquid on-chain is an even more important next step. If we can successfully put more real-world assets on-chain, this will further promote the development of active lending and decentralized finance (DeFi). As more assets and collateral enter DeFi, users will be able to use these on-chain assets to optimize the use of funds, thereby improving capital efficiency and promoting the prosperity of the entire ecosystem.
I think there is a feedback loop phenomenon here: as more assets are added to the chain, more funds flow into DeFi , and more assets are used as collateral, which will lead to changes in gas fees and further affect Ethereum's destruction mechanism. The destruction mechanism reduces the supply of Ethereum by burning part of the transaction fees, thereby optimizing the entire ecosystem. Ultimately, this cycle will drive the rapid development of the entire ecosystem.
The crypto market is highly reflexive, and sometimes the key factor driving the market is actually the price of ETH itself. Rising ETH prices will attract more assets to the chain, more users to the chain ecosystem, and other fundamental factors will also improve. This phenomenon is exactly the opposite of how traditional finance works, where fundamentals usually come first and then assets move. This is the trend I expect, especially observing the price trend of ETH over the past month and its positive impact on fundamentals.
Ryan:
What is interesting about real-world assets is how big they can grow on Ethereum. We are still in the very early stages, and while this growth is worth celebrating, it is still tiny compared to the size of all real-world assets, from almost 0%. Think about the markets for treasuries, stocks, etc. The total size of these assets may be tens of trillions of dollars, and Ethereum's potential in this area has just begun to emerge.
Ethereum’s assets under management have reached an all-time high
Ryan:
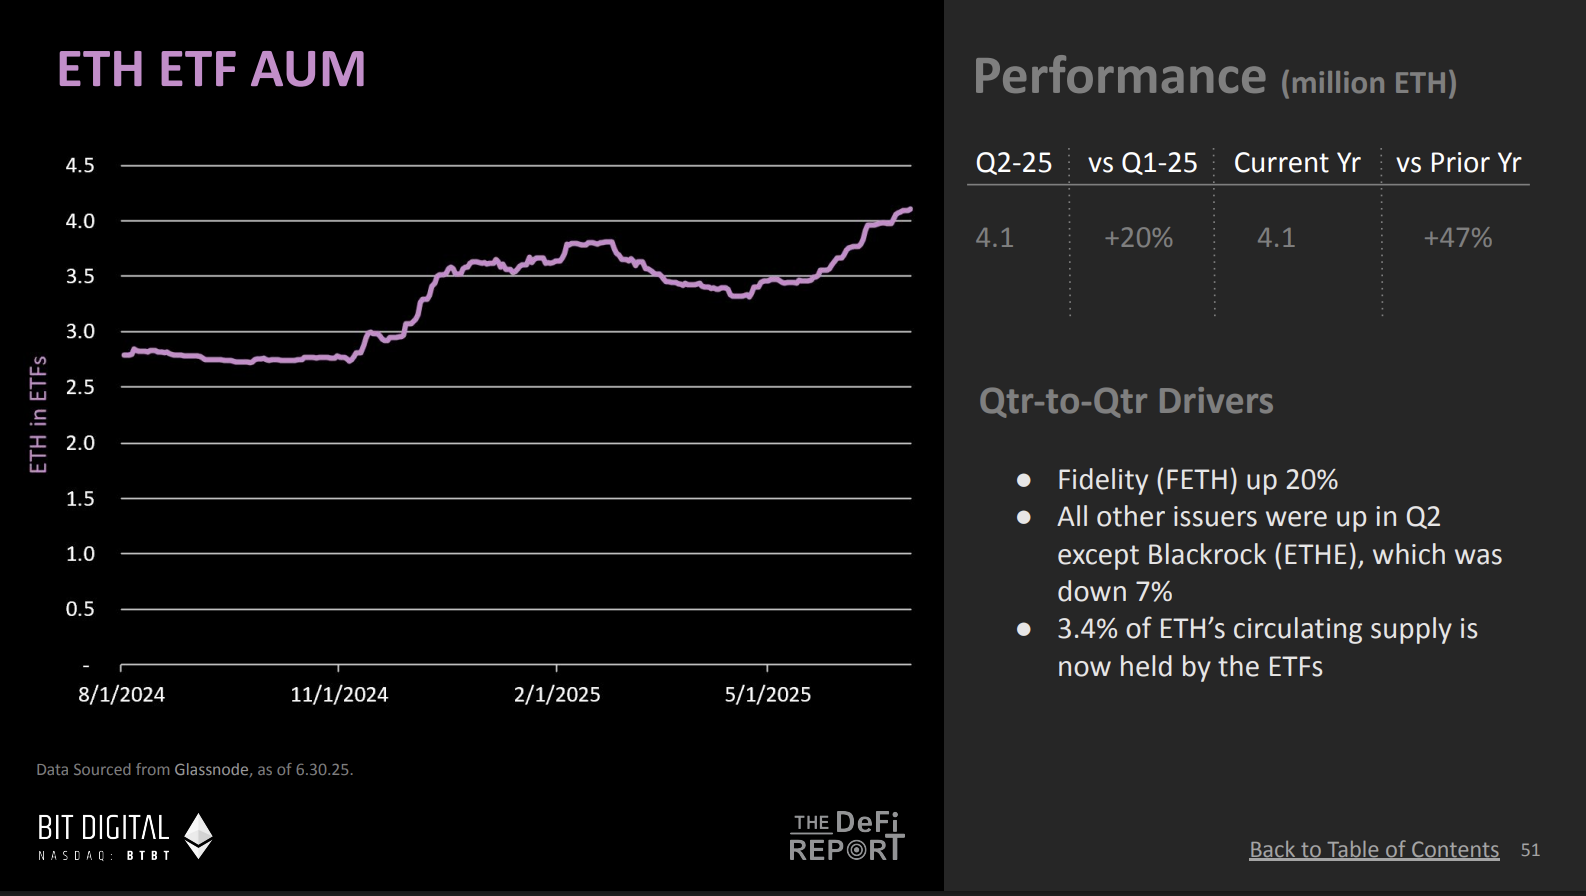
We have analyzed the first three charts that reflect the bullish trend, and now we will look at the fourth chart. It shows the assets under management of Ethereum. Recently, we have observed that the inflow of funds to Ethereum is very strong. In fact, at the end of the quarter, the assets under management of Ethereum reached an all-time high, right?
(Chart taken from The ETH Report – DeFi Report)
Mike:
That’s right, these data are as of June 30, and the latest data shows that Ethereum’s managed assets have reached 4.11 million ETH, accounting for 3.4% of the total supply. Two weeks later, this ratio further increased to 3.8%, and the total amount of ETH held in the ETF has now reached 4.6 million.
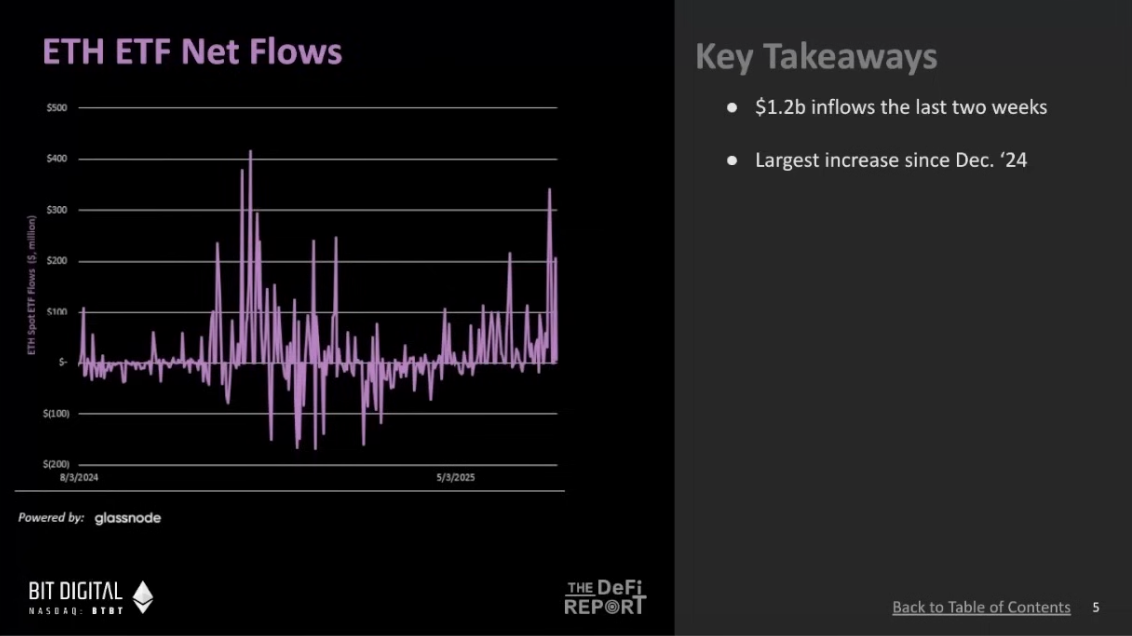
The ETF has performed very well. I have some data to illustrate this. Since the inception of the ETF, Ethereum has had net inflows of $5.7 billion, which is equivalent to 20% of the inflows of Bitcoin. Bitcoin's net inflows are $50 billion. Many people are optimistic about the performance of the Bitcoin ETF, believing that inflows will reach 5 billion to 10 billion in the first year, and Ethereum has exceeded this expectation. Currently, the total asset size of Ethereum has reached 4.6 million ETH, which is equivalent to about $13 billion. In recent weeks, the scale of fund inflows has increased by another $1.2 billion. Judging from the net inflow trend chart, our fund inflows are close to the level of the fourth quarter of last year. The performance of the ETF is indeed impressive.
(Chart taken from The ETH Report – DeFi Report)
Ryan:
It looks like institutional investors’ interest in Ethereum is growing rapidly. Tom Lee once said that Ethereum could be “the next Bitcoin” and he tried to prove this possibility. What would it be like if the pattern of inflows into Bitcoin ETFs could be replicated in Ethereum?
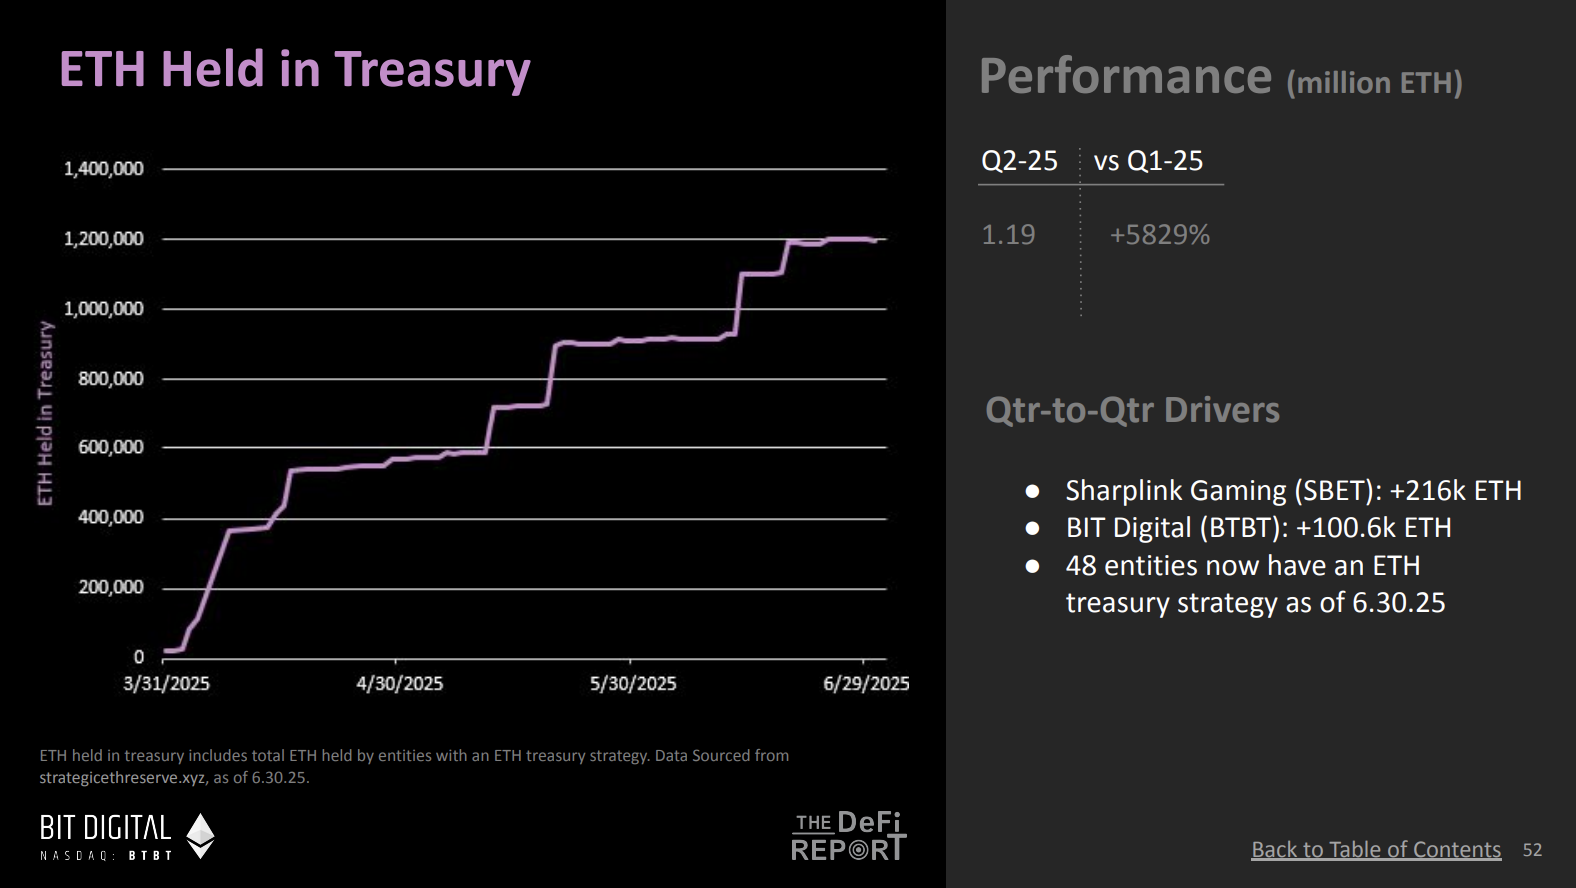
This is a new trend in Q2, but one that has continued to gain momentum in Q3 is the amount of Ethereum held in treasuries. If I understand correctly, this portion of holdings has grown by almost 6,000%. Most of these are public treasuries, and investors can buy these assets through the US capital markets.
(Chart taken from The ETH Report – DeFi Report)
Mike:
This trend has obviously gained more attention with Tom Lee's promotion. For example, Bit Digital accumulated about 100,000 ETH and sold all their Bitcoin at the same time. This is a very interesting phenomenon. You can also see Joe Lubin talking about Ethereum on CNBC, basically promoting this token.
This is very important. I don't think this is widely discussed. Bitcoin has done a better job of this, with people like Michael Saylor telling the Bitcoin story almost every day on TV and podcasts, while also continuing to buy assets. And now, we are seeing similar actions from the Ethereum community. This market change cannot be ignored, and I think it is another bullish signal.
Ryan:
I think this shift shows that Ethereum is trying to cross the hurdle and become a store of value asset similar to Bitcoin. It took Bitcoin more than a decade to break through this limit. Finally, this transition was basically completed in 2020 when Michael Saylor began to buy Bitcoin on a large scale and convinced others. So maybe Ethereum is going through a similar process.
(Chart taken from The ETH Report – DeFi Report)
Mike:
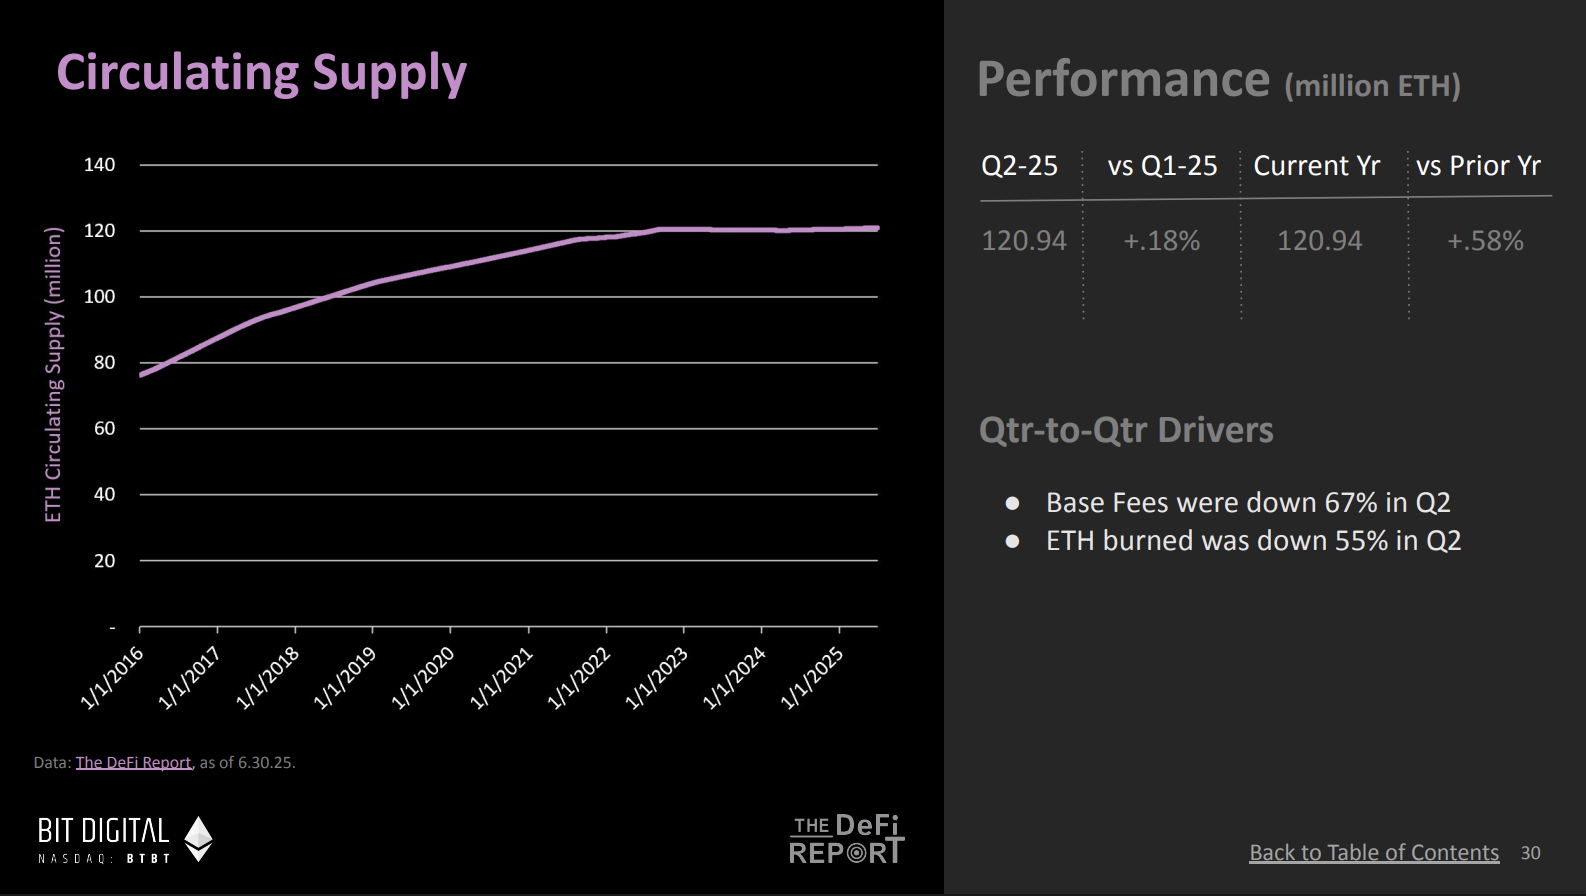
As you mentioned, Ethereum's potential as a store of value asset is a key investment rationale, and its supply dynamics are closely tied to this. For example, in the second quarter of this year, Ethereum's circulating supply grew by only 0.18%, while block fees fell by 80% during the same period. Ethereum's destruction mechanism effectively offsets some of its issuance by destroying block fees and base fees, and these two factors together drive Ethereum's deflationary economics.
From my perspective, this is actually a bullish sign. Despite a significant drop in on-chain economic activity in Q2, especially in the context of gas price optimization, Ethereum’s supply growth rate remains below Bitcoin’s inflation level. Even with the reduction in on-chain activity and the ongoing network upgrades, Ethereum’s supply dynamics remain strong.
You see, even though on-chain activity has dropped significantly and network upgrades are going on, supply still hasn't exceeded Bitcoin issuance. That's interesting because now you have a store of value asset that looks like Bitcoin, but we know Ethereum also has yields. And these ETFs, I believe there are some applications that will be launched before the end of the year that allow for some of the yields to be passed on to ETF holders. So that's interesting, maybe you've bought Bitcoin in the market and invested in a Bitcoin ETF. Now you see this setup and might want to move some assets to capture the yields if this product is available. So I think the store of value part is interesting because it ties in nicely with the fact that there are yields, and Bitcoin doesn't have yields.
Ryan:
As investors come to understand this, this trend becomes very attractive. Bitcoin has a fixed supply of 21 million, while Ethereum's annual issuance, while fixed, fluctuates to a certain extent, with a maximum issuance rate of no more than 1.45%. If calculated on an annualized basis, this is approximately equivalent to 0.45%, which is lower than Bitcoin's current issuance rate of about 0.85%. In contrast, other value-storing assets such as gold typically have annual issuance rates between 1% and 1.5%, depending on the price of gold. This comparison is also very interesting.
In addition, I would like to remind everyone that if you missed the bull cycle in 2021, Ethereum's monetary policy was not perfect at that time. That was before Ethereum merged, and people had limited understanding of its future monetary policy and issuance mechanism. To review, the merger actually occurred after the market crash in the summer of 2022. Since the merger was completed in September 2022, Ethereum's issuance policy and monetary policy have become more stable and perfect. Although Ethereum's monetary policy is not as widely understood as Bitcoin at present, it may become easier to understand as this cycle progresses. In addition, Ethereum's supply dynamics are also providing advantages for its long-term development, such as reducing supply to optimize the ecosystem
43% of ETH supply is locked in smart contracts, and ETH balances on CEX are at an all-time low
Ryan:
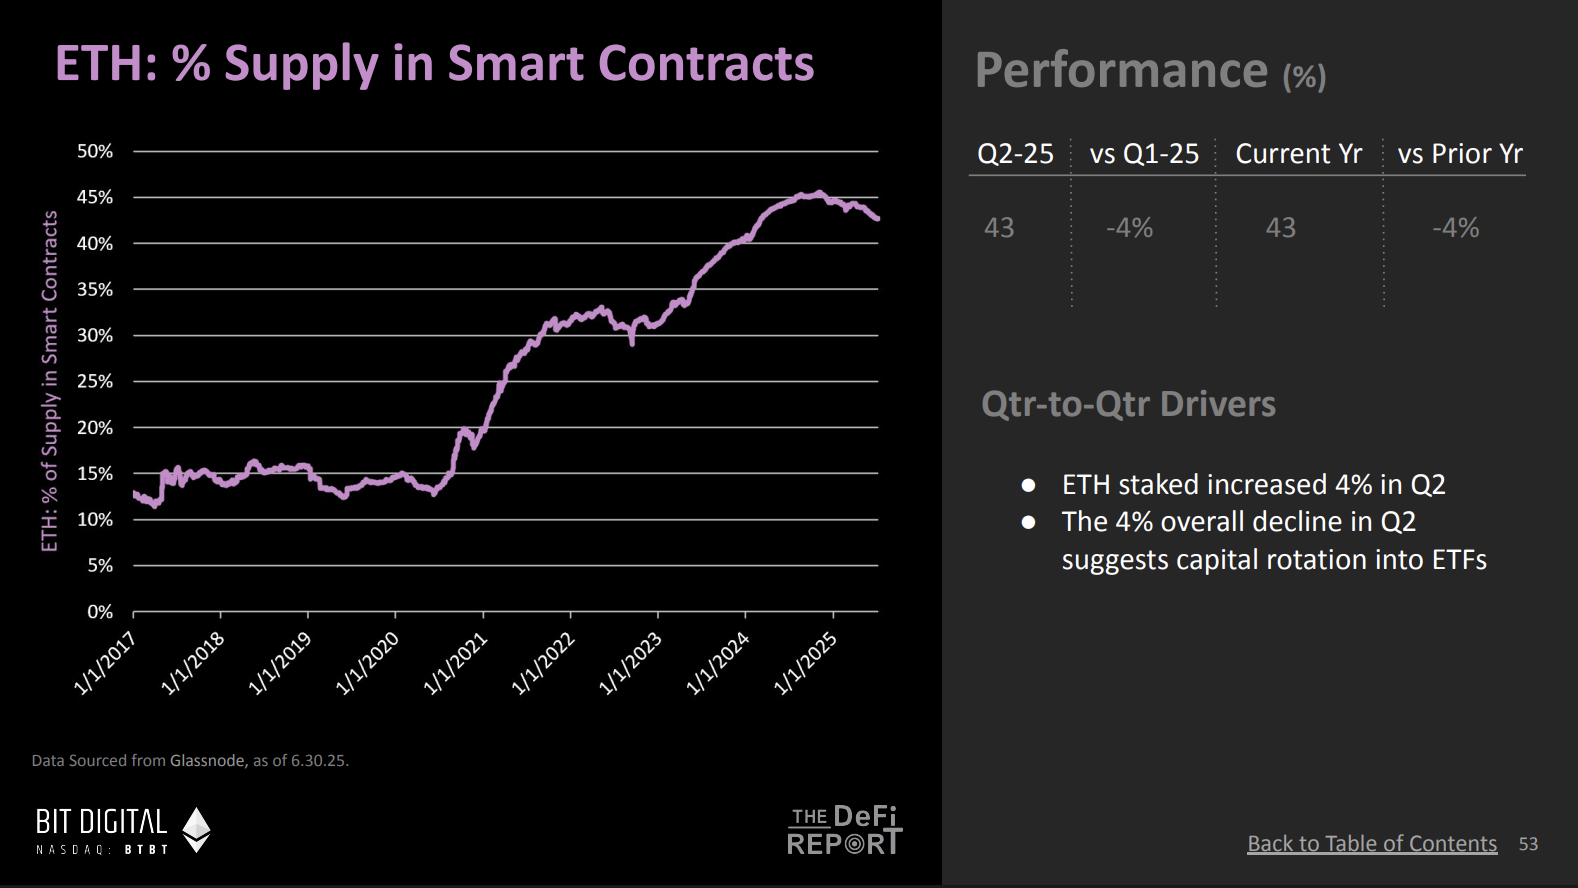
Here is a concurrent metric about Ethereum supply that reveals an interesting trend. This is the percentage of Ethereum supply locked in on-chain smart contracts . While this percentage is down from the previous two years, we can see an overall growth trend. What does this trend indicate?
(Chart taken from The ETH Report – DeFi Report)
Mike:
Yes, this shows that about 43% of the ETH supply is currently locked in smart contracts. This means that 43% of the supply on the chain is active. When this line continues to rise over the long term, it usually indicates that users are becoming more confident in putting their assets into DeFi, staking contracts, and using protocols. Therefore, I think this is a bullish signal that the use cases on the chain are increasing . I expect this ratio to grow further in the future.
Ryan:
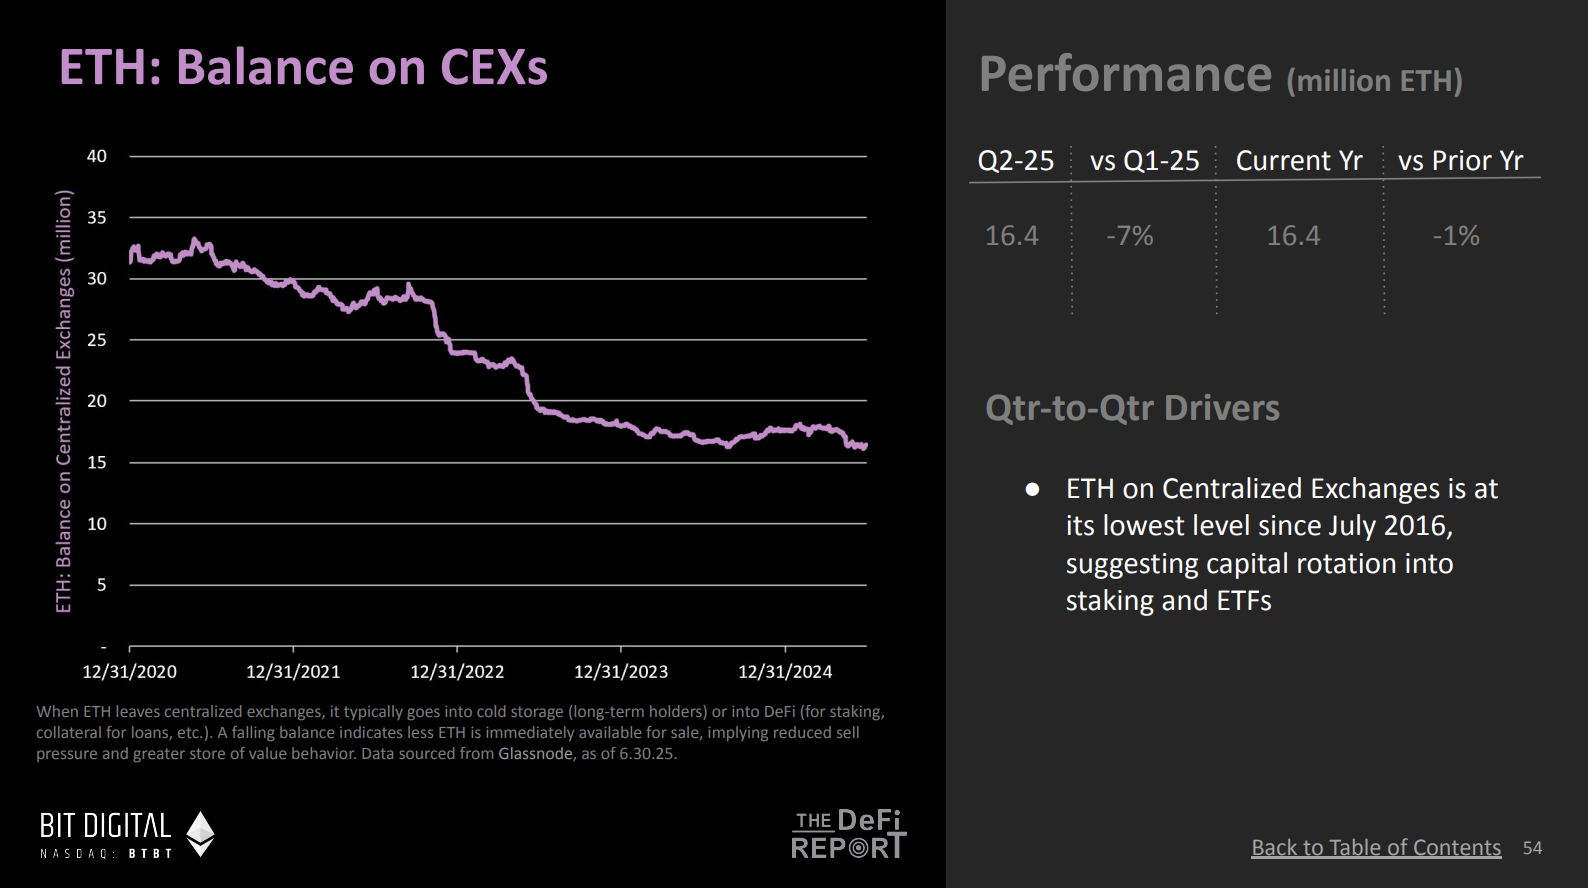
Another related chart shows that the current ETH balance on centralized exchanges is almost at an all-time low. This is the lowest level in the past eight years. This shows that the supply of Ethereum is flowing from exchanges to the chain.
(Chart taken from The ETH Report – DeFi Report)
Mike:
This actually echoes the previous chart, reflecting the trend of assets moving from centralized exchanges to on-chain. Users are not only moving assets to the chain, but also putting these assets into staking contracts. To me, this shows that users are investing capital in the chain, which may mean that they are more long-term holders or are more inclined to use Ethereum as a store of value asset. If this trend continues, there will be fewer assets available for sale on centralized exchanges.
Ryan:
So, the current bullish thesis can be summarized as follows: First, we are seeing increasing institutional adoption of Ethereum, including demand growth driven by stablecoins and real-world assets, and this trend may be further accelerated by Bill. Second, institutional demand is emerging, as reflected in the inflow of funds into Ethereum and the asset allocation of some treasury companies, and this demand is expanding with the publicity of Wall Street figures such as Tom Lee and Joseph Lubin. In addition, Ethereum's supply dynamics are more robust than in the past, including the strengthening of monetary policy and extremely low issuance. Finally, the increasing proportion of Ethereum locked in smart contracts and the strengthening trend of outflow from centralized exchanges further support the bullish view.
ETH once fell below the 200-day moving average, hitting a record low
Ryan:
This brings up the question that all investors are concerned about: Is now a good time to buy? The price was around $15 a few months ago, and now it is close to $30. Have people missed the best buying opportunity? What is the fair market value of this asset? What do you think about this question? What does the MVRV Z-score tell us?
(Chart taken from The ETH Report – DeFi Report)
Mike:
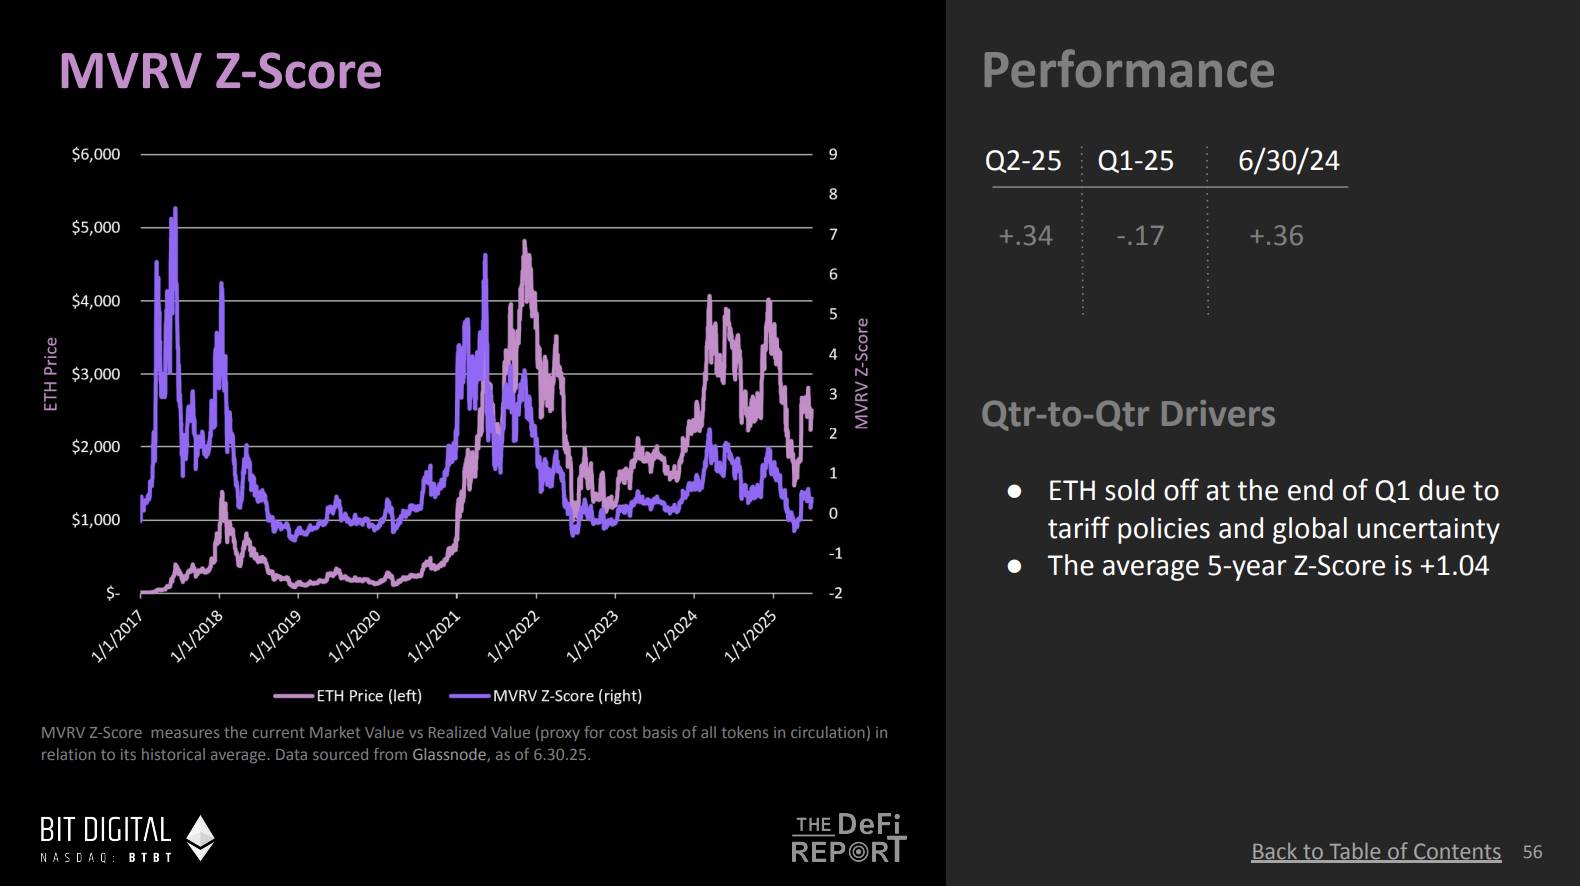
The MVRV metric measures the ratio of market value to realized value, and we used data from Glassnode. Glassnode’s analysis is primarily based on on-chain wallet data, so it doesn’t include assets on ETFs or exchanges. It does this by calculating the cost basis of tokens in these wallets and comparing it to the historical average cost basis of the network.
At the end of the quarter, the MVRV Z-score was around 0.3, which represents how far the current price is from the historical standard deviation, while the five-year average is around 1. Therefore, at the end of the quarter, the asset looks reasonably priced. Prices have risen in recent weeks, and the MVRV Z-score has risen to 0.8, close to the five-year historical norm. But as the chart shows, this metric is good at highlighting some ideal buying opportunities, and when the market is overheated, the market value tends to be far above the historical average cost basis of the network token. Therefore, even at current levels, this is still a good price range by historical standards.
Ryan:
So right now the MVRV Z-score is 0.8, and 1.04 is the five-year historical average, right? We've seen it go well above 1 during bull markets , even up to 2 or 3. At what point do you think the MVRV indicator starts to indicate an overheated market? It's not there yet, but when a score of 2 or 3 is reached, would you consider that a sign that the market is entering an irrational state?
Mike:
I think it's a combination of factors, and MVRV is one of them. We also have a chart showing the 200-week moving average, which is another important reference indicator. At present, the MVRV Z-score is 0.8, and coupled with the significant increase in prices over the past two to three months, short-term indicators may show that the market is slightly overheated, so we may see a price correction. But in the long run, the current price range is still within the reasonable value range.
We also watch another indicator, which is the 200-week moving average. Typically, when prices approach the 200-week moving average, the market tends to bottom. Earlier this year, during a major sell-off, we even fell below the 200-week moving average to create an all-time low.
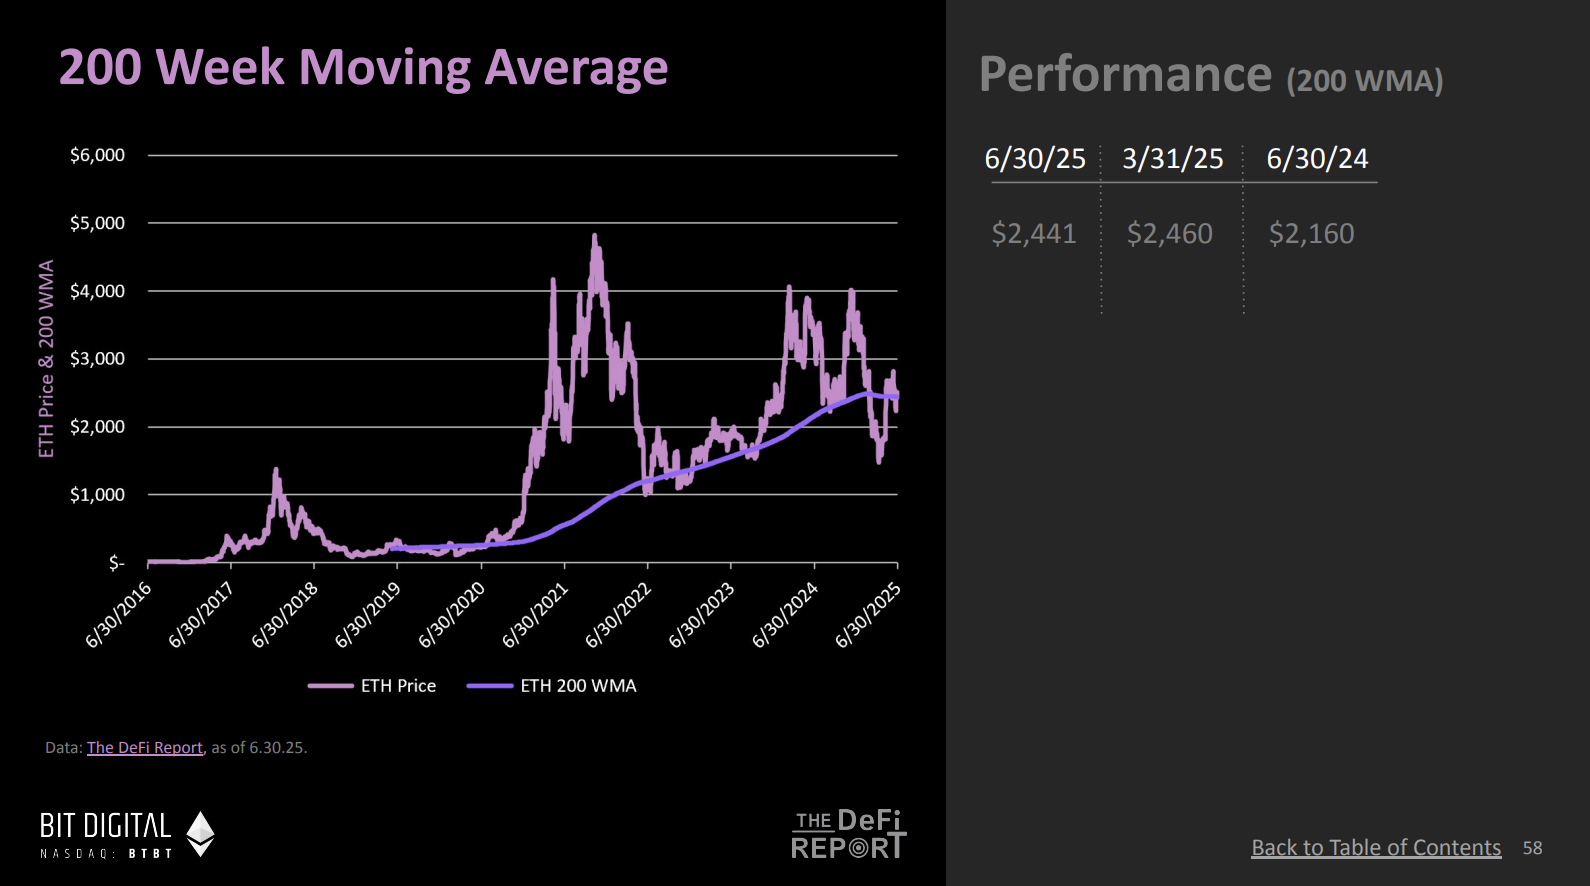
(Chart taken from The ETH Report – DeFi Report)
Ryan:
The price fell below its 200-week moving average.
Mike:
Yes, it broke. This drop was the biggest drop below the 200-week moving average and looked like a generational buying opportunity. The price has since rebounded from this point and is currently just above the 200-week moving average, currently trading at around $20,500. While the price is starting to move away from this line a bit, as the chart shows, in a bull market the price will usually go well above this purple line, and we are not there yet.
Comparison of market value and TVL and bull market data model
Ryan:
Another metric worth watching is market cap versus TVL. I think this metric probably doesn’t get enough attention. Why do you think investors should pay attention to it?
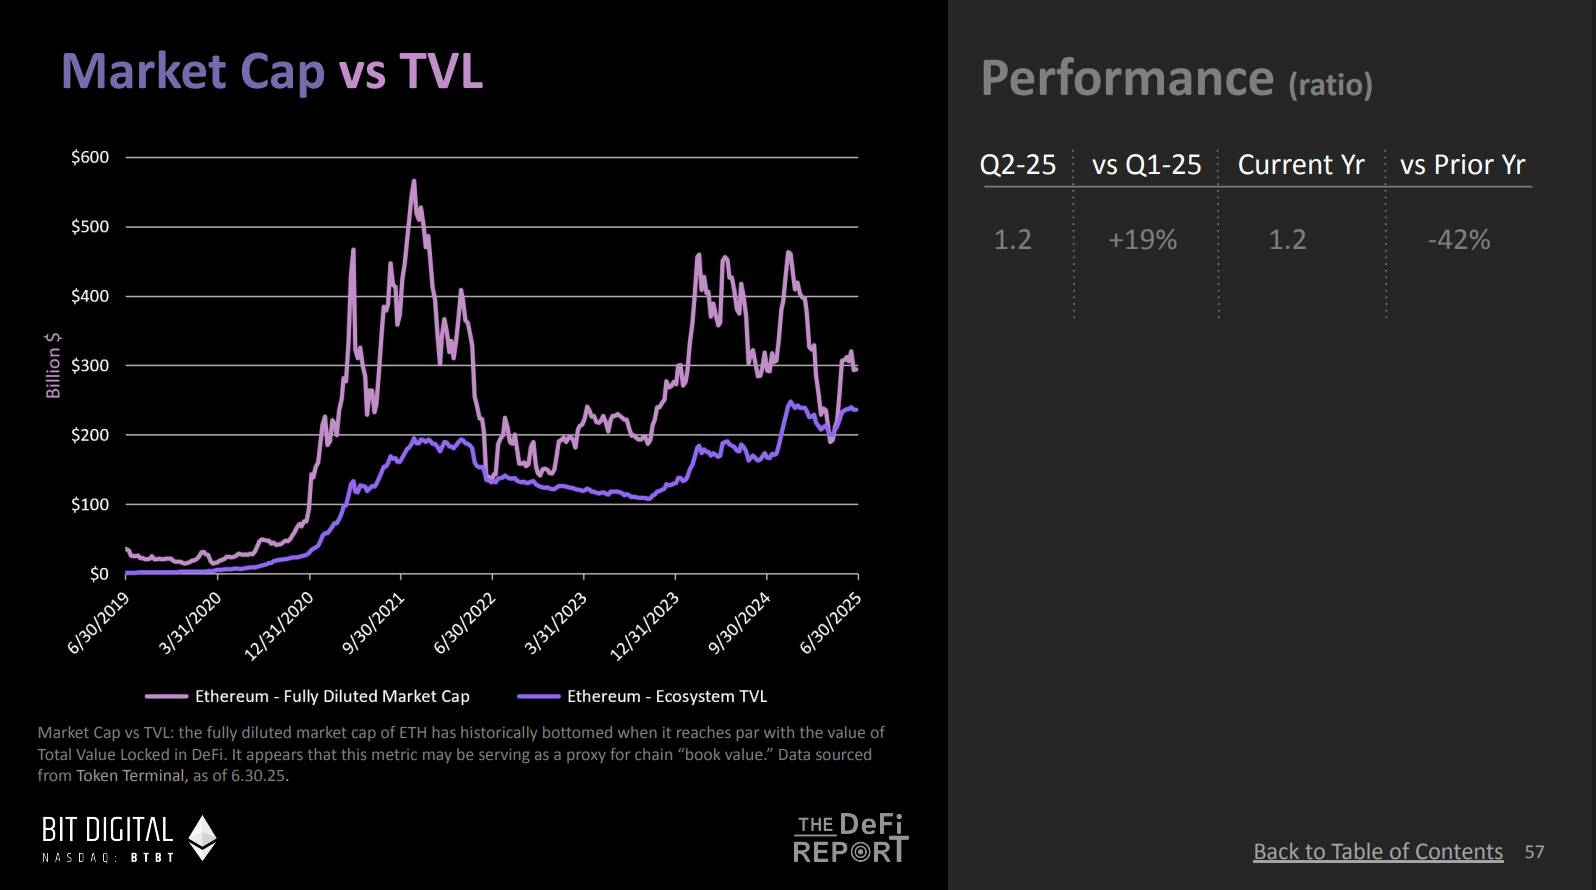
(Chart taken from The ETH Report – DeFi Report)
Mike:
This is a very valuable metric, thanks to Token Terminal for providing data support. This metric reflects the total locked value (TVL) of the entire ecosystem, covering not only the TVL of decentralized finance (DeFi), but also the locked value of stablecoins. Therefore, it is a more comprehensive number for a holistic view of the health of the blockchain ecosystem.
We have observed that during bear markets, market value typically falls back to the TVL level of the ecosystem. This phenomenon is somewhat similar to "book value" in traditional finance, which is the intrinsic value of an asset. We have been trying to understand this type of comparative metrics related to DeFi, and the relationship between market value and TVL can be seen as the "book value" in the blockchain field. Interestingly, whenever the price falls back to the so-called "book value" (TVL), the market tends to usher in a strong rebound.
Ryan:
I did some bullish math on Twitter , assuming that Ethereum's TVL could grow to $1 trillion, and Ethereum's current market cap is about $300 billion. Do you think this is possible?
Mike:
Judging from current trends, such growth is possible.
Ryan:
Given the rapid growth of stablecoins, this is entirely possible. Assuming $500 billion in locked value in stablecoins, plus $100 billion in locked value in real-world assets, and a rise in the value of all crypto-native assets, we can get to $1 trillion with some simple math. If we multiply this number by a higher TVL multiple, like 2.5, then the price of Ethereum could reach $20,000. That’s the logic of this math model.
Of course, we cannot yet determine how much TVL will ultimately be deployed on Ethereum, but this model tells a story worth paying attention to. In particular, the relationship between market capitalization and TVL, the purple line, may become a key indicator in this bull run.
Mike:
It's really interesting. With the massive influx of stablecoins entering the market, this sets the stage for a bear market. Therefore, it will be important to continue to track market cap vs. TVL. It's also a good way to think about potential valuations, as the value on-chain could increase significantly as more assets enter the blockchain ecosystem.
ETH L2 performance and yield, comparison between bear market and bull market
Ryan:
Mike I have another question, there are some other charts in your report that tell a different story, and although we didn't discuss them today, I wanted to get your overall view. Do you think these charts can be interpreted in a bullish or bearish way?
In the report, I noticed that Ethereum's fee income, including MEV (maximum extractable value) income, etc., has generally shown a downward trend. Ethereum's actual earnings have decreased compared to the previous bull market cycle. Part of the reason is that Ethereum has expanded the supply of block space through the Petra upgrade. Although there has been little change on Layer 1, the block space of Layer 2 has increased significantly. However, this has caused Layer 2's earnings to fail to reach the expected level. Some people believe that the expansion of Layer 2 has "sucked" usage, business, MEV, and fees from the Ethereum mainnet, forming a "parasitic effect." From this perspective, this may be a bearish signal, as the decline in assets and real yield may cause people to worry about the prospects of Ethereum.
Of course, there is also a more bullish view that these upgrades actually improve the efficiency and productivity of the Ethereum network. We are seeing significant growth in the use of Layer 2. Not only have active addresses and transaction volume increased, but the number of users and transaction frequency have continued to rise. Although users pay less fees, this can be a good thing because lower fees can attract more users and further consolidate the network effect of the EVM (Ethereum Virtual Machine). This network effect is expected to translate into more revenue in the future and the widespread use of Ether as a store of value asset. This is a more optimistic view that the Layer 2 strategy is working, making up for the lack of revenue through widespread adoption of the network, attracting more users and promoting Ethereum's value storage function.
When prices are rising, people often think " the bulls are right", and when ETH prices fall to $300, people question "is the whole concept of Layer 2 a failure?" How do you think about this? What is your opinion when weighing the bullish and bearish views of Layer 2 data against Ethereum gains?
Mike:
This is an important topic. I think the Ethereum roadmap is progressing as planned. The growth and value of Layer 2 is already very obvious. For example, why did Coinbase launch Layer 2 now? Because it is good for their business. The same is true for Robinhood, and their choice also proves the value of Layer 2.
In my opinion, although Ethereum is not a commercial project in the traditional sense, it is indeed a product that needs to be widely adopted by users. As long as the product can meet market demand, it forms the so-called "product-market fit". This is a key point. Any entrepreneur knows that the first thing to do is to find product-market fit, and then adjust the pricing strategy and establish a competitive advantage. Ethereum is currently at this stage. With the widespread adoption of Layer 2, if Ethereum can provide high-quality services for these Layer 2s and establish a strong network effect, I believe the market will gradually complete its self-adjustment.
Therefore, my view is that although the current returns have declined, Ethereum is going through a transition period. If product-market fit can be maintained, there will be opportunities to adjust pricing strategies and further increase value in the future. We may discuss the development path of native Rollups in the future, which is a topic worth exploring in depth. The key lies in the execution of the Ethereum Foundation and the community, finding a balance point to allow enough value to flow to Ethereum while verifying the interests of ETH holders.
Ryan:
We may still be in the early stages of a price rotation in ETH, but of course, it is too early to know for sure. The price has not yet reached a level high enough to verify this, so it is still an observation phase.