Bitcoin (BTC) continues to strengthen, breaking through $118,800, reflecting strong buying pressure from bulls and a short-covering wave. According to CoinGlass data, approximately $570 million worth of BTC shorts were liquidated on Thursday alone - clearly indicating a short squeeze in the market.
VX: TZ7971
Traditional financial markets also showed another positive signal: Based on Farside Investors' data, the physically settled Bitcoin ETF in the United States recorded its second-largest inflow, with an inflow of $1.17 billion on Thursday. This demonstrates increasing confidence from institutional investors in Bitcoin's long-term growth potential.
According to the MVRV index (the ratio of Bitcoin's market value to its actual value), distribution in previous cycles typically began when the index reached 2.75. If history repeats itself, this would correspond to a BTC price of approximately $130,900.
So, will Bitcoin continue its bullish momentum, while also providing leverage for some Altcoins to follow?
BTC Technical Analysis
BTC broke through the neckline on Thursday, completing a bullish inverted head and shoulders pattern.
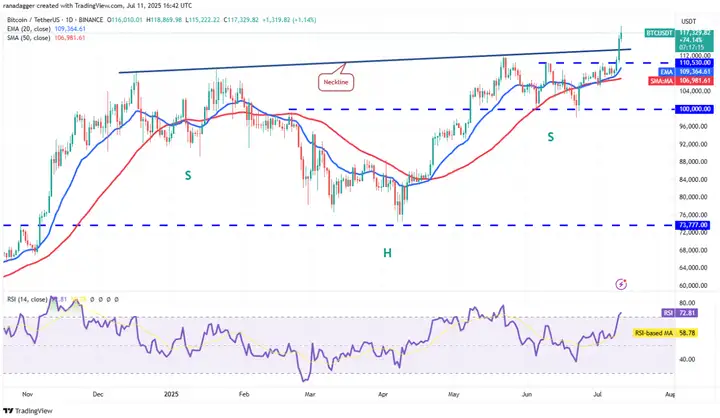
Typically, after breaking a pattern, prices will retest the breakout area. If the BTC/USDT pair rebounds from the neckline, it will confirm that bulls have converted this area into support - increasing the likelihood of the uptrend continuing, with the pattern's target price at $150,000.
The first sign of weakness would be falling below and closing under the neckline - signaling higher levels of profit-taking. Bears need to pull the price below the 50-day simple moving average (SMA) at $106,981 to regain advantage.

Currently, the price has strongly rebounded from the $110,530 area and broken through the neckline. This rise has pushed the 4-hour Relative Strength Index (RSI) into the overbought zone, increasing the possibility of a short-term pullback or consolidation. If the price maintains the neckline, the uptrend may continue to the $123,000 area.
However, if the price drops sharply and breaks below the $110,530 support in the short term, this bullish scenario will become invalid.
(Note: The translation continues in the same manner for the rest of the text, following the specified guidelines.)On the downside, the recent support level is at $0.29. If the price falls back from the $0.34 area but still holds the support at $0.29, market optimism may continue. Bulls will continue to try to push the Sei/USDT trading pair above the resistance level. Conversely, bears need to pull the price below the 20-day moving average to confirm the pullback.