

Written by: Jose Antonio Lanz, Guillermo Jimenez
Translated and Compiled by: BitpushNews

Bitcoin continues to break through key resistance, standing at a historical high of $116,000, and this breakthrough is injecting new momentum into the market. The next price target has become a hot topic among traders, and this article will analyze it from a technical chart perspective.
Macroeconomic Background
As the S&P 500 and Nasdaq Composite Index reach historical highs for the third time in four trading days, and gold futures rise above $3,370 per ounce, with the Federal Reserve maintaining a patient monetary policy stance, risk assets are receiving broad-based buying support.
Bitcoin's upward momentum also resonates with the explosive US employment data - June non-farm employment increased by 147,000 (expected 110,000). Although the strong employment data initially caused Bitcoin to drop below $109,000 due to rate hike concerns, the market quickly digested the selling pressure and pushed it to a new local high.
Institutional adoption remains the core driving force. Bitcoin ETF cumulative inflows in July have exceeded $50 billion. This continuous institutional buying provides key support for any pullback and validates Bitcoin's evolution from a speculative asset to a portfolio allocation asset.

The synergistic effect of technical breakthrough and institutional accumulation makes traders wonder: Where will Bitcoin go after crossing the final barrier into the unknown?
Bitcoin Chart: Double Breakthrough Targeting Final Resistance
Bitcoin recently surged to $113,000, marking the opening of a new historical high area, which is a decisive technical breakthrough of two patterns that have suppressed the price for weeks.
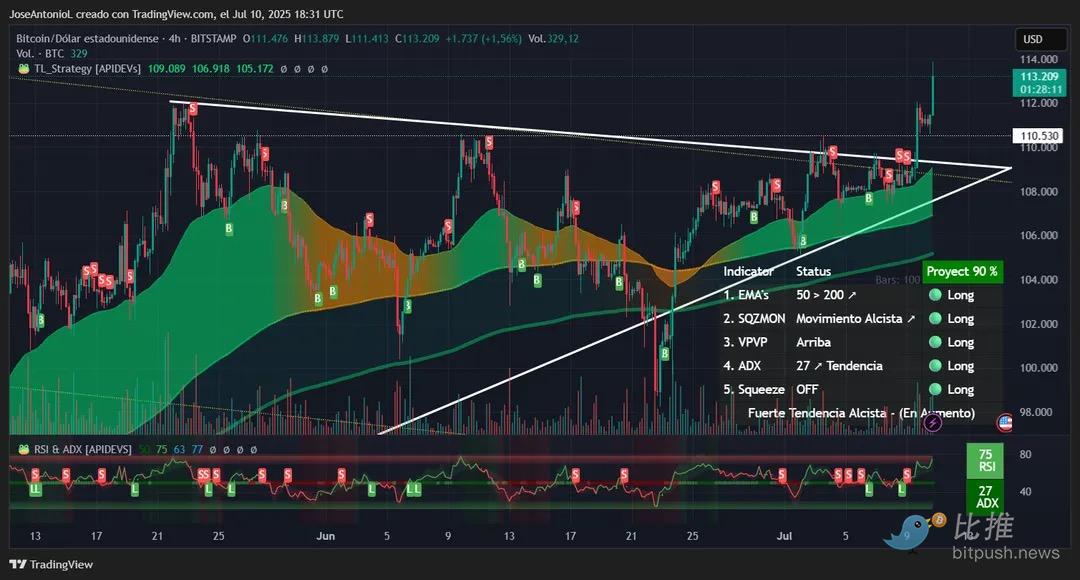
The 4-hour chart shows Bitcoin cleanly breaking through a symmetrical triangle pattern, while the daily chart shows smaller fluctuations with slightly insufficient bullish momentum. In this type of pattern, this is expected, but such a long candlestick leaves almost no doubt. The breakthrough confirmation is clear - enough to turn almost all key indicators bullish on the intraday timeframe.
Source: TradingView
On the 4-hour chart, the Average Directional Index (ADX) is 27. This typically confirms a trending market. ADX measures trend strength without considering direction. When it breaks 25, it signals momentum traders, indicating a sustainable trend is forming, usually triggering systematic buying in trend-following strategies.
However, the Relative Strength Index (RSI) at 75 shows Bitcoin has entered the overbought zone. One can view RSI as a market thermometer - when readings are too high, it often suggests a need for cooling. The current situation might hint at an imminent adjustment after a significant rise. However, it's worth noting that Bitcoin has maintained bullish momentum at even higher RSI levels multiple times.
The daily chart's momentum compression indicator shows a "closed" state, indicating that the volatility released by the recent compressed market movement aligns with previous analysis expectations. This suggests that the initial breakthrough has been realized, and traders should prepare for continued upward movement or consolidation at current levels.
Overall, the price is releasing bullish signals. Although the probability of continued upward trend is high, given the small fluctuations in pullback candlesticks, an adjustment is unlikely to threaten the trend.
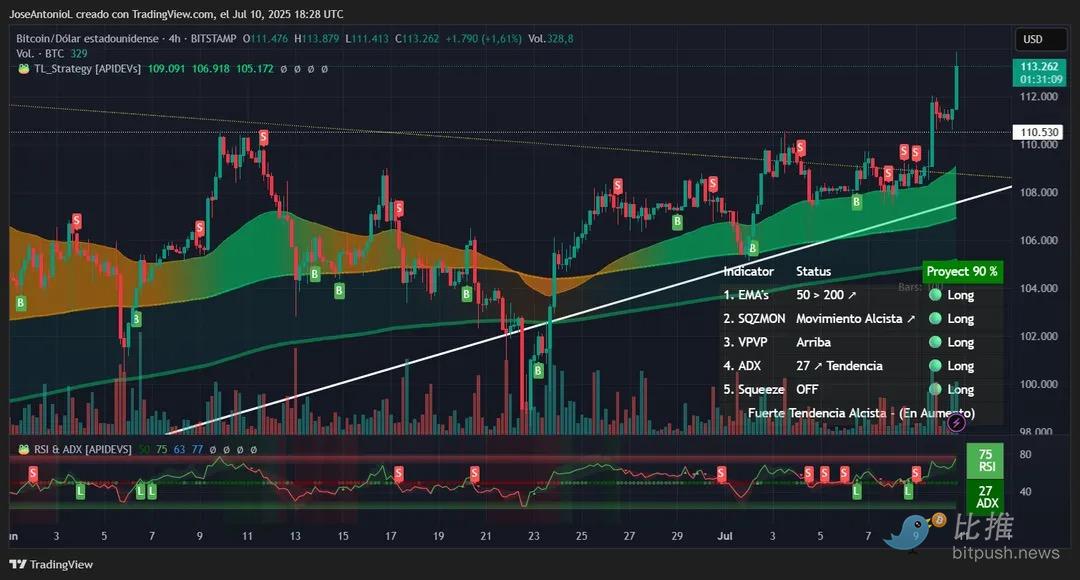
The daily chart also shows a bullish structure: Bitcoin has broken free from the descending bearish channel (yellow line in the image) that has suppressed prices since the May high. It currently seems to be forming a bullish support line (white line in the image), referencing the April pullback low and late June low. If confirmed effective, Bitcoin might oscillate near this support line, maintaining bullish momentum and potentially making $110,000 a new support by the end of the month.
The daily RSI at 67 shows healthy momentum without reaching the overbought zone above 70 - suggesting further upside potential. This reading tells traders that buying pressure remains strong but has not reached the extreme level typically signaling an adjustment.
The daily ADX at 12 indicates that the trend is still developing and has not yet reached a clearly definable dominant pattern - short-term charts often contain significant noise. Although below the key threshold of 25 for confirming a strong directional movement, a low reading after a breakthrough often suggests calm before acceleration. Traders interpret this as an accumulation phase before the next impulsive upward move.
Moving average analysis shows Bitcoin firmly standing above the 50 and 200-period exponential moving averages (EMA) across multiple timeframes. The continuously widening gap between these moving averages (called moving average divergence) typically characterizes a strong trend state and serves as dynamic support during pullbacks.
Key Levels
Immediate Support: $110,197 (breakthrough retest level)
Strong Support Range: $105,000-$108,700 (support line)
Expected Resistance: $115,000 (based on triangle breakout measured target and Fibonacci extension)
Bitcoin Market Outlook
The synergistic effect of technical breakthrough, institutional fund flow, and favorable macroeconomic environment suggests Bitcoin is likely to continue its bullish trend after breaking historical resistance. However, technically-oriented traders should monitor whether the daily ADX can break 25 to confirm trend strength, while also being wary of potential RSI divergence at new highs.
Looking at a broader perspective, July may still see significant Bitcoin volatility: Trump-era policies like the "Great Beautiful Act" could expand the US deficit by $3.3 trillion - historically beneficial for scarce assets like BTC. Additionally, the White House's crypto executive order report deadline on July 22 is approaching, which may involve updates to the US strategic Bitcoin reserve and could serve as a potential catalyst.


