

Bitcoin price just broke through $116,000, surpassing the May 2025 high and recording a new all-time high. However, this rise is backed by strong institutional support.
K Wave Media from Korea is reportedly acquiring 88 BTC as part of a $1 billion financial plan. The question now is whether this BTC price increase can avoid the same fate as the drop to $98,000 in May. Let's decode on-chain and chart data.
Decrease in Exchange Inflows... Reduced Selling Pressure
According to Cryptoquant, Bitcoin's exchange inflows have sharply dropped to 32,000 BTC per day (at the time of writing). This is the lowest since 2015. In December 2024, it was around 97,000 BTC during the $100,000 Bitcoin price increase.
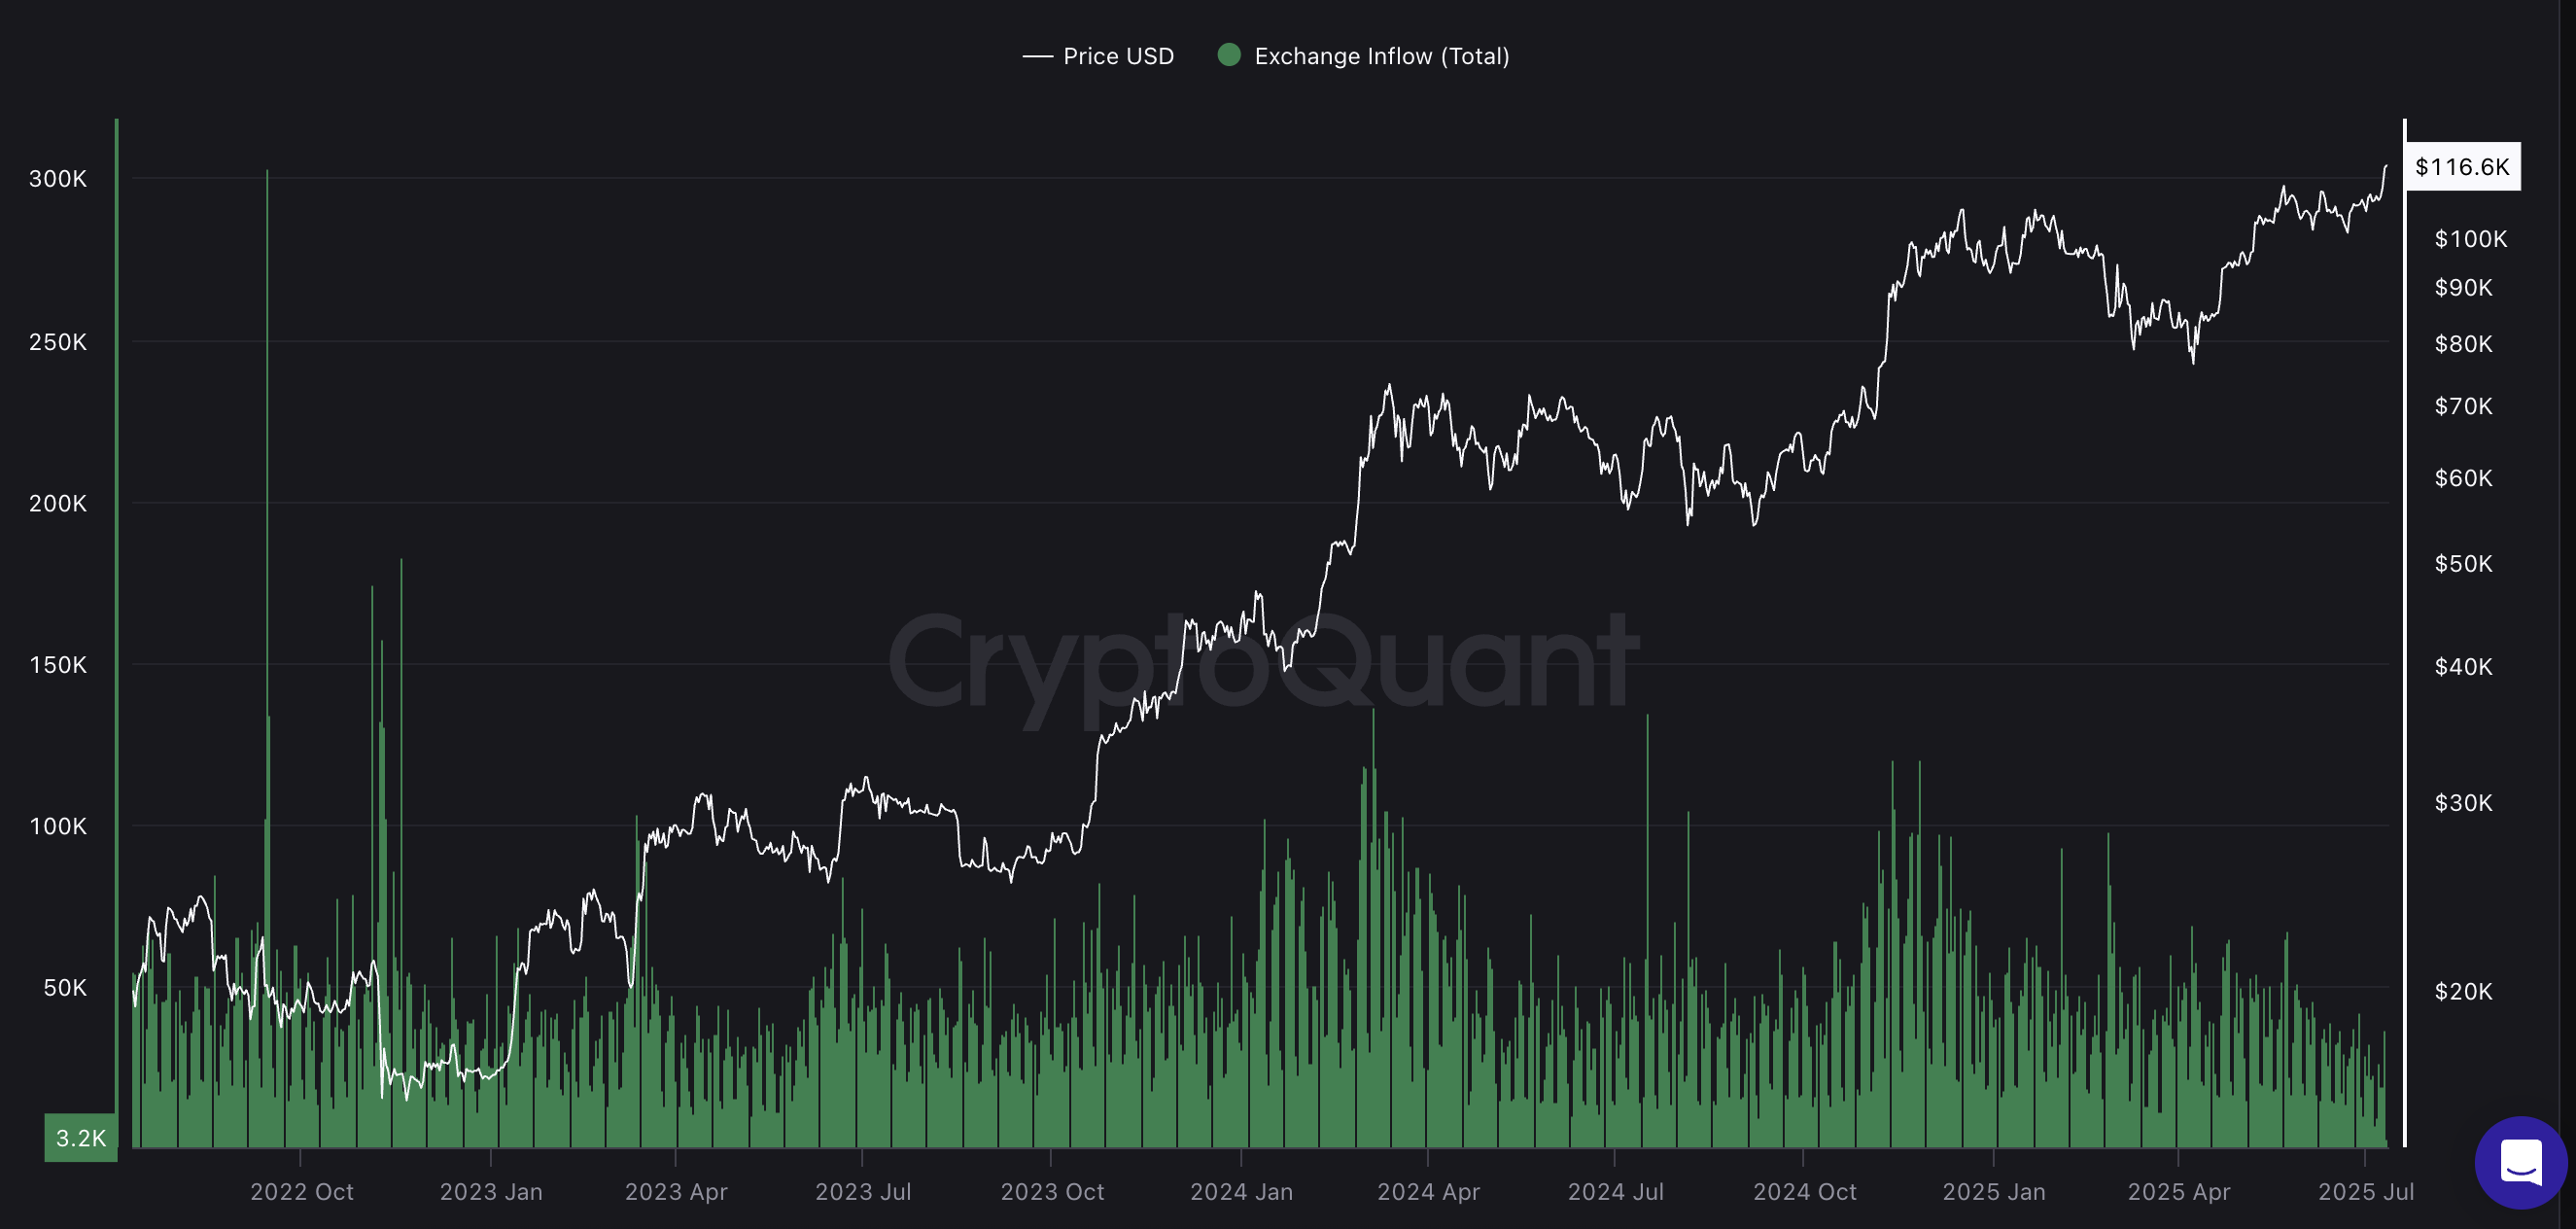
This is a tremendous decrease. Even at the new all-time high, holders are not moving coins to exchanges. This is a clear signal of low selling pressure and confidence in the asset.
Exchange inflows typically track the number of coins sent to exchanges for selling. The sharp decrease here indicates that whales and retail investors have not yet found their exit. This means a drop like May is structurally less likely.
Moreover, in an interview with BeInCrypto, Alexander Zann, interim CEO of Ziliqa, said the momentum is actually visible.
"The momentum is actually visible in the short term. Institutional demand is increasing, ETF inflows are strong, and companies continue to add Bitcoin to their balance sheets." – Alexander Zann, Interim CEO of Ziliqa
Wallet Clusters Support Bitcoin Price
Next, let's talk about defense. According to IntoTheBlock's In/Out of Money Around Price (IOMAP) indicator, over 645,000 addresses bought BTC between $108,795 and $110,624. This means 476,650 BTC is currently held in this price range, forming a major demand wall.
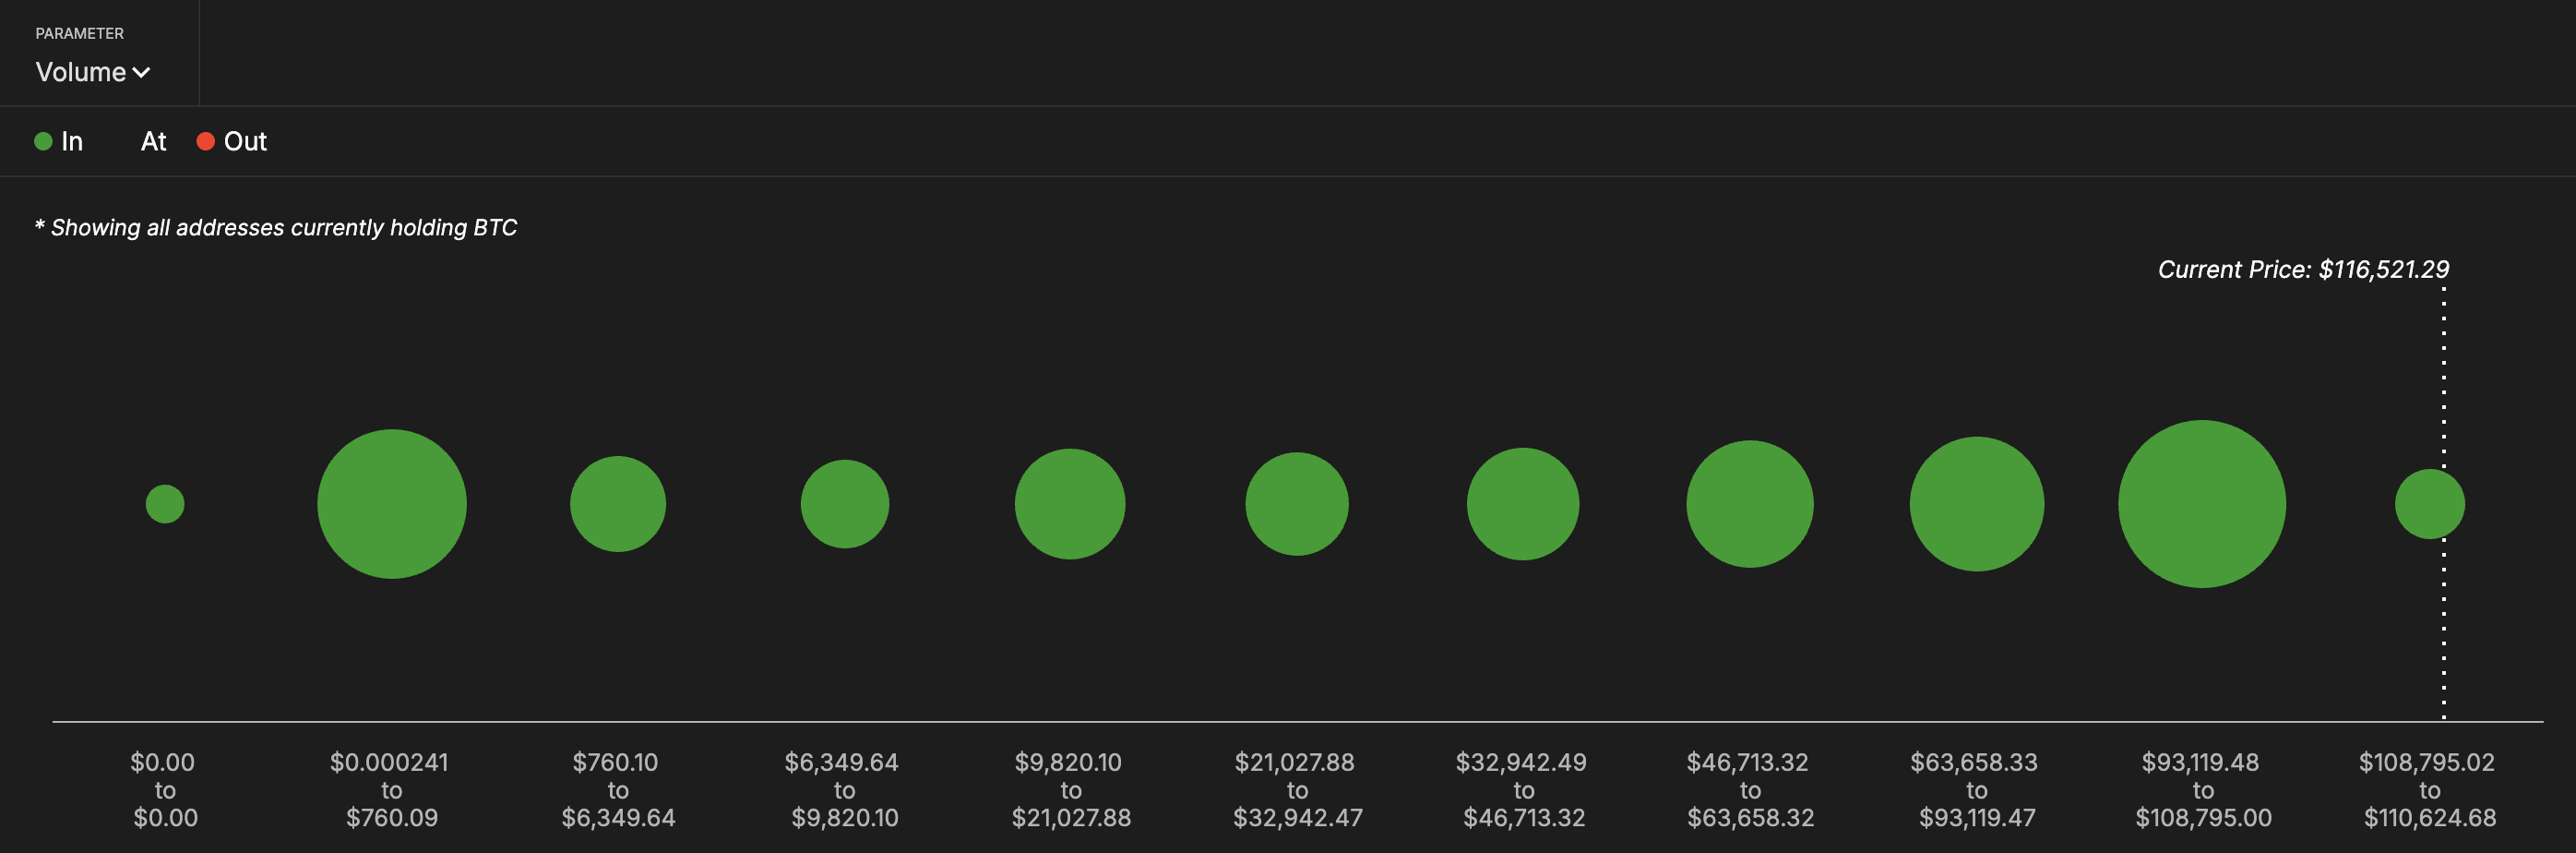
In May, the support zone quickly collapsed, causing a price drop. This time, if Bitcoin remains above these address clusters, it means short-term buyers are still in profit. This reinforces confidence.
IOMAP indicates the location of past buyers and whether they are in profit or loss. When large address clusters overlap with price zones, these areas act as major support or resistance.
RSI Divergence, 'Caution'... Not Yet Panic
There is risk here. While BTC price continues to make higher highs, the Relative Strength Index (RSI) is making lower highs. This is a typical bearish divergence. This often appears before a correction.
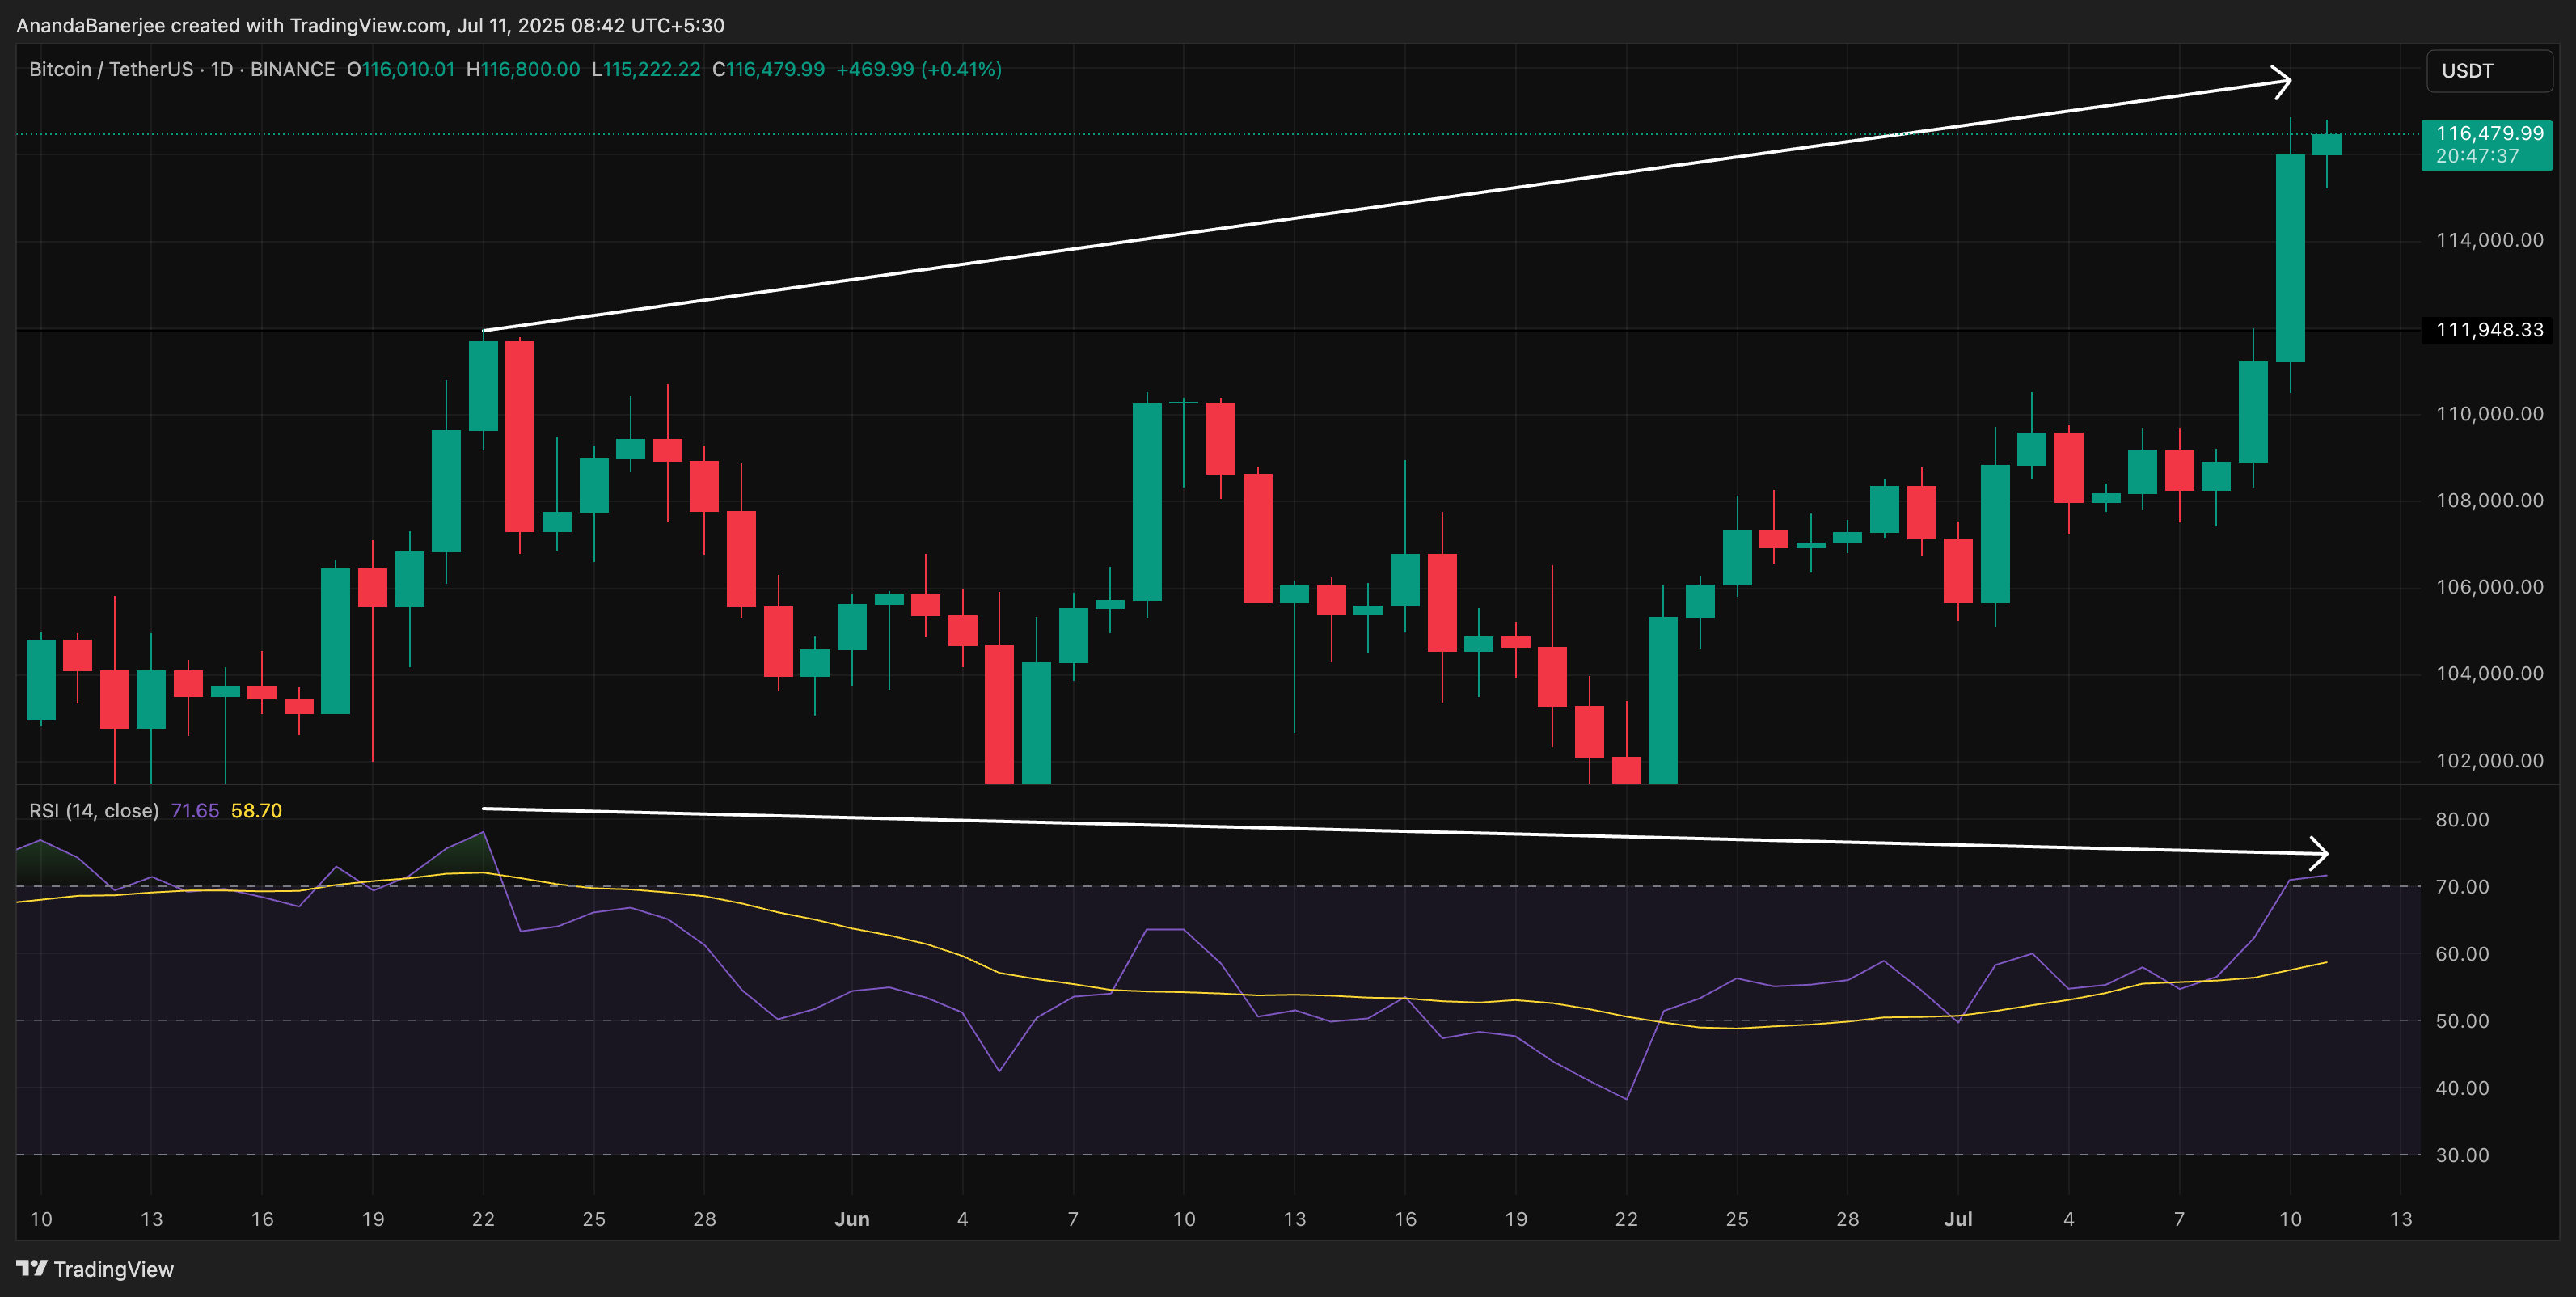
However, the RSI remains below the overbought zone (below 72). This is different from May, when it was close to 80. This is a significant difference. The divergence exists, but it has not yet reached panic levels. Therefore, a major correction is unlikely, but a pullback can be expected.
RSI tracks momentum. Divergence between price and RSI indicates weakening confidence. However, since it is not yet overbought, the current uptrend may still have fuel left.
Trend-Based Fibonacci Levels Provide Clear Upside Targets
As BTC re-enters price discovery (lacking historical reference lines), trend-based Fibonacci expansion helps chart potential resistance.
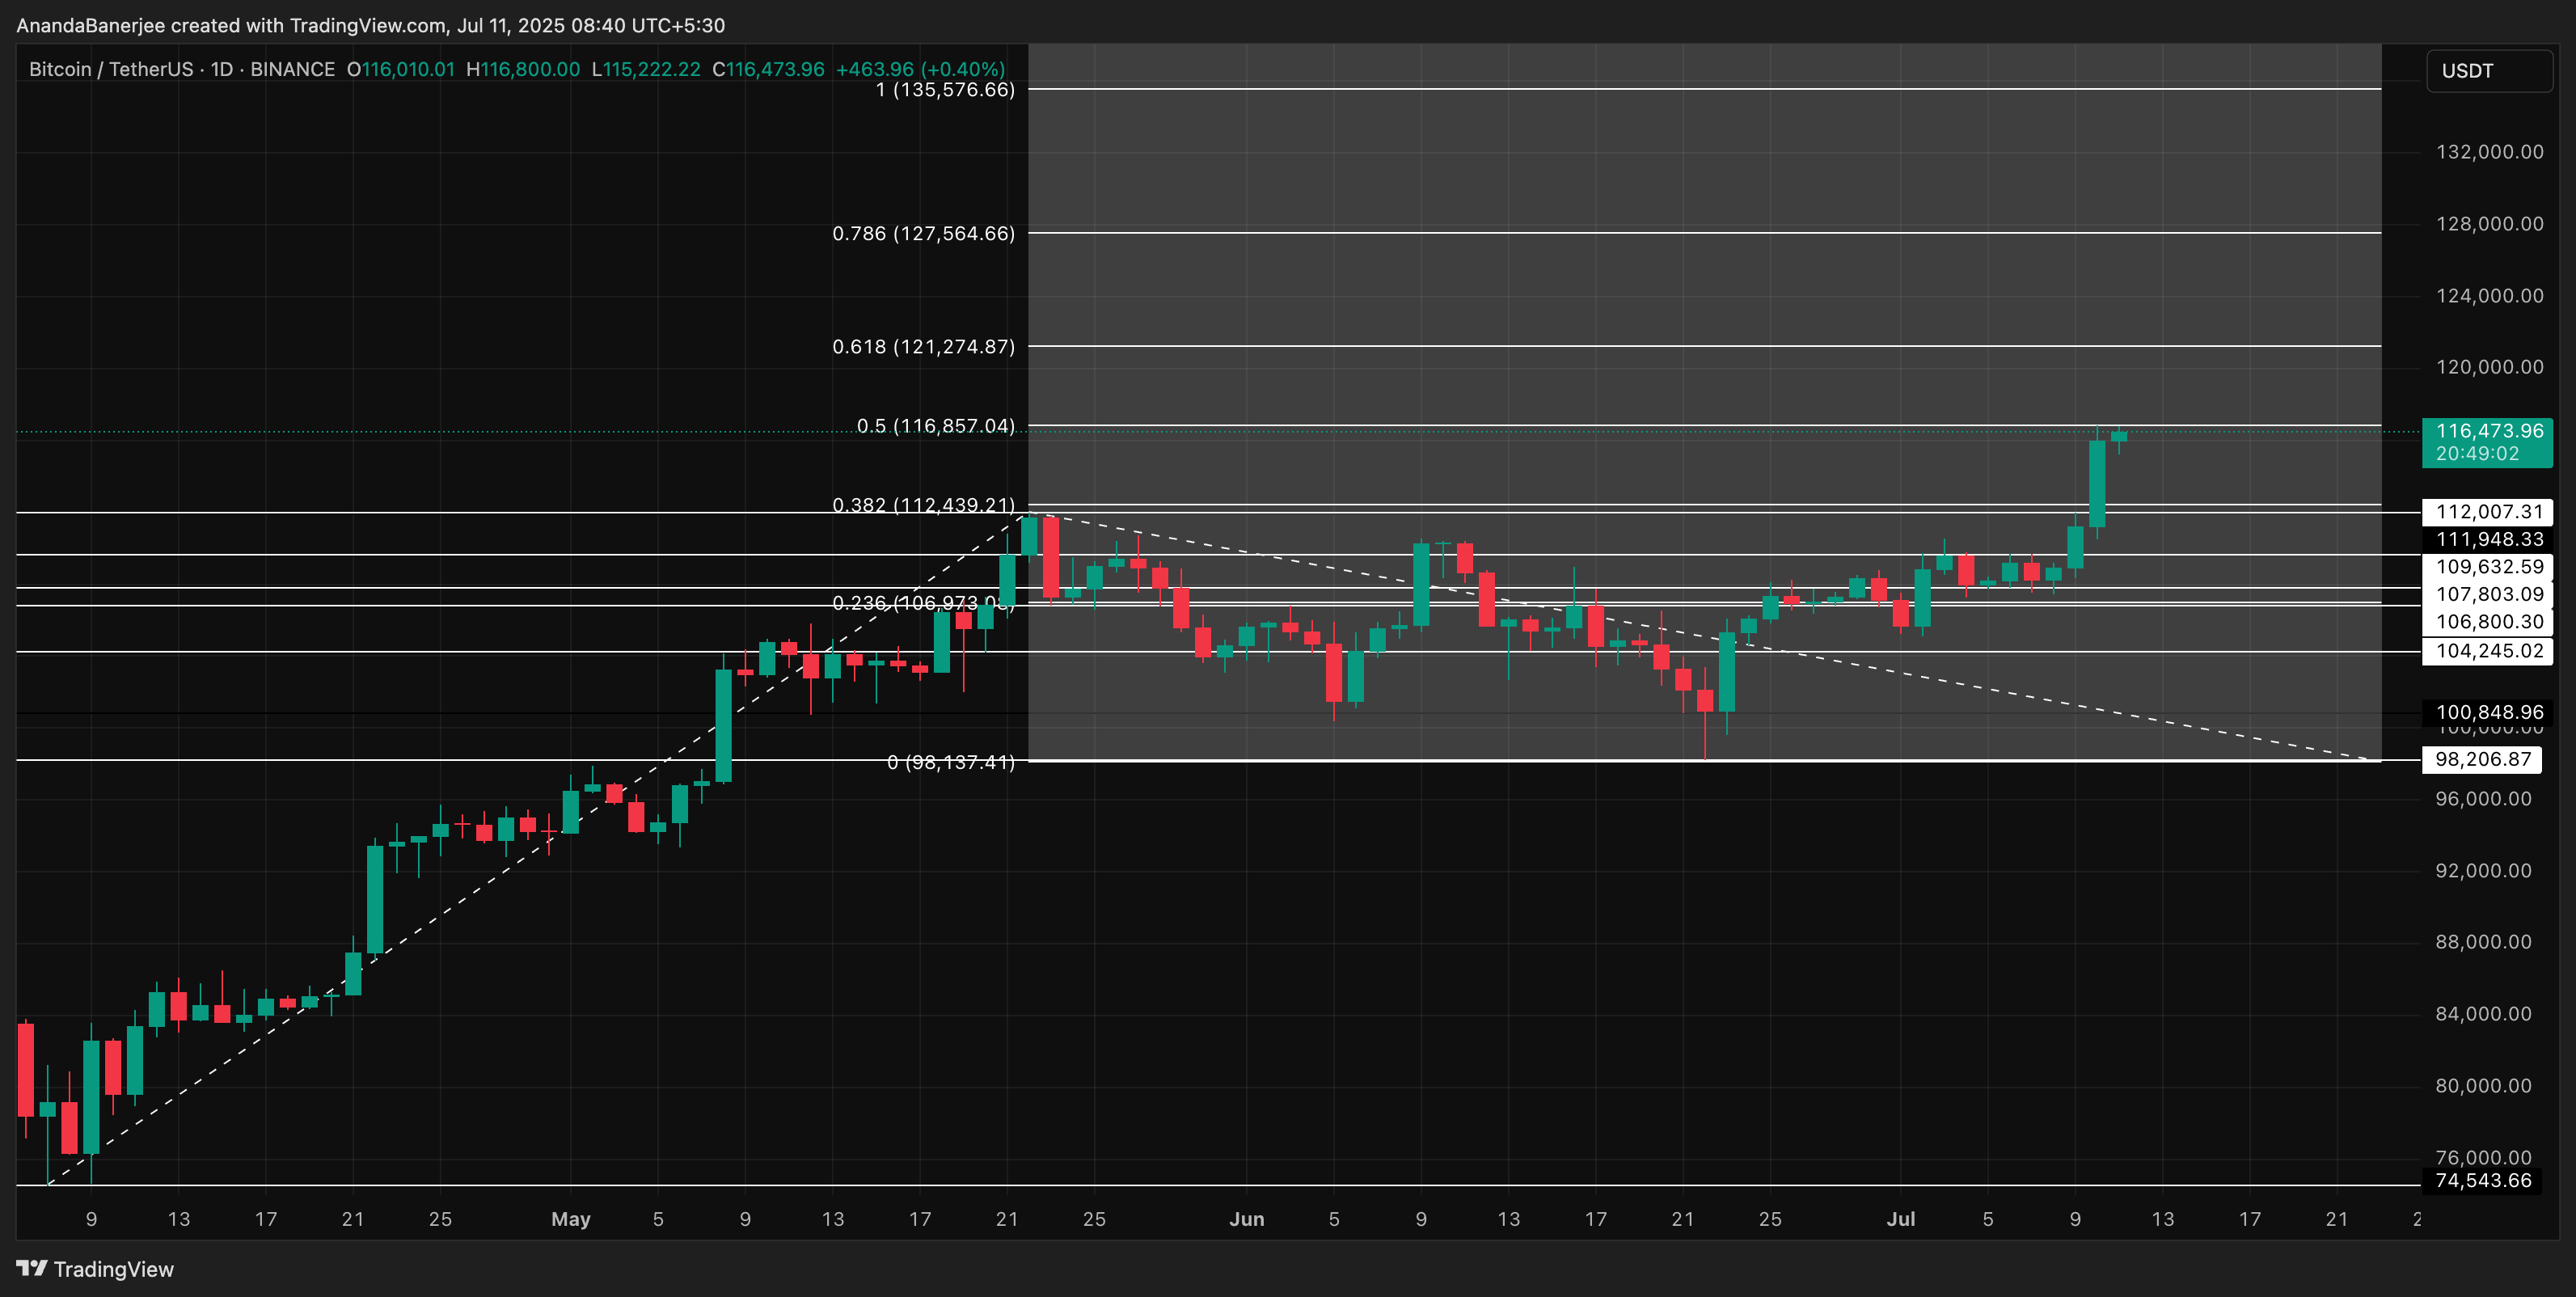
From the swing low of $74,543 to the May high of $111,980, and considering the pullback to $98,000, the following resistance levels emerge:
- 0.382 at $112,439
- 0.5 at $116,857
- 0.618 at $121,274
- 1.0 at $135,576
The recent week near Bitcoin's $116,500 all-time high coincides with the 0.5 Fibonacci expansion. This suggests that breaking this resistance level could push Bitcoin's price towards $121,000 and $135,000. These levels serve as guidelines for sustainability, but momentum must be maintained.
Bitcoin is currently above its May high, supported by low selling pressure, clear institutional buying, and strong support clusters. The Fibonacci roadmap suggests further upside potential.
However, caution is needed. RSI divergence has appeared. If price loses momentum below $109,632, this breakout could lead to another May-like correction, potentially invalidating the bullish hypothesis. Let's watch whether Bitcoin can turn this all-time high into a sustainable rally.


