Pi Coin appears to be collapsing. However, the hidden divergence between PI price and momentum suggests otherwise.
As exchange inflows increase and traders are drawn to short positions, a quiet reversal pattern is forming.
Exchange-Based Caution Still Persists
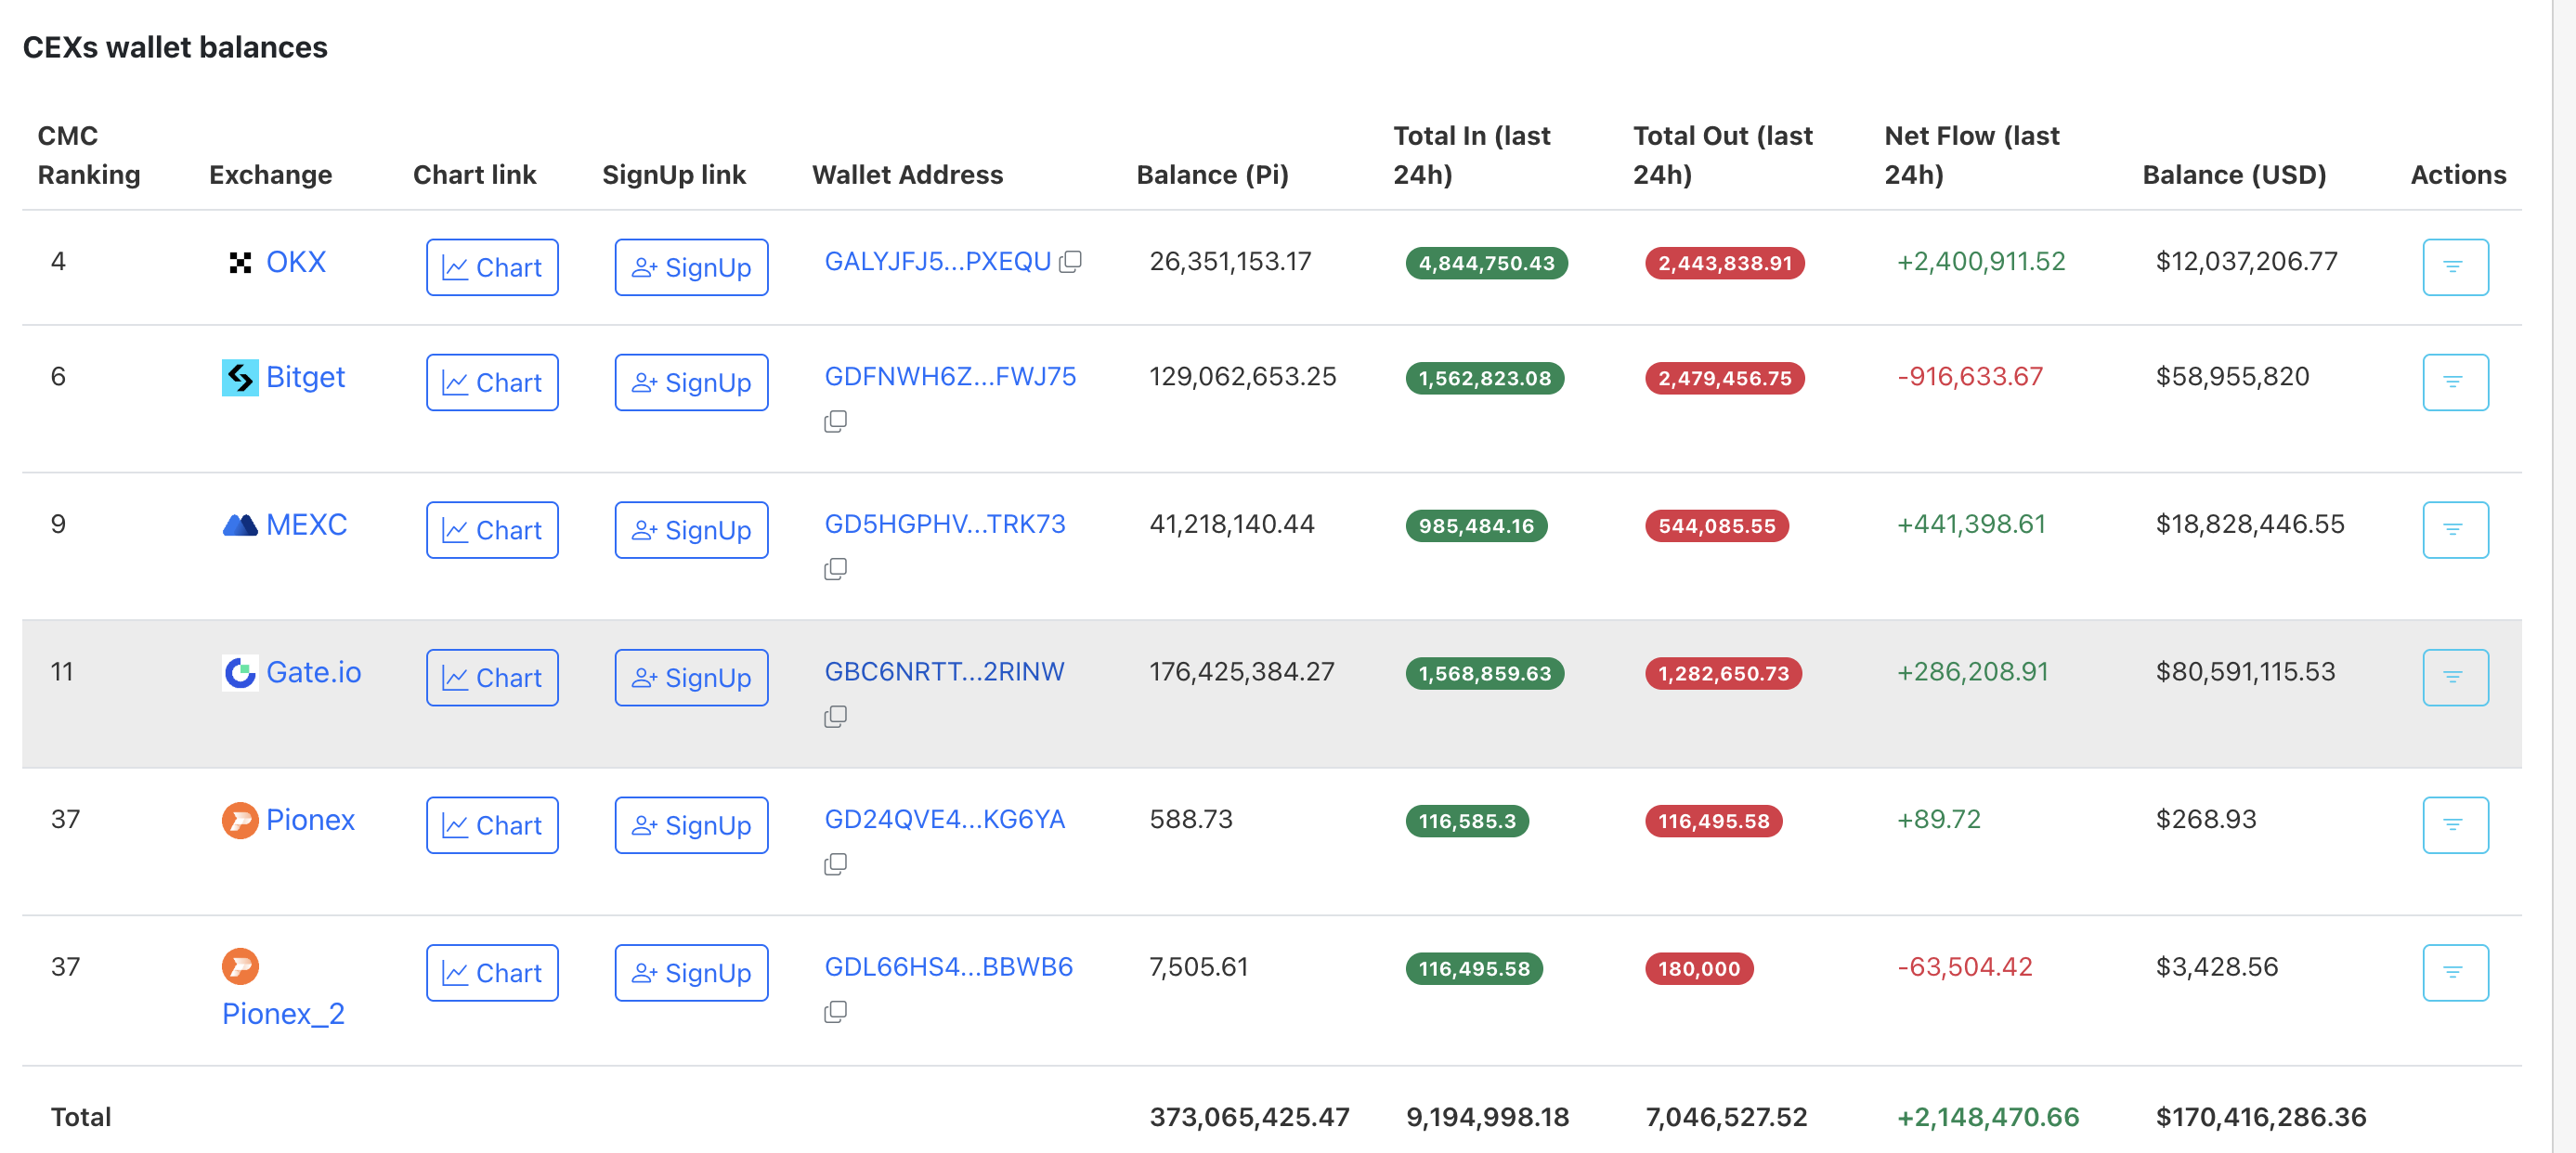
The exchange holdings of Pi Coin have significantly increased over the past two months. The recent surge shows a massive inflow to trading platforms, indicating that holders are preparing to sell rather than hold.
The most recent table shows that net inflows exceed outflows on major CEXs. This is a warning signal for bulls.
Funding Rate Remains Deeply Negative
The funding rate for PI perpetual contracts remains firmly negative. This means that traders holding long positions are paying those shorting PI, signaling a high bearish conviction.
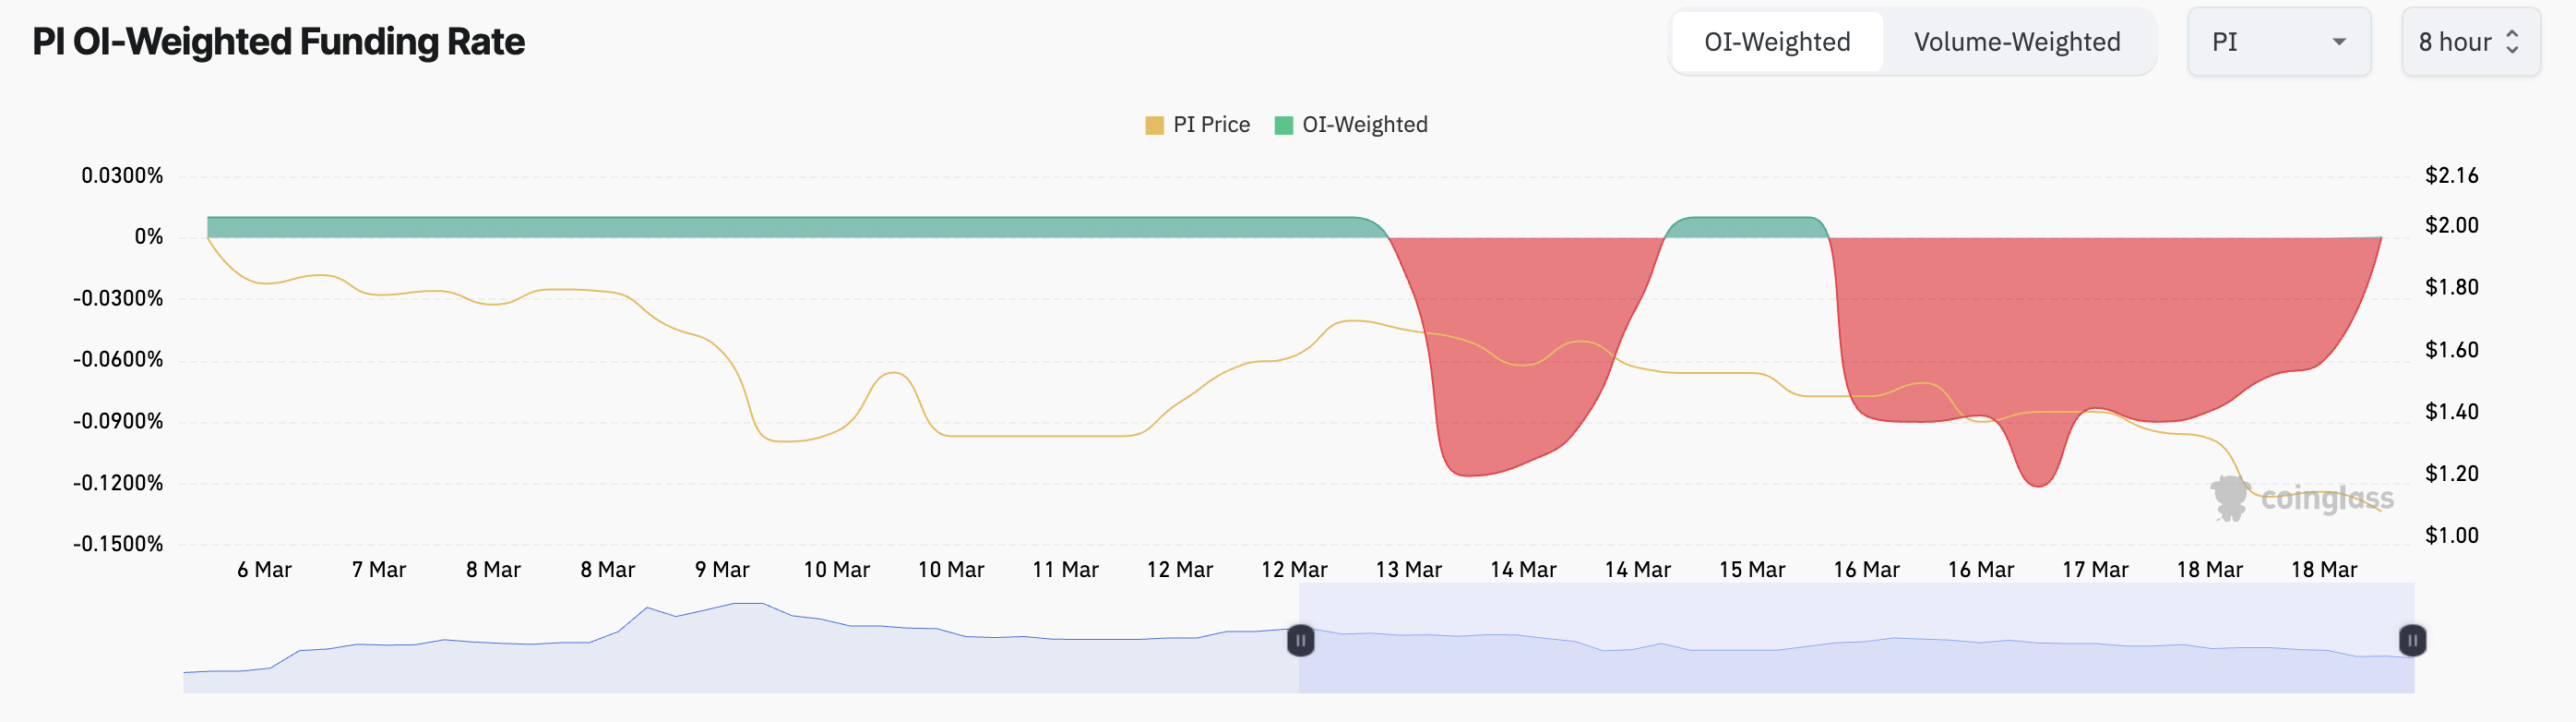
The funding rate reflects the cost of maintaining long and short positions in perpetual futures. Negative readings indicate that traders are primarily maintaining short positions and paying to maintain bearish exposure.
Weak Bullish Market, Not Yet Surrendered
The Elder Ray Index paints a confusing picture. Bulls are mostly quiet, and Bear Power continues to show consistent red bars. However, these bars are appearing without new surges, which could inspire slight optimism.
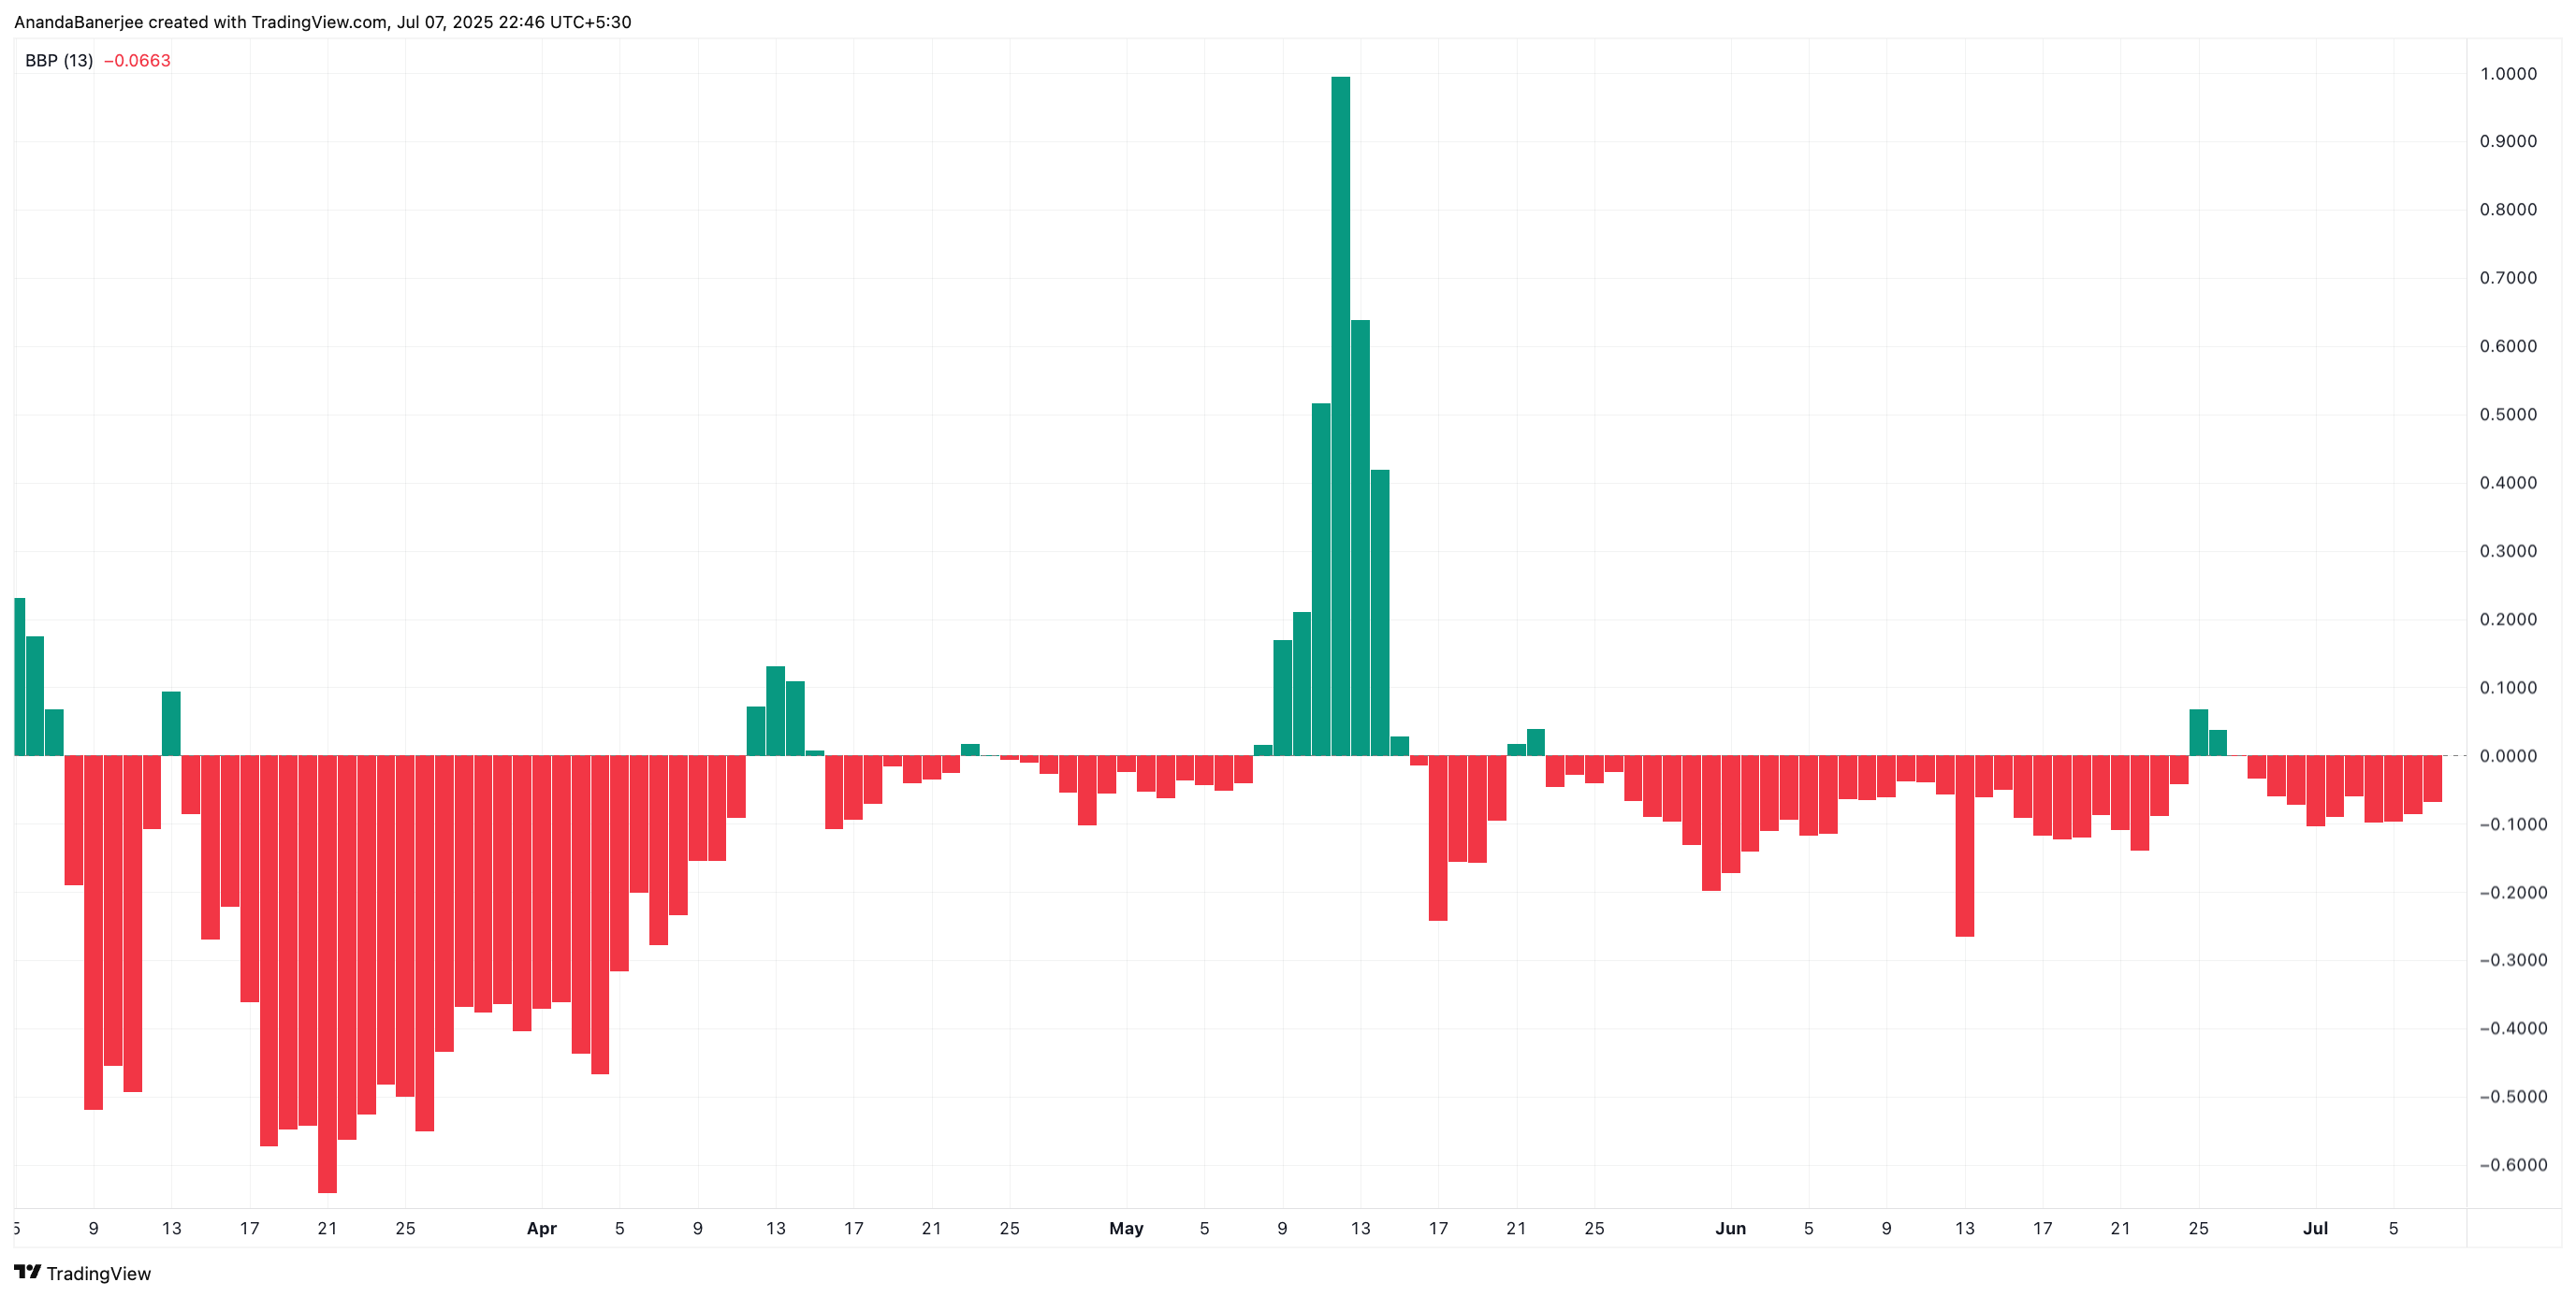
The Elder Ray Index is used to measure the strength of buyers and sellers by comparing price movements to the exponential moving average. For PI, bulls are struggling to maintain momentum.
However, the absence of new bearish surges suggests a standoff rather than a collapse.
Hidden Bullish Divergence... Weak Hope
A glimmer of optimism comes from the Relative Strength Index (RSI). While PI's price records consecutive lower lows, the RSI is recording higher lows. This is a textbook hidden bullish divergence, often indicating that bearish pressure is weakening, even if the price hasn't reacted yet.
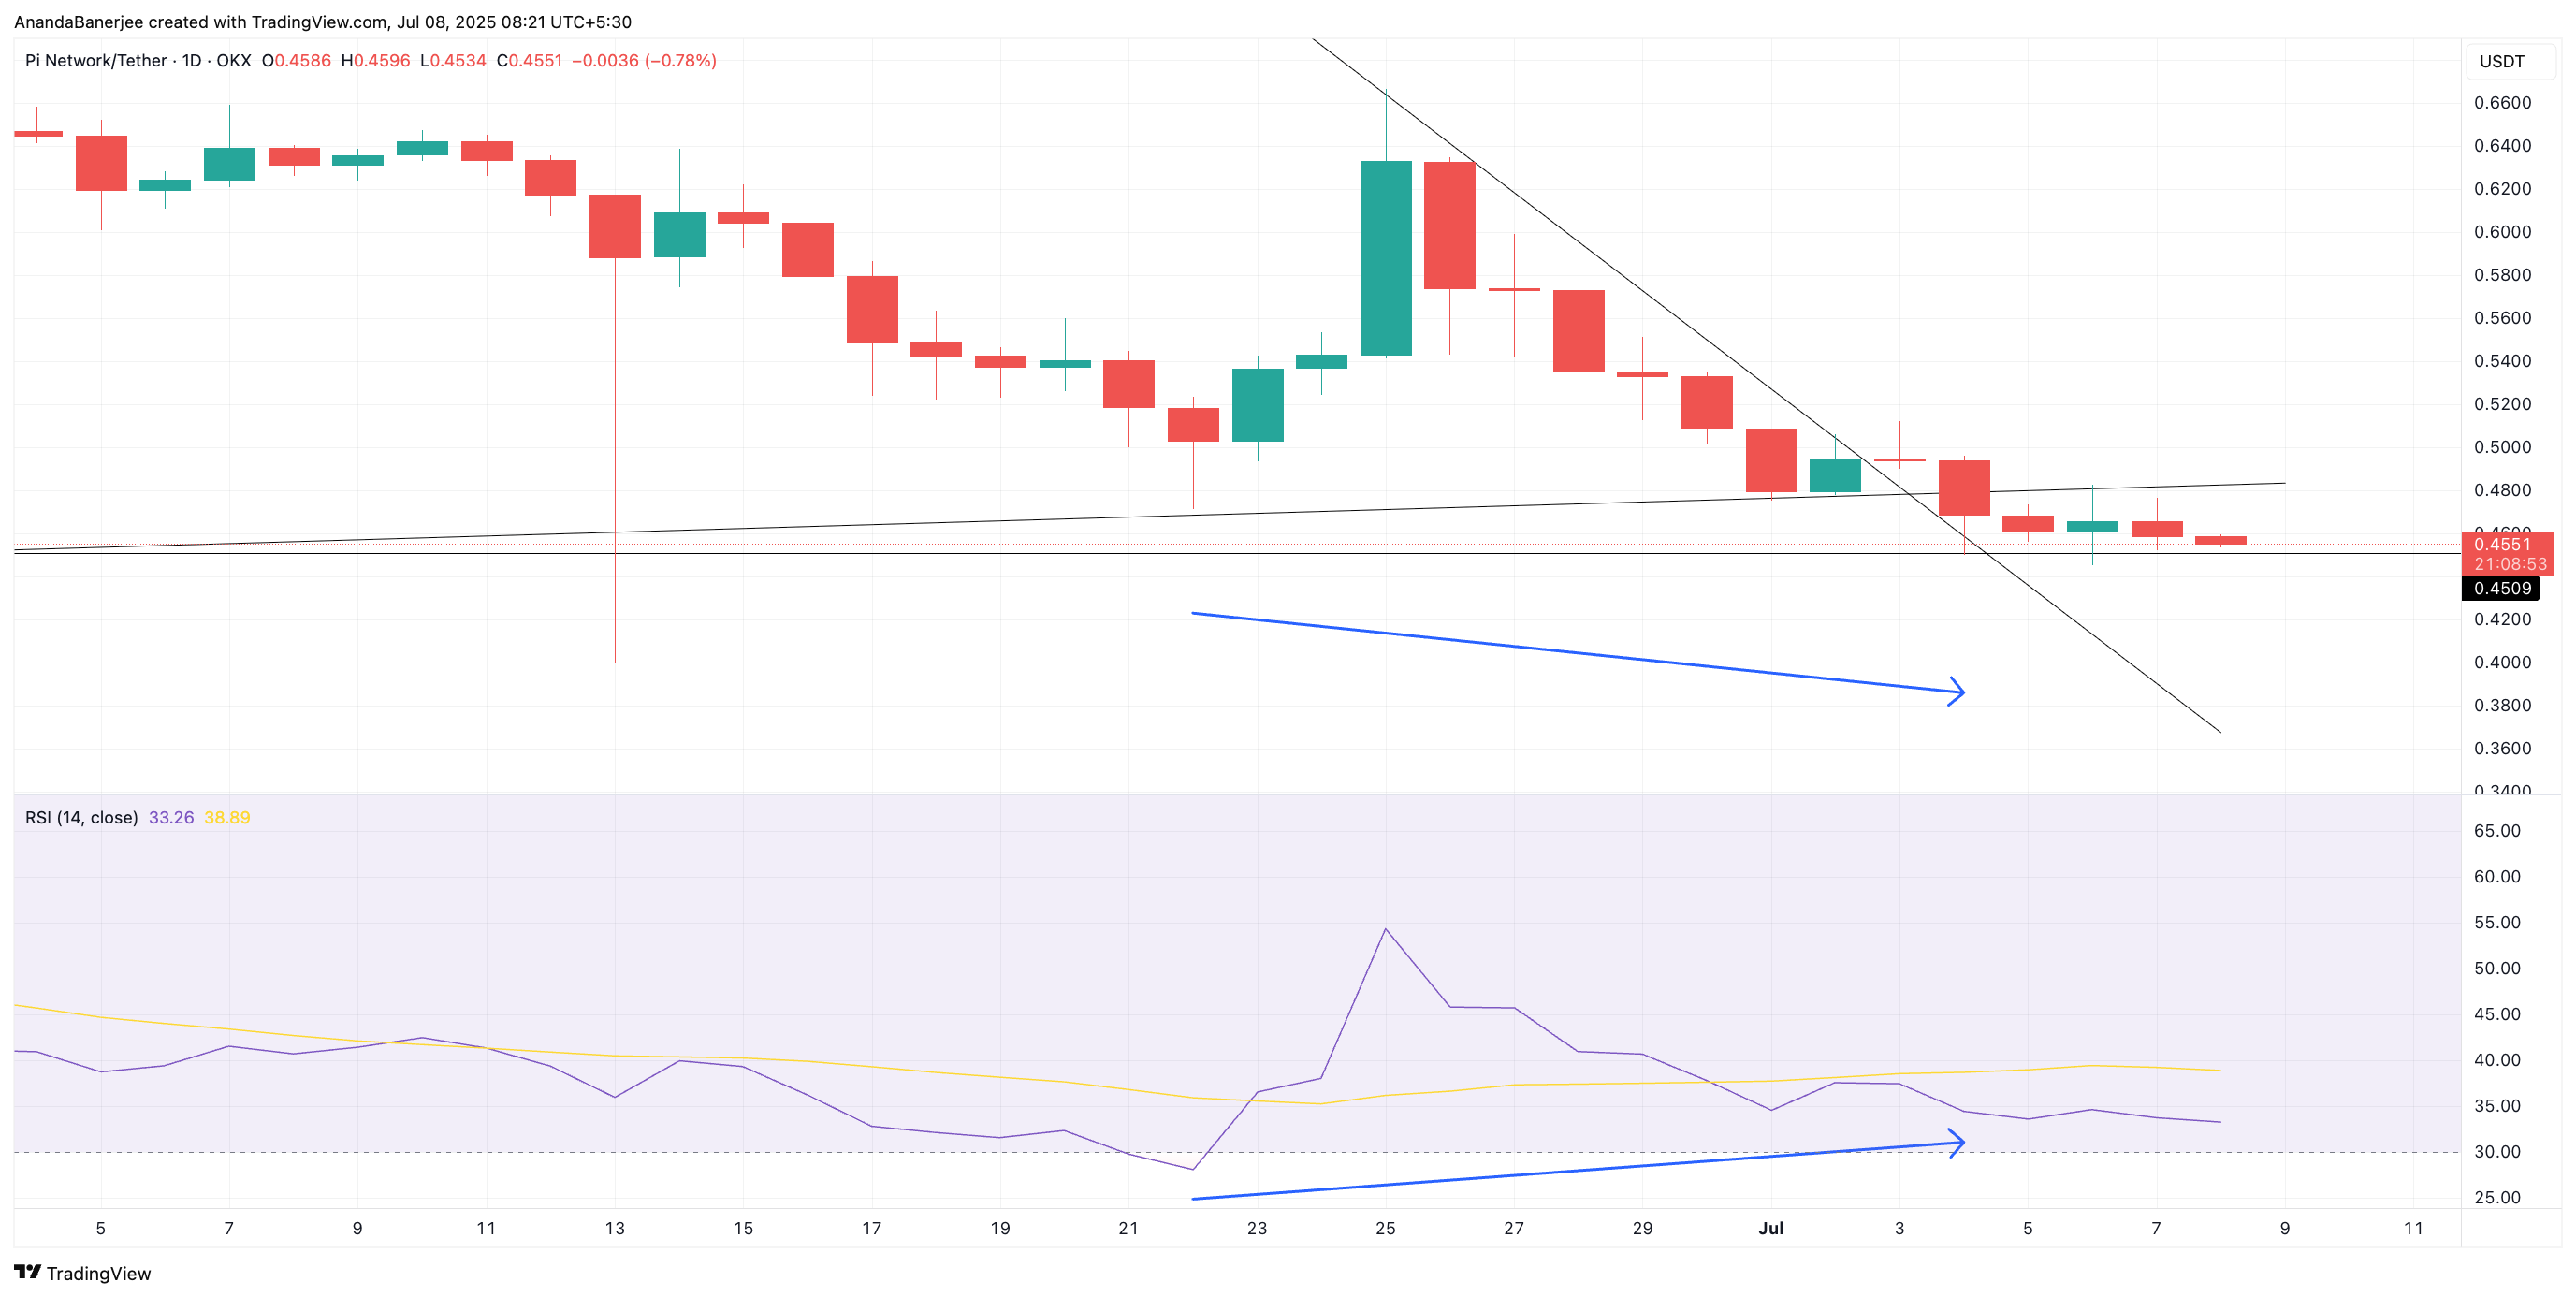
The Relative Strength Index tracks momentum. When price declines but RSI rises, a hidden bullish divergence occurs, often indicating an upcoming reversal.
If this divergence materializes, key resistance zones are $0.4797 and $0.5152. A definitive breakthrough above these levels could open a path to $0.60. The Fibonacci indicator drawn from the last prominent swing low to the last prominent swing high provides additional resistance levels at $0.5037, $0.5347, and $0.5657.
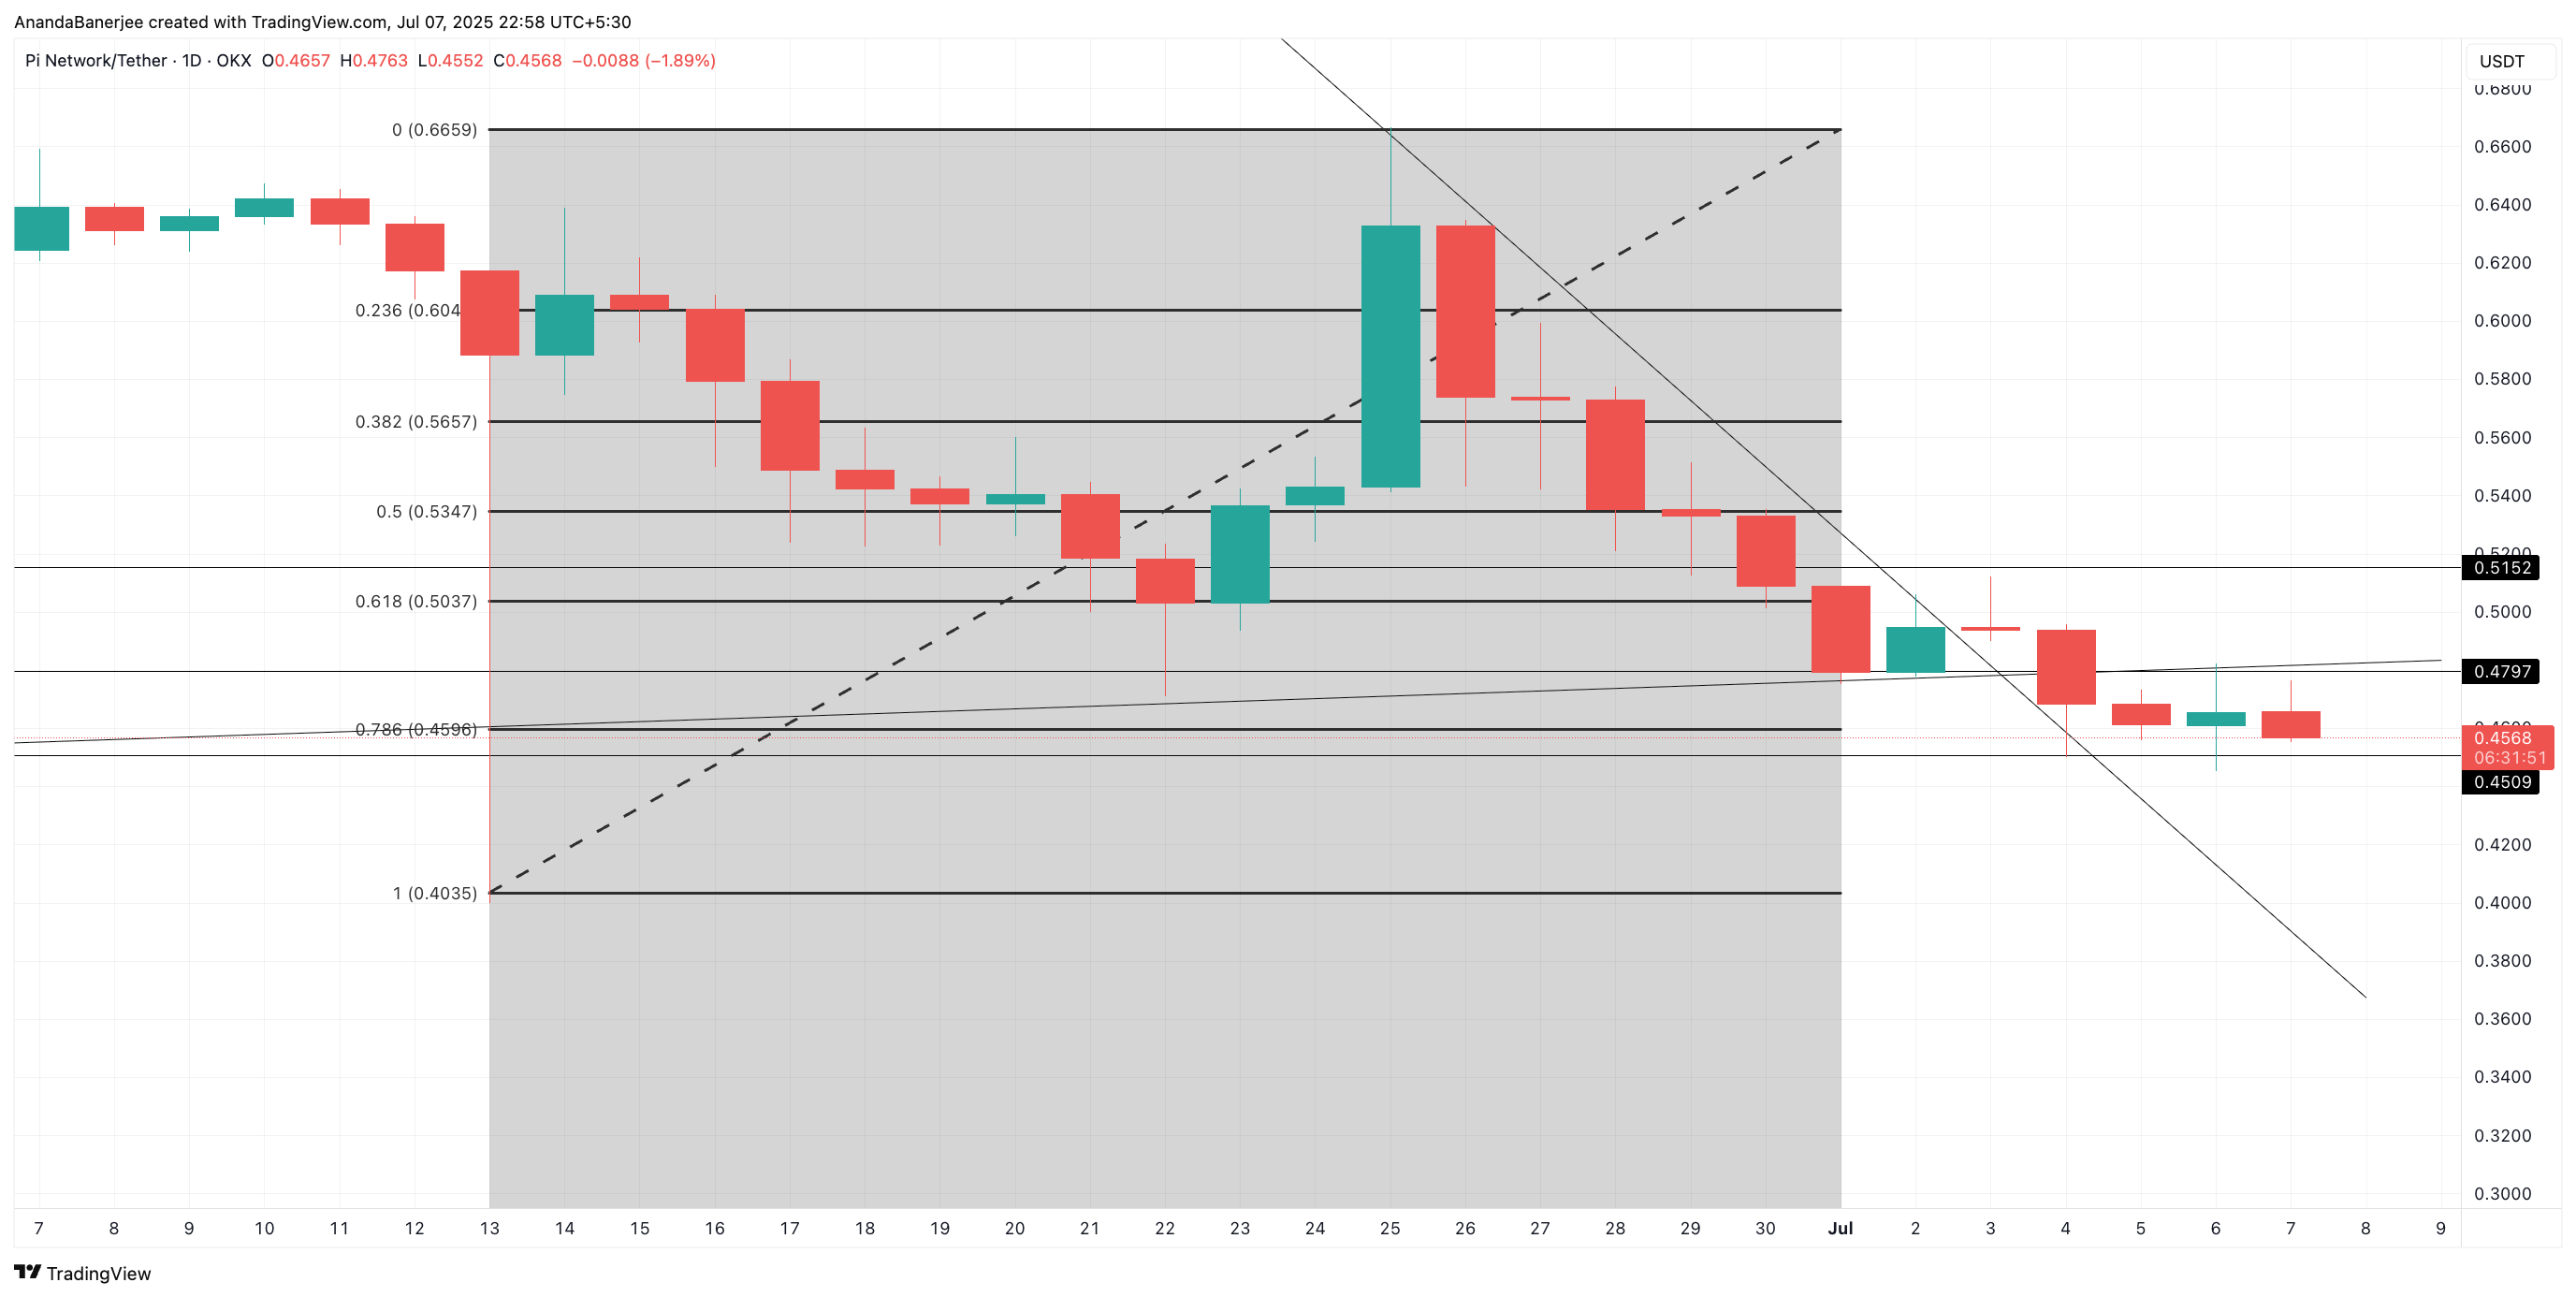
The Fibonacci indicator is drawn from major price swings and maps potential support and resistance levels based on proportional retracement zones.
However, if PI price falls below the $0.4035 support zone, the entire bullish logic could collapse, making it likely for PI to enter a deeper correction.