

Ethereum price rose by 3.57% weekly, trading near $2,540, with discussions intensifying about a return to $5,000.
However, on-chain and volume indicators are not particularly positive. ETH price reached an all-time high of $4,891 in November 2021. Now, almost 4 years later, many signals suggest that the next rise may not be as close as investors expect.
Developer activity noticeably decreased since mid-May
The most immediate warning sign is development activity.
Since mid-May, Ethereum's development contribution, tracked by the number of code commits and updates through major repositories, has decreased from 71 to 25, according to sentiment data.
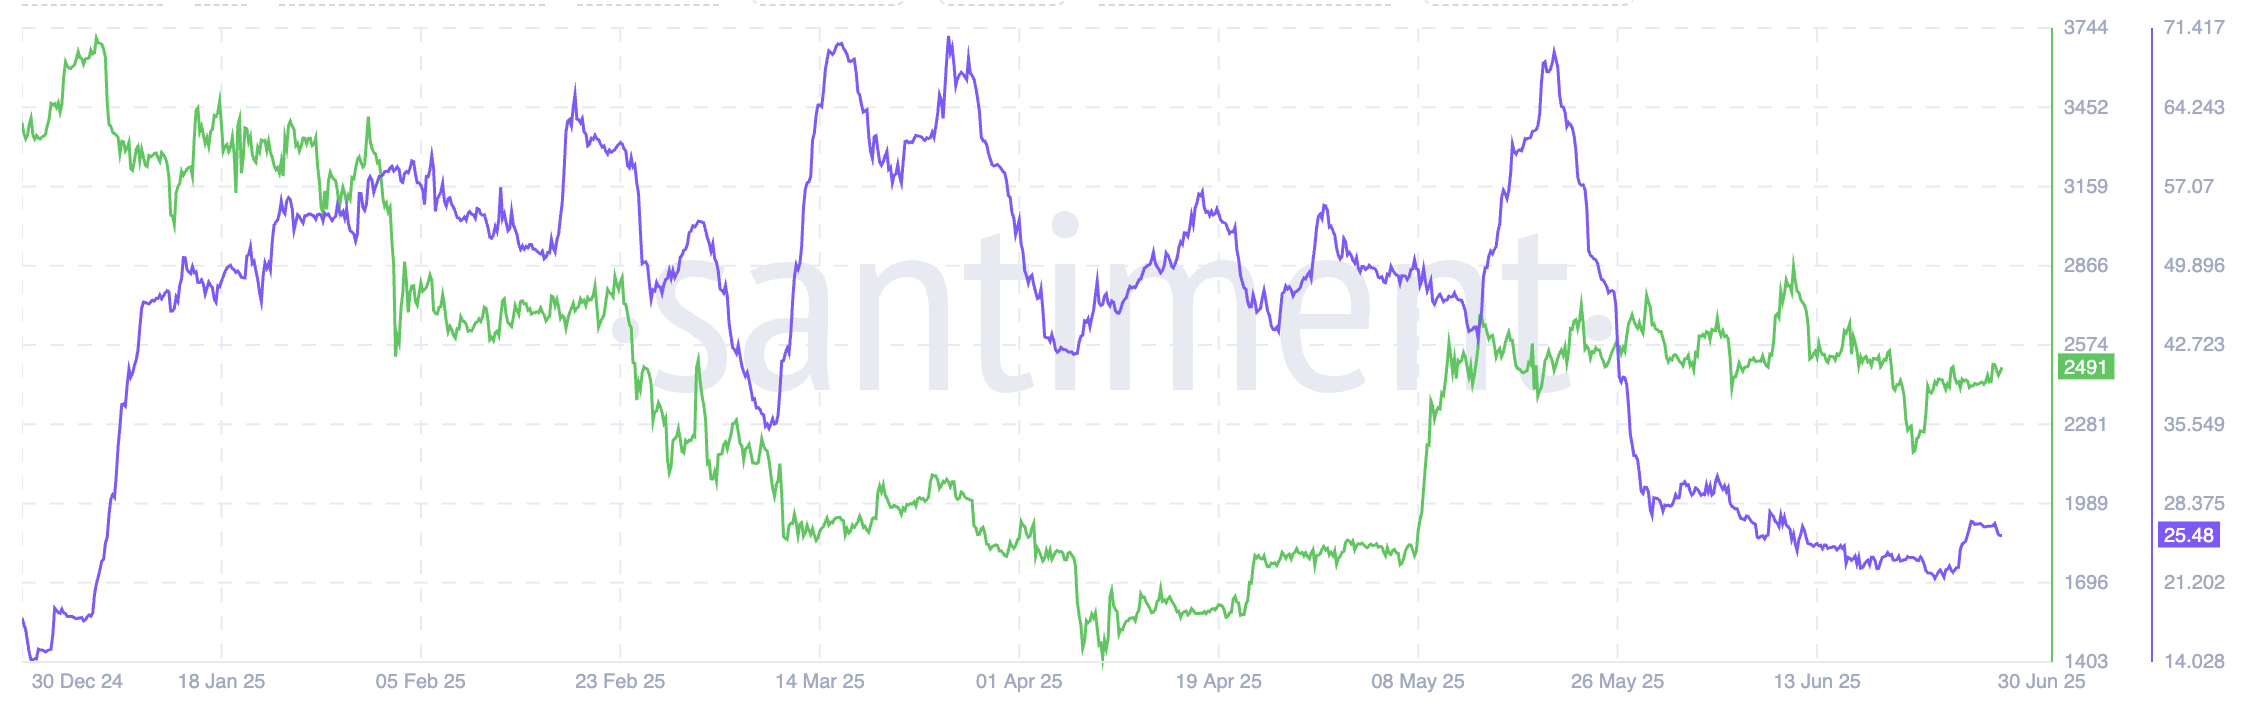
This represents approximately a 65% decrease in developer engagement while the price continues to rise. This disparity indicates that core protocol innovation and on-chain growth are lagging behind market interest. Particularly, the development activity surge in December 2024 did not trigger a price increase, adding to the caution.
If Ethereum's base layer does not actively evolve, it will limit long-term price justification and raise questions about short-term $5,000 optimism.
HODL Wave signals weakening long-term confidence
The HODL Wave, which groups holdings by wallet holding periods, shows another concerning trend. The percentage of ETH held in long-term addresses (addresses holding for over 6 months) has decreased even during recent price increases.
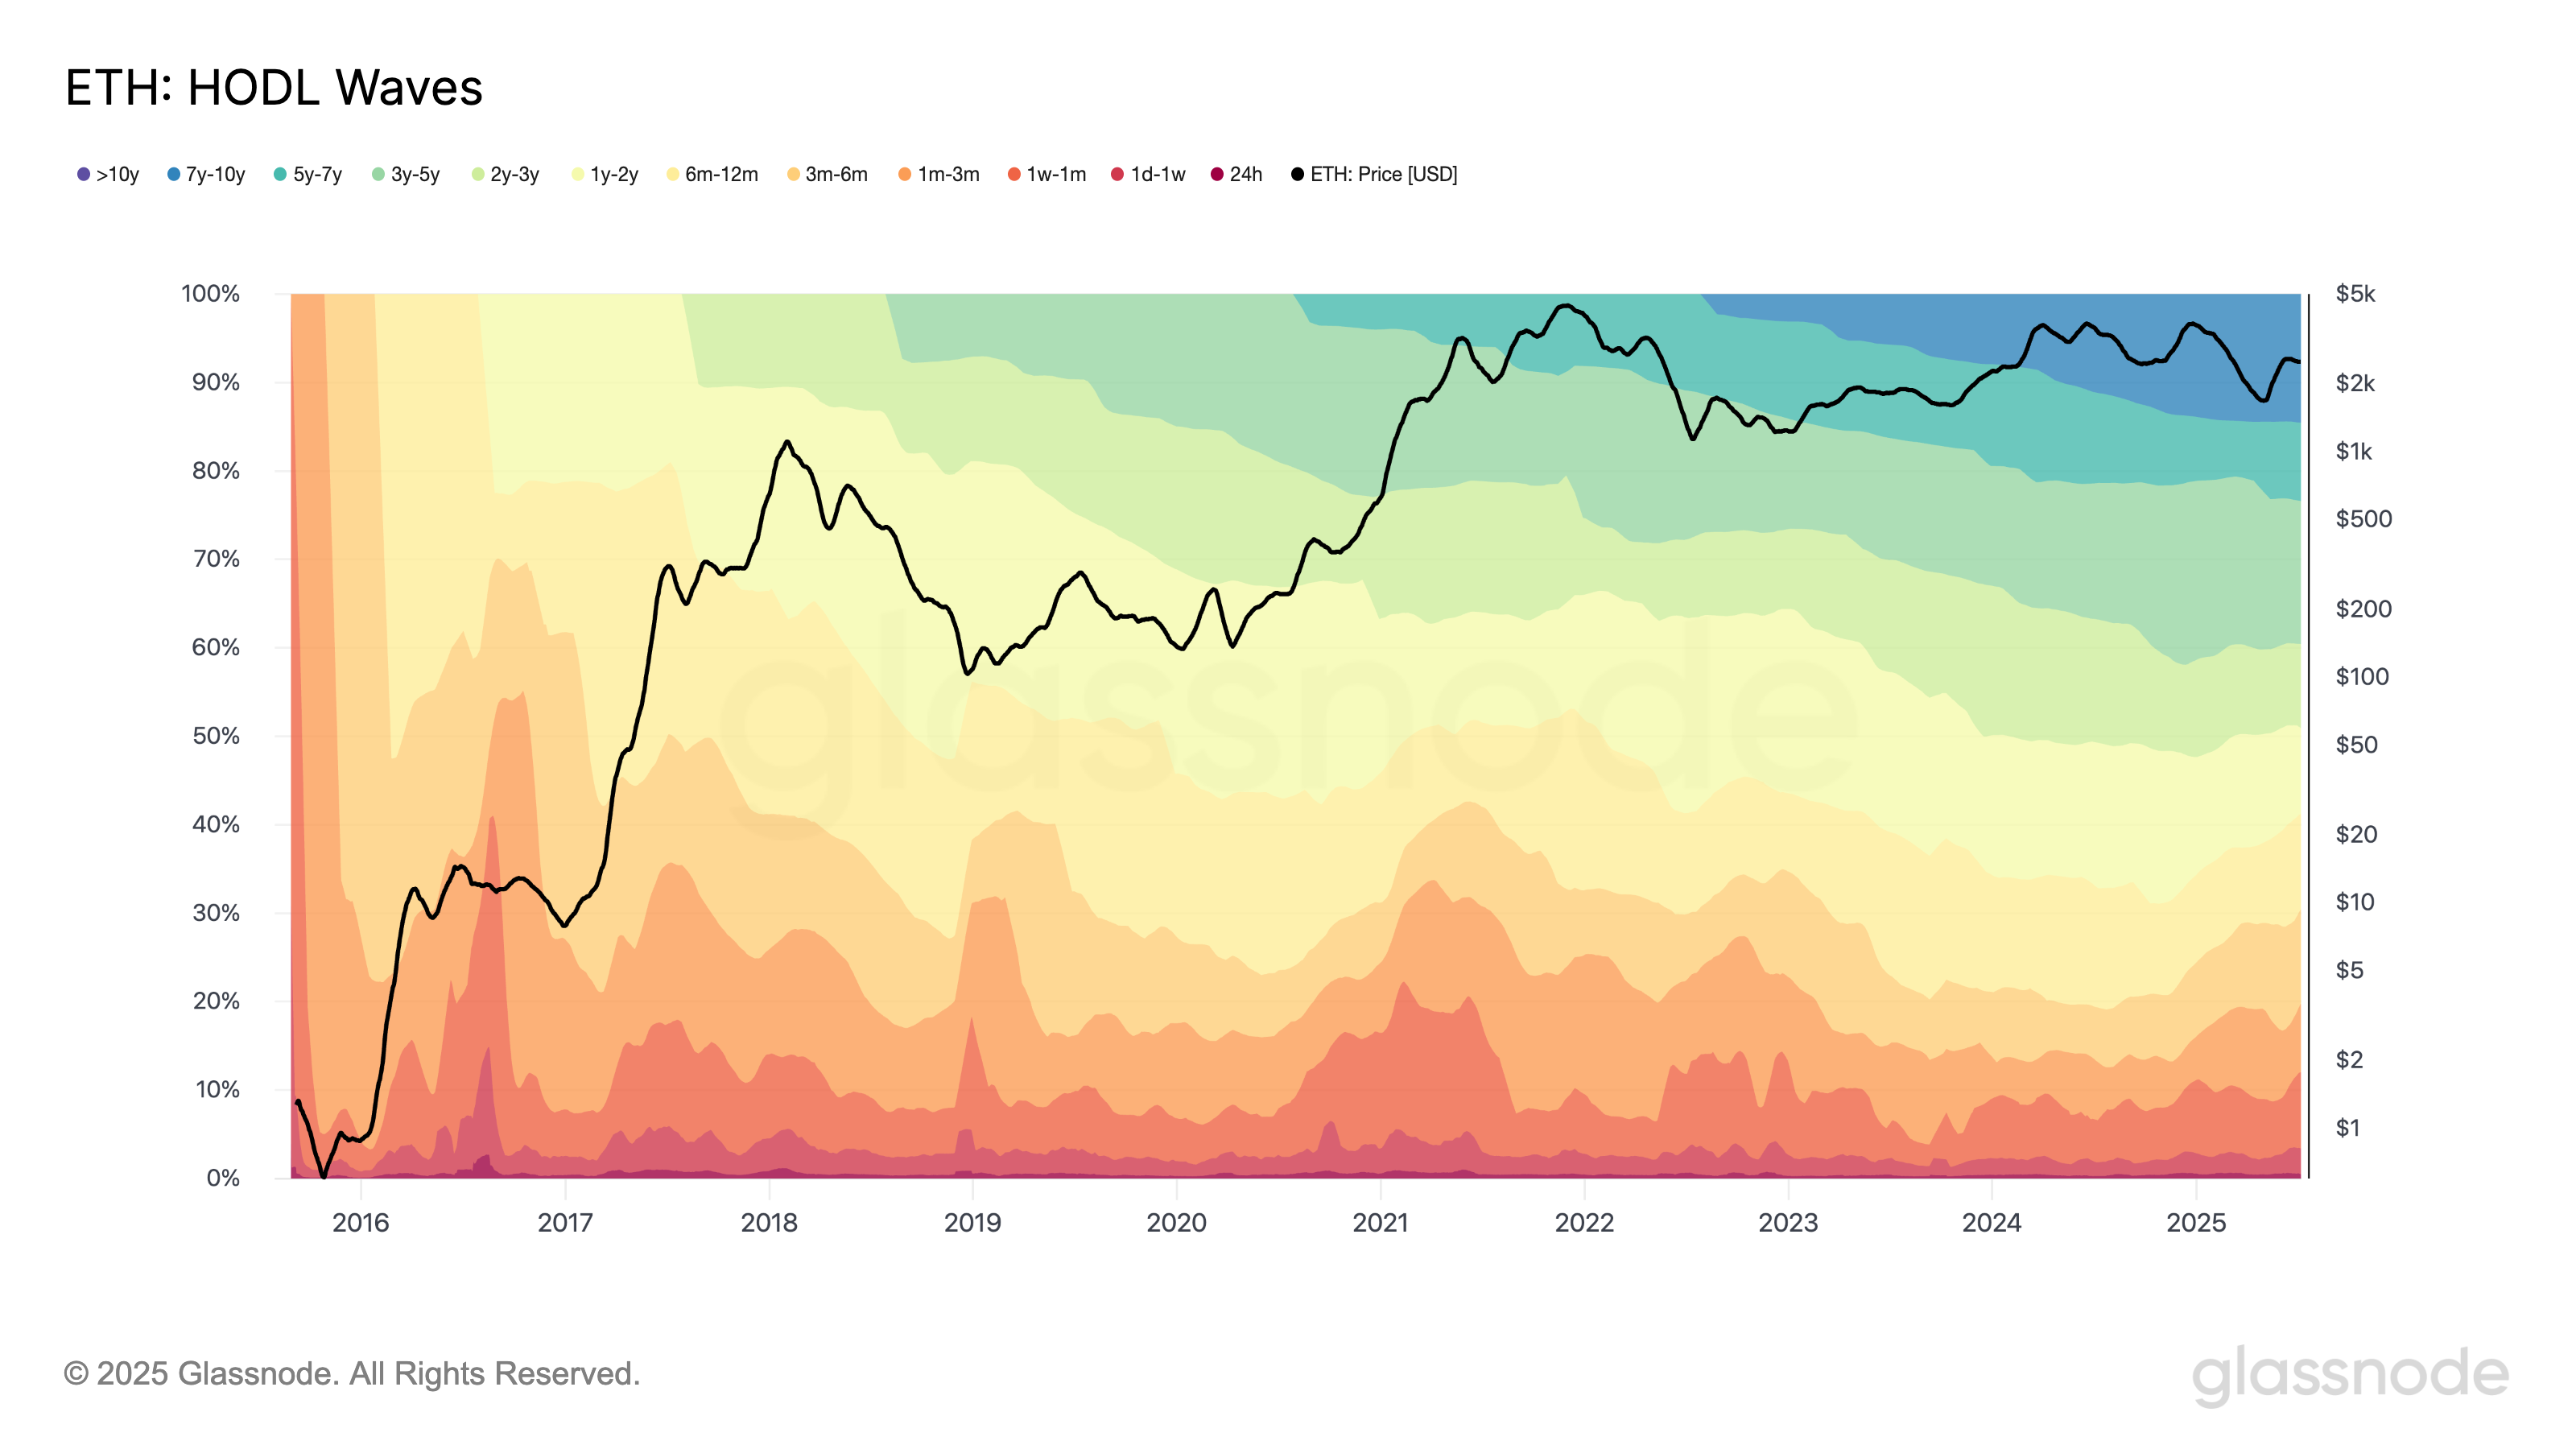
Most ETH is currently located in the 1-6 month holding band, suggesting recent buyers and potential swing traders. Compared to previous price surges where the group holding for over a year dominated the wave, this structure reflects weak conviction. This indicates many ETH holders may leave if the price fails to break resistance.
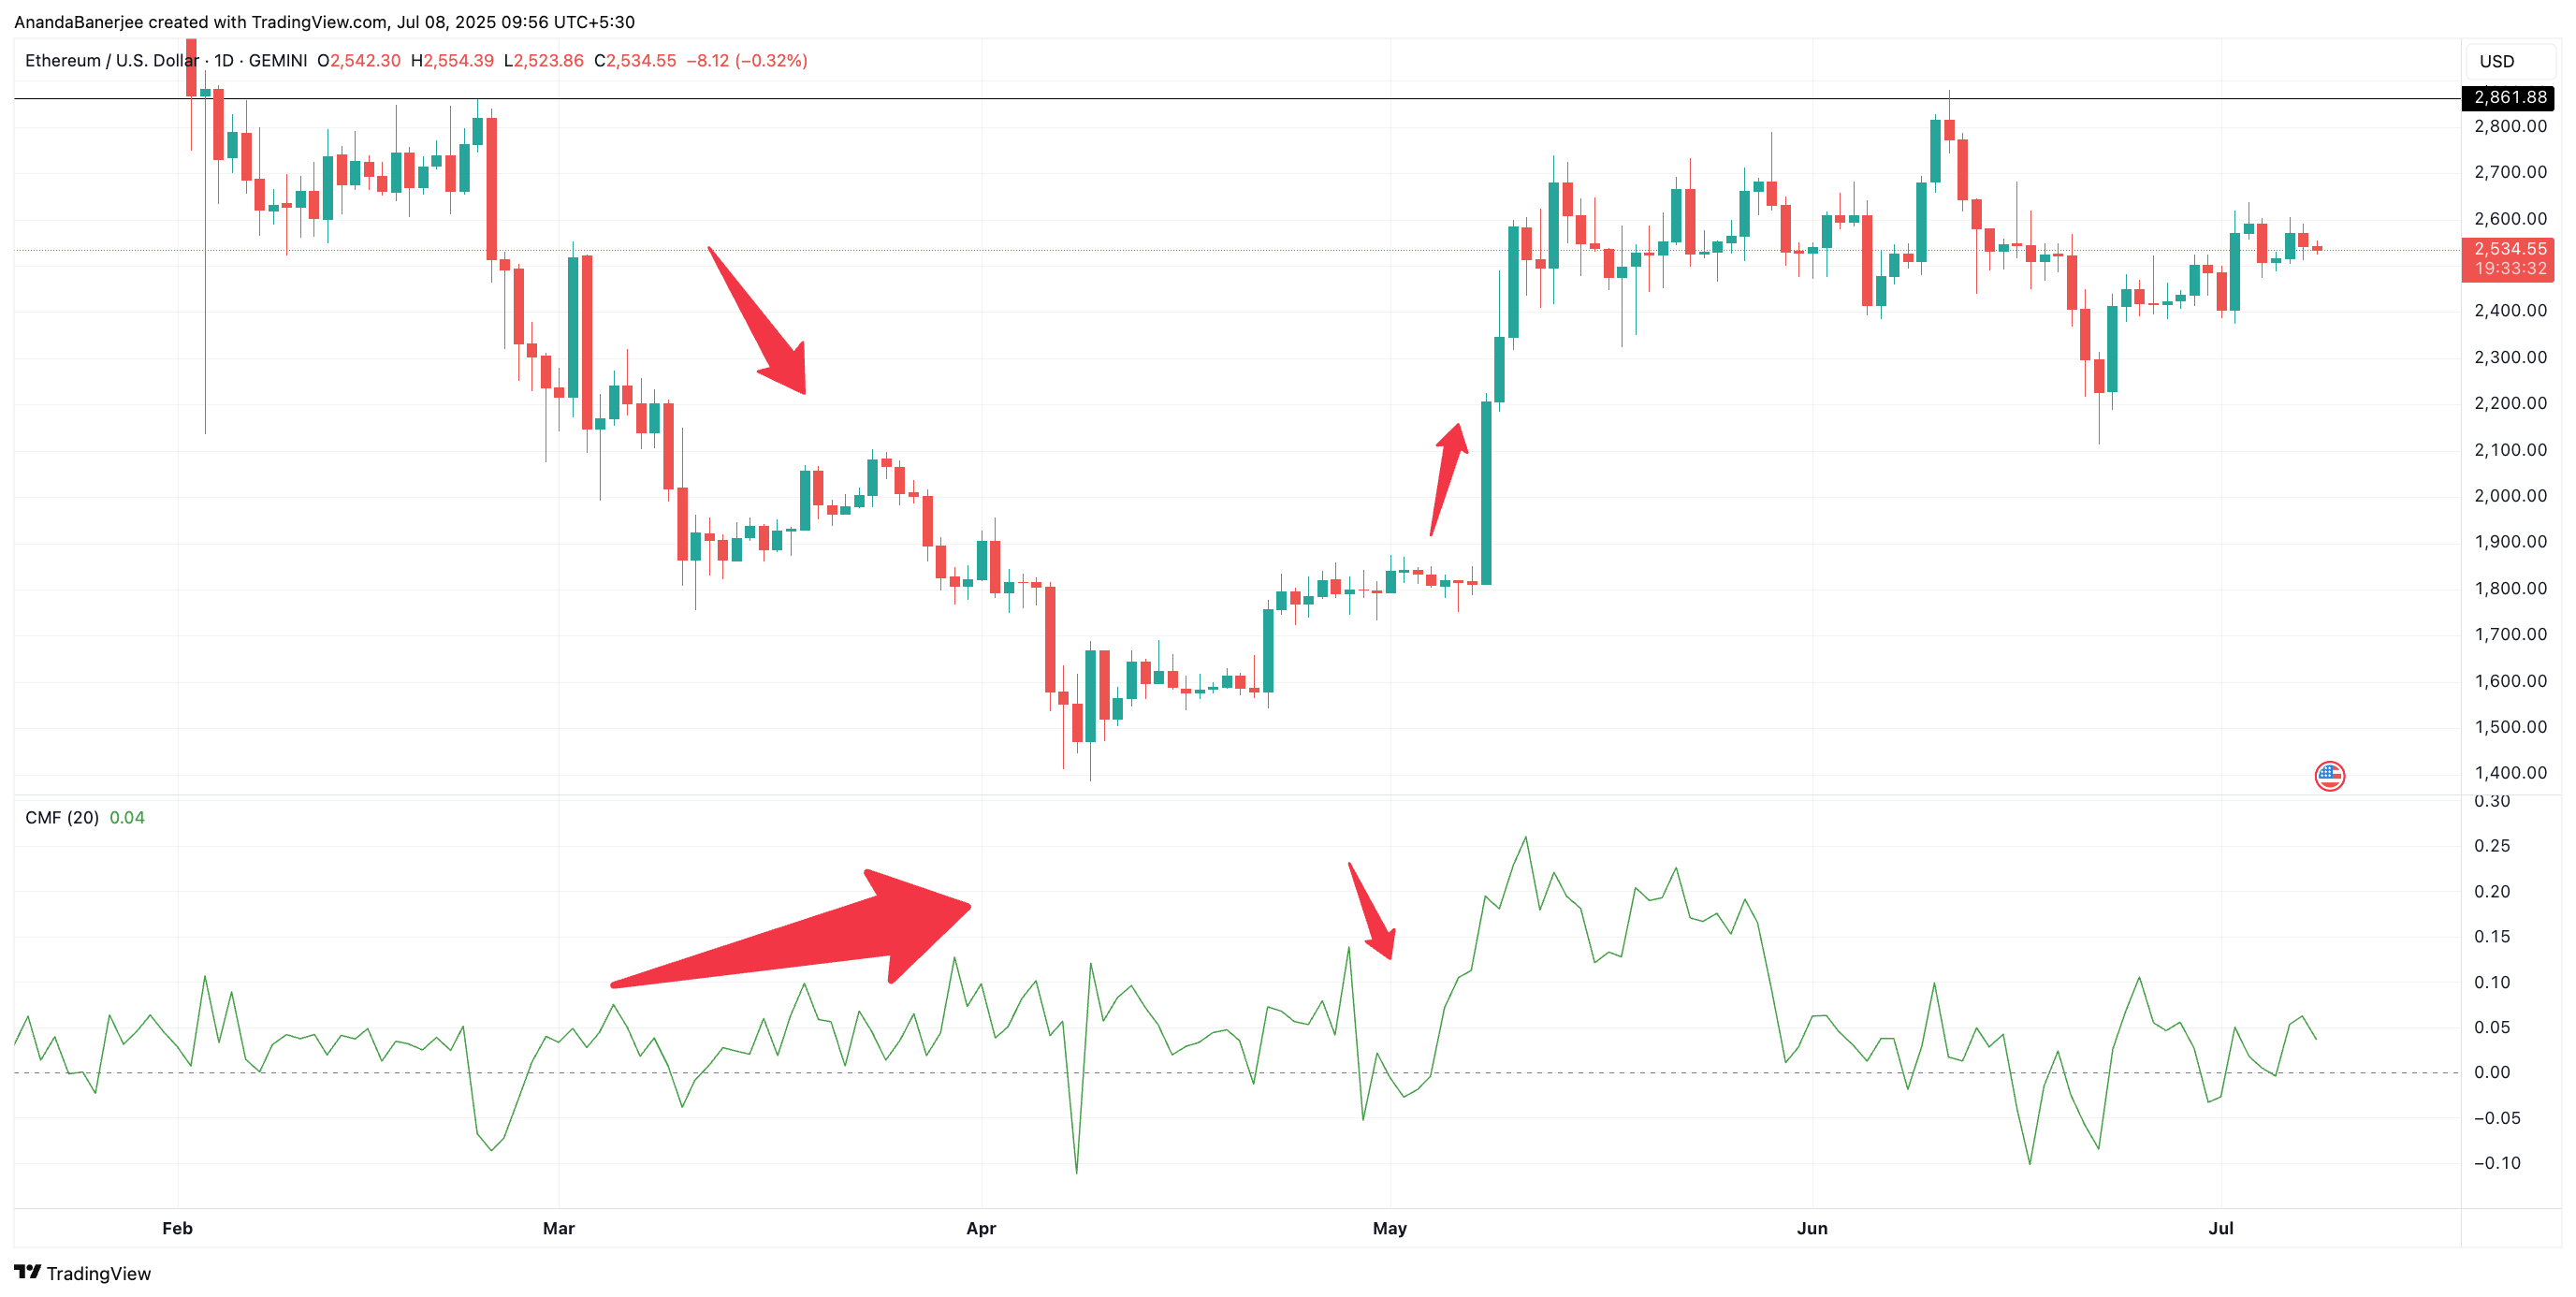
CMF shows smart money waiting
The Chaikin Money Flow (CMF), which tracks volume-weighted accumulation, has flattened after a short surge in April-May. This coincided with Ethereum rising from $1,300 to $2,700. Since then, it has not exceeded 0.10, indicating that meaningful buying pressure has stopped.
Price structure still facing strong resistance
Ethereum is currently struggling to break through the $2,647 resistance line. It may be pushed back to support levels at $2,491 and $2,467. If the price falls below $2,467, it could potentially drop to $2,376.
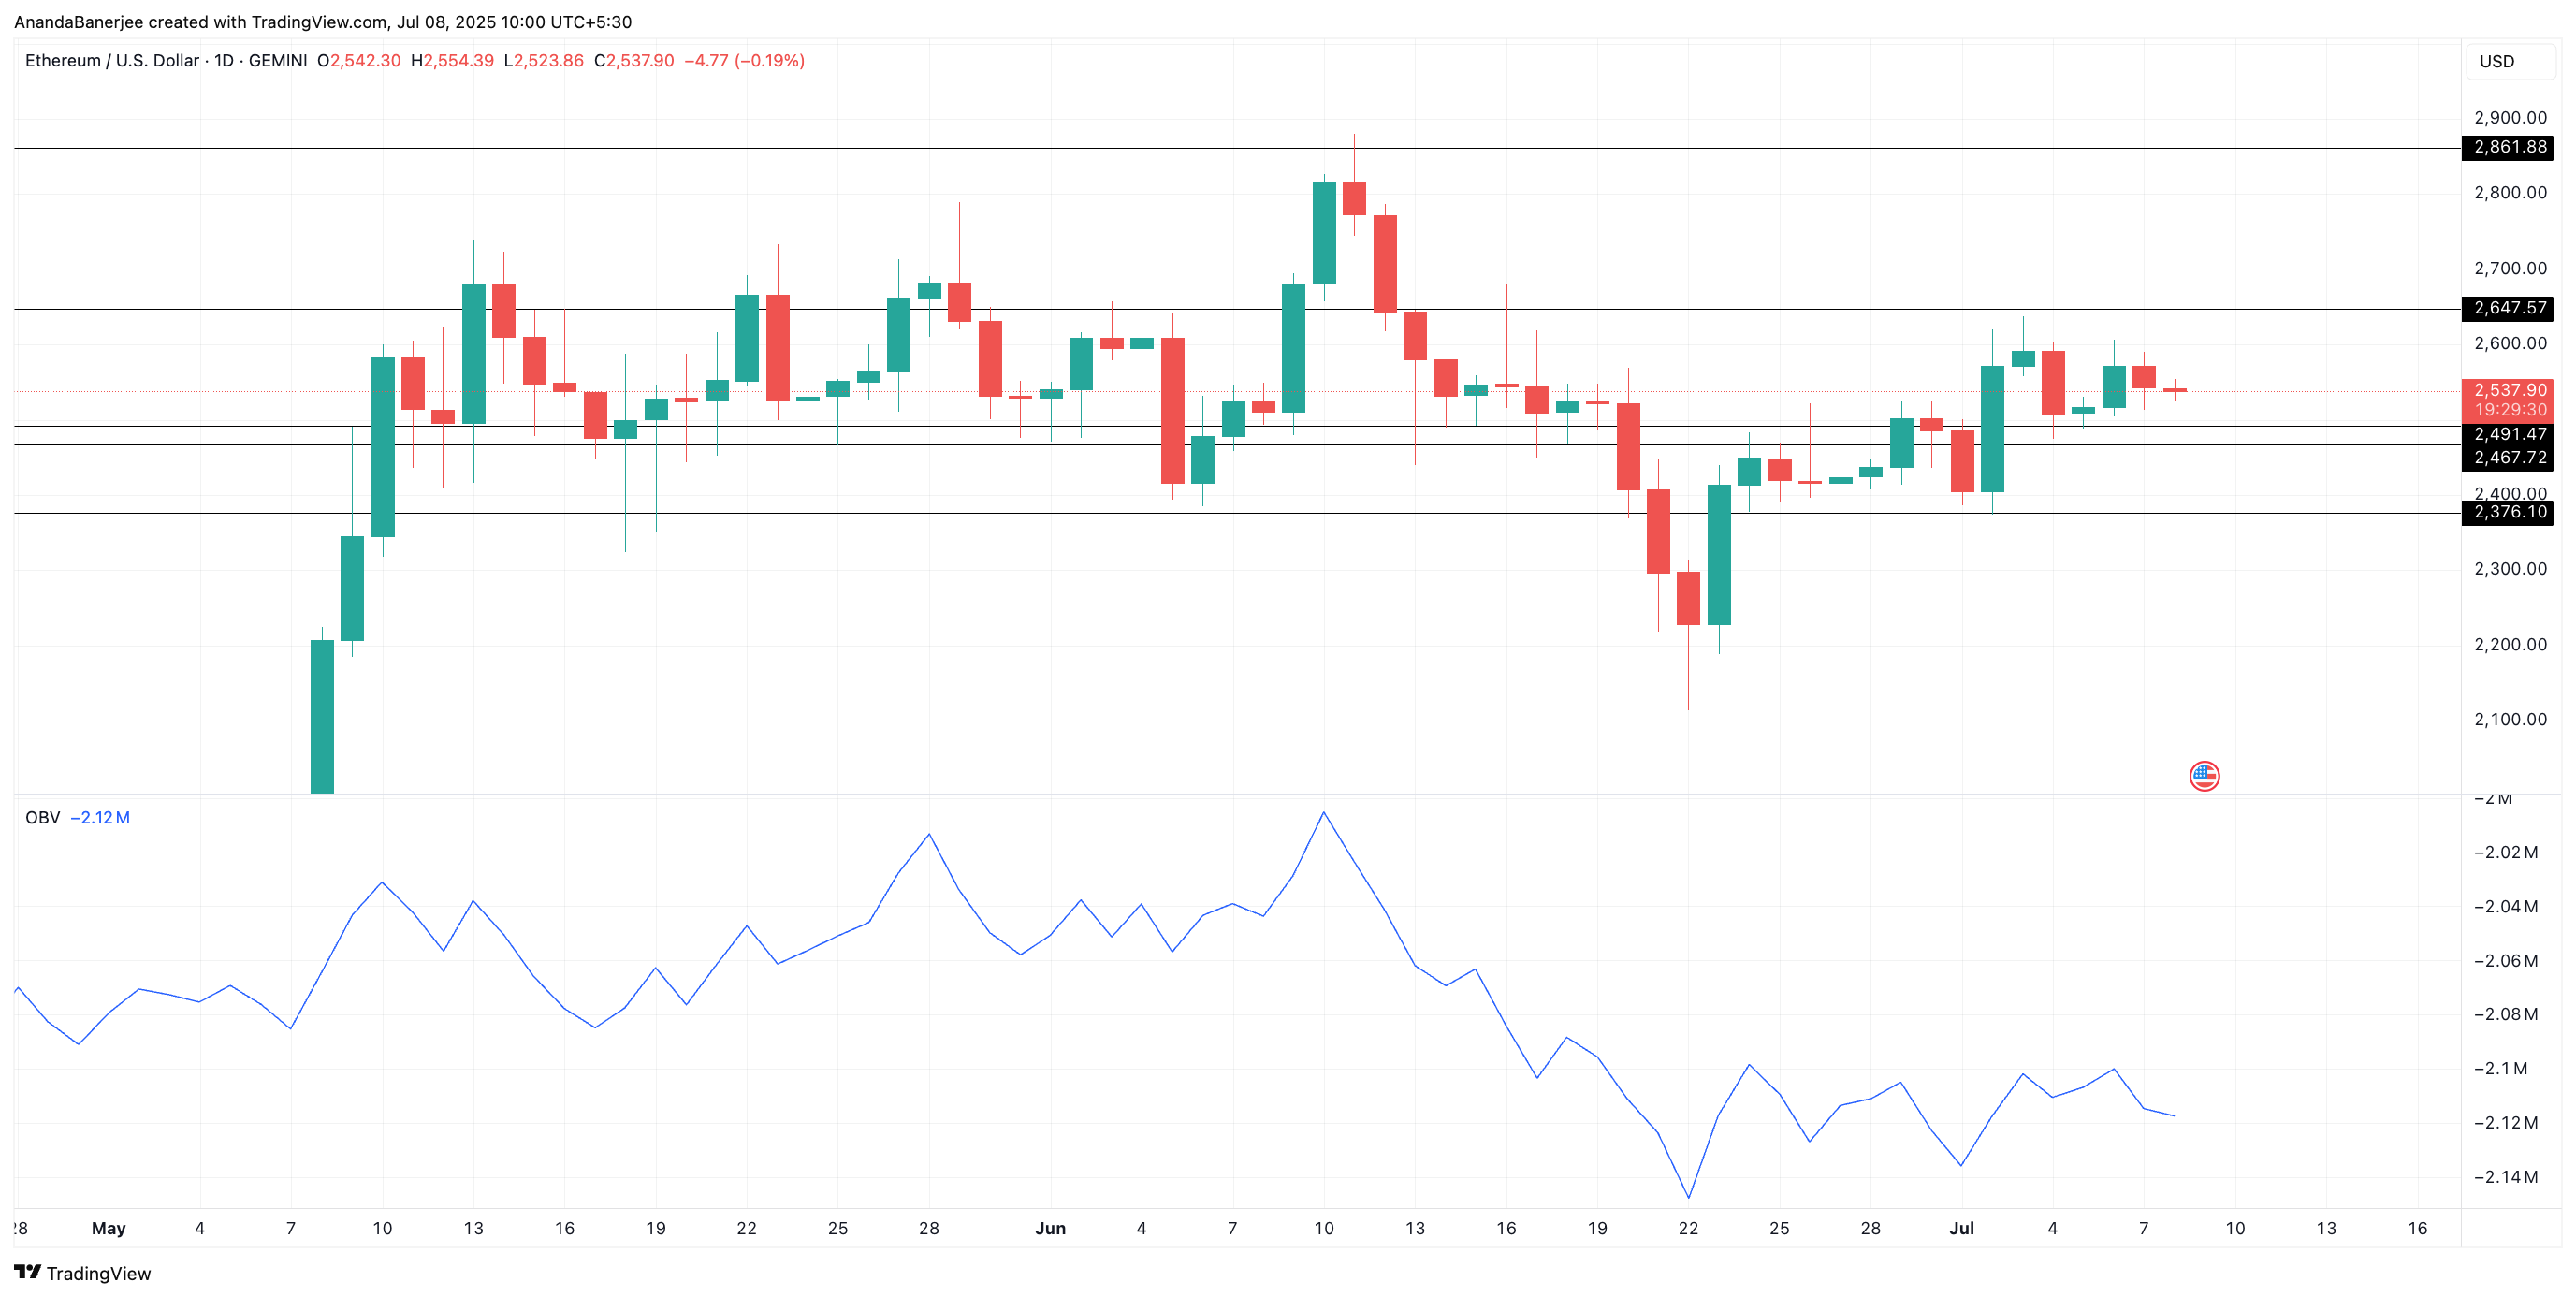
Meanwhile, On-Balance Volume (OBV), which adds or subtracts volume based on price direction, is trapped in a narrow range below -2.12 million. The lack of participation from whales and large wallets raises questions about structural support at current levels, especially for a price of $5,000 per coin.
Without strong OBV or CMF indicators, the $2,861 level will act as a firm resistance zone. Considering these points, $5,000 feels more like a psychological headline than a feasible next target.
However, if Ethereum converts $2,647 to support, it could bring another upward momentum. This is a level clearly visible on the current chart, and it is necessary to break through ETH $2,800.


