

Pi Network indicates increasing selling pressure and weakening upward momentum by converting the 0.47 dollar level from support to resistance.
The token is under strong downward pressure, and experienced investors are losing confidence in short-term price recovery.
Pi Falling Cloud on Ichimoku Chart Grows and Darkens
According to the readings on the PI/USD daily chart, the altcoin has not broken through this price level since closing at 0.46 dollars on July 4th. The previous support line has now been converted to a resistance zone, and PI is struggling to break through as demand decreases.
Pi's long-term downtrend has significantly pushed the price below the leading span A and B of the Ichimoku chart, reflecting the bearish sentiment among holders. These lines now form dynamic resistance levels at 0.51 and 0.63 dollars above PI's price.
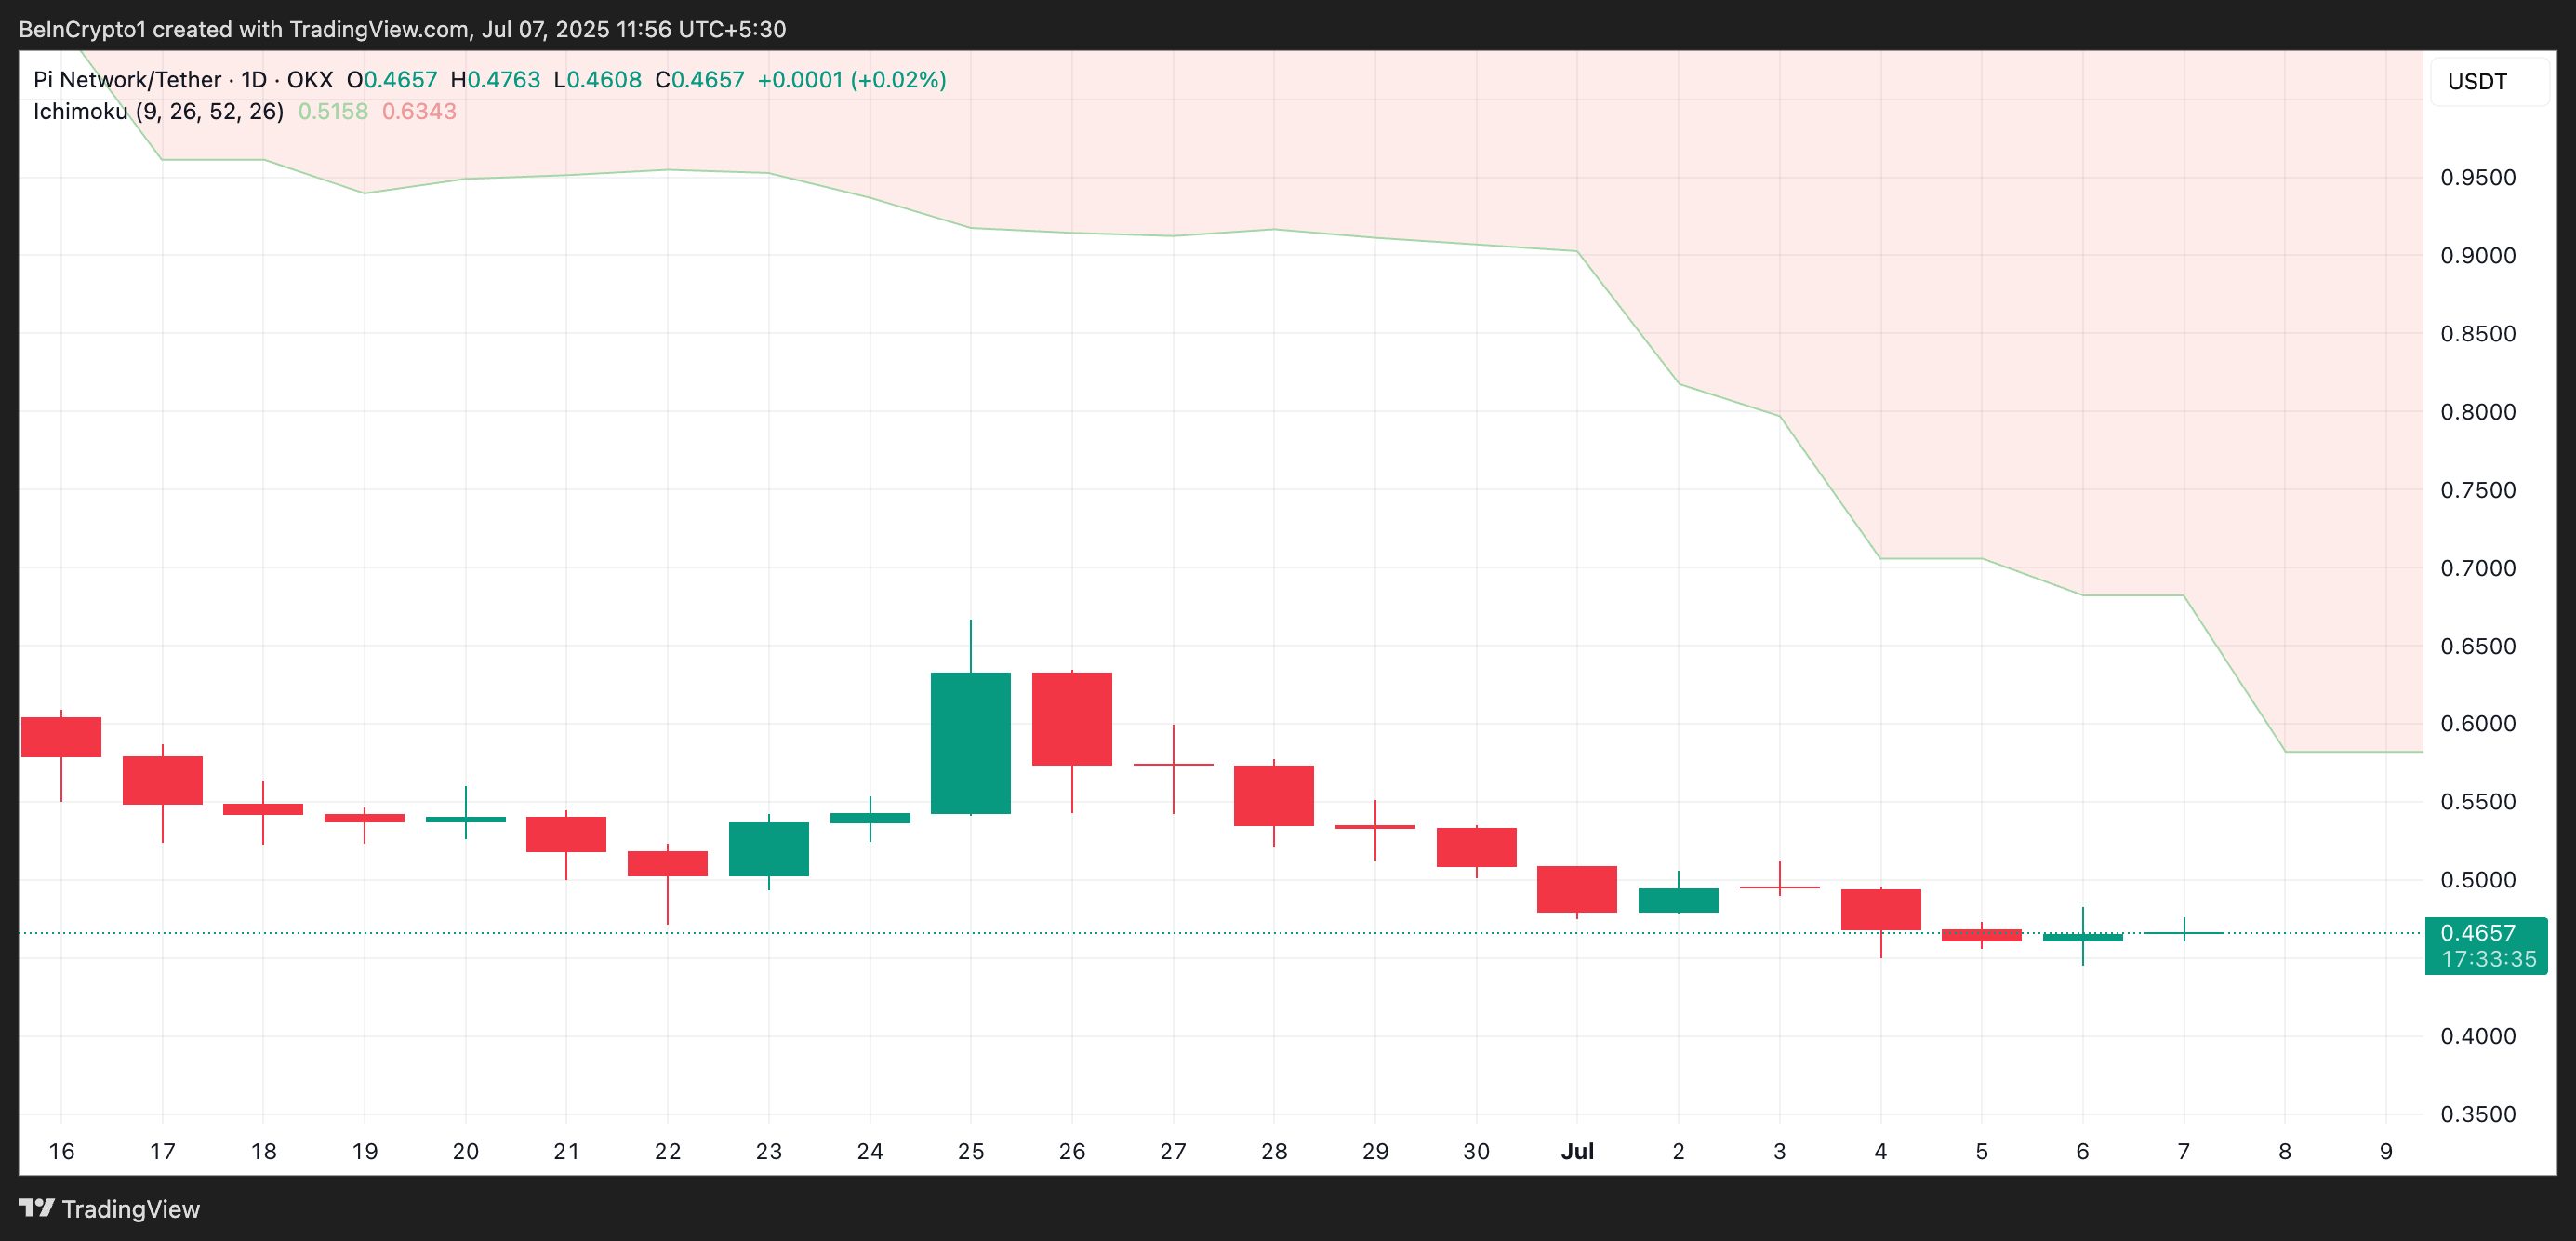
The Ichimoku chart tracks the market trend momentum of an asset and identifies potential support/resistance levels. When an asset trades above these levels, the price is in a strong upward trend. The area above the cloud is the bullish zone, indicating positive market sentiment.
However, when an asset's price falls below the cloud, like PI, it indicates a strong downward trend. This means sellers are dominating the market and the upward momentum is limited.
Additionally, PI's Smart Money Index (SMI) has been continuously declining since June 25th. At the time of writing, this index is at 1.22 and has fallen by 9% since then.
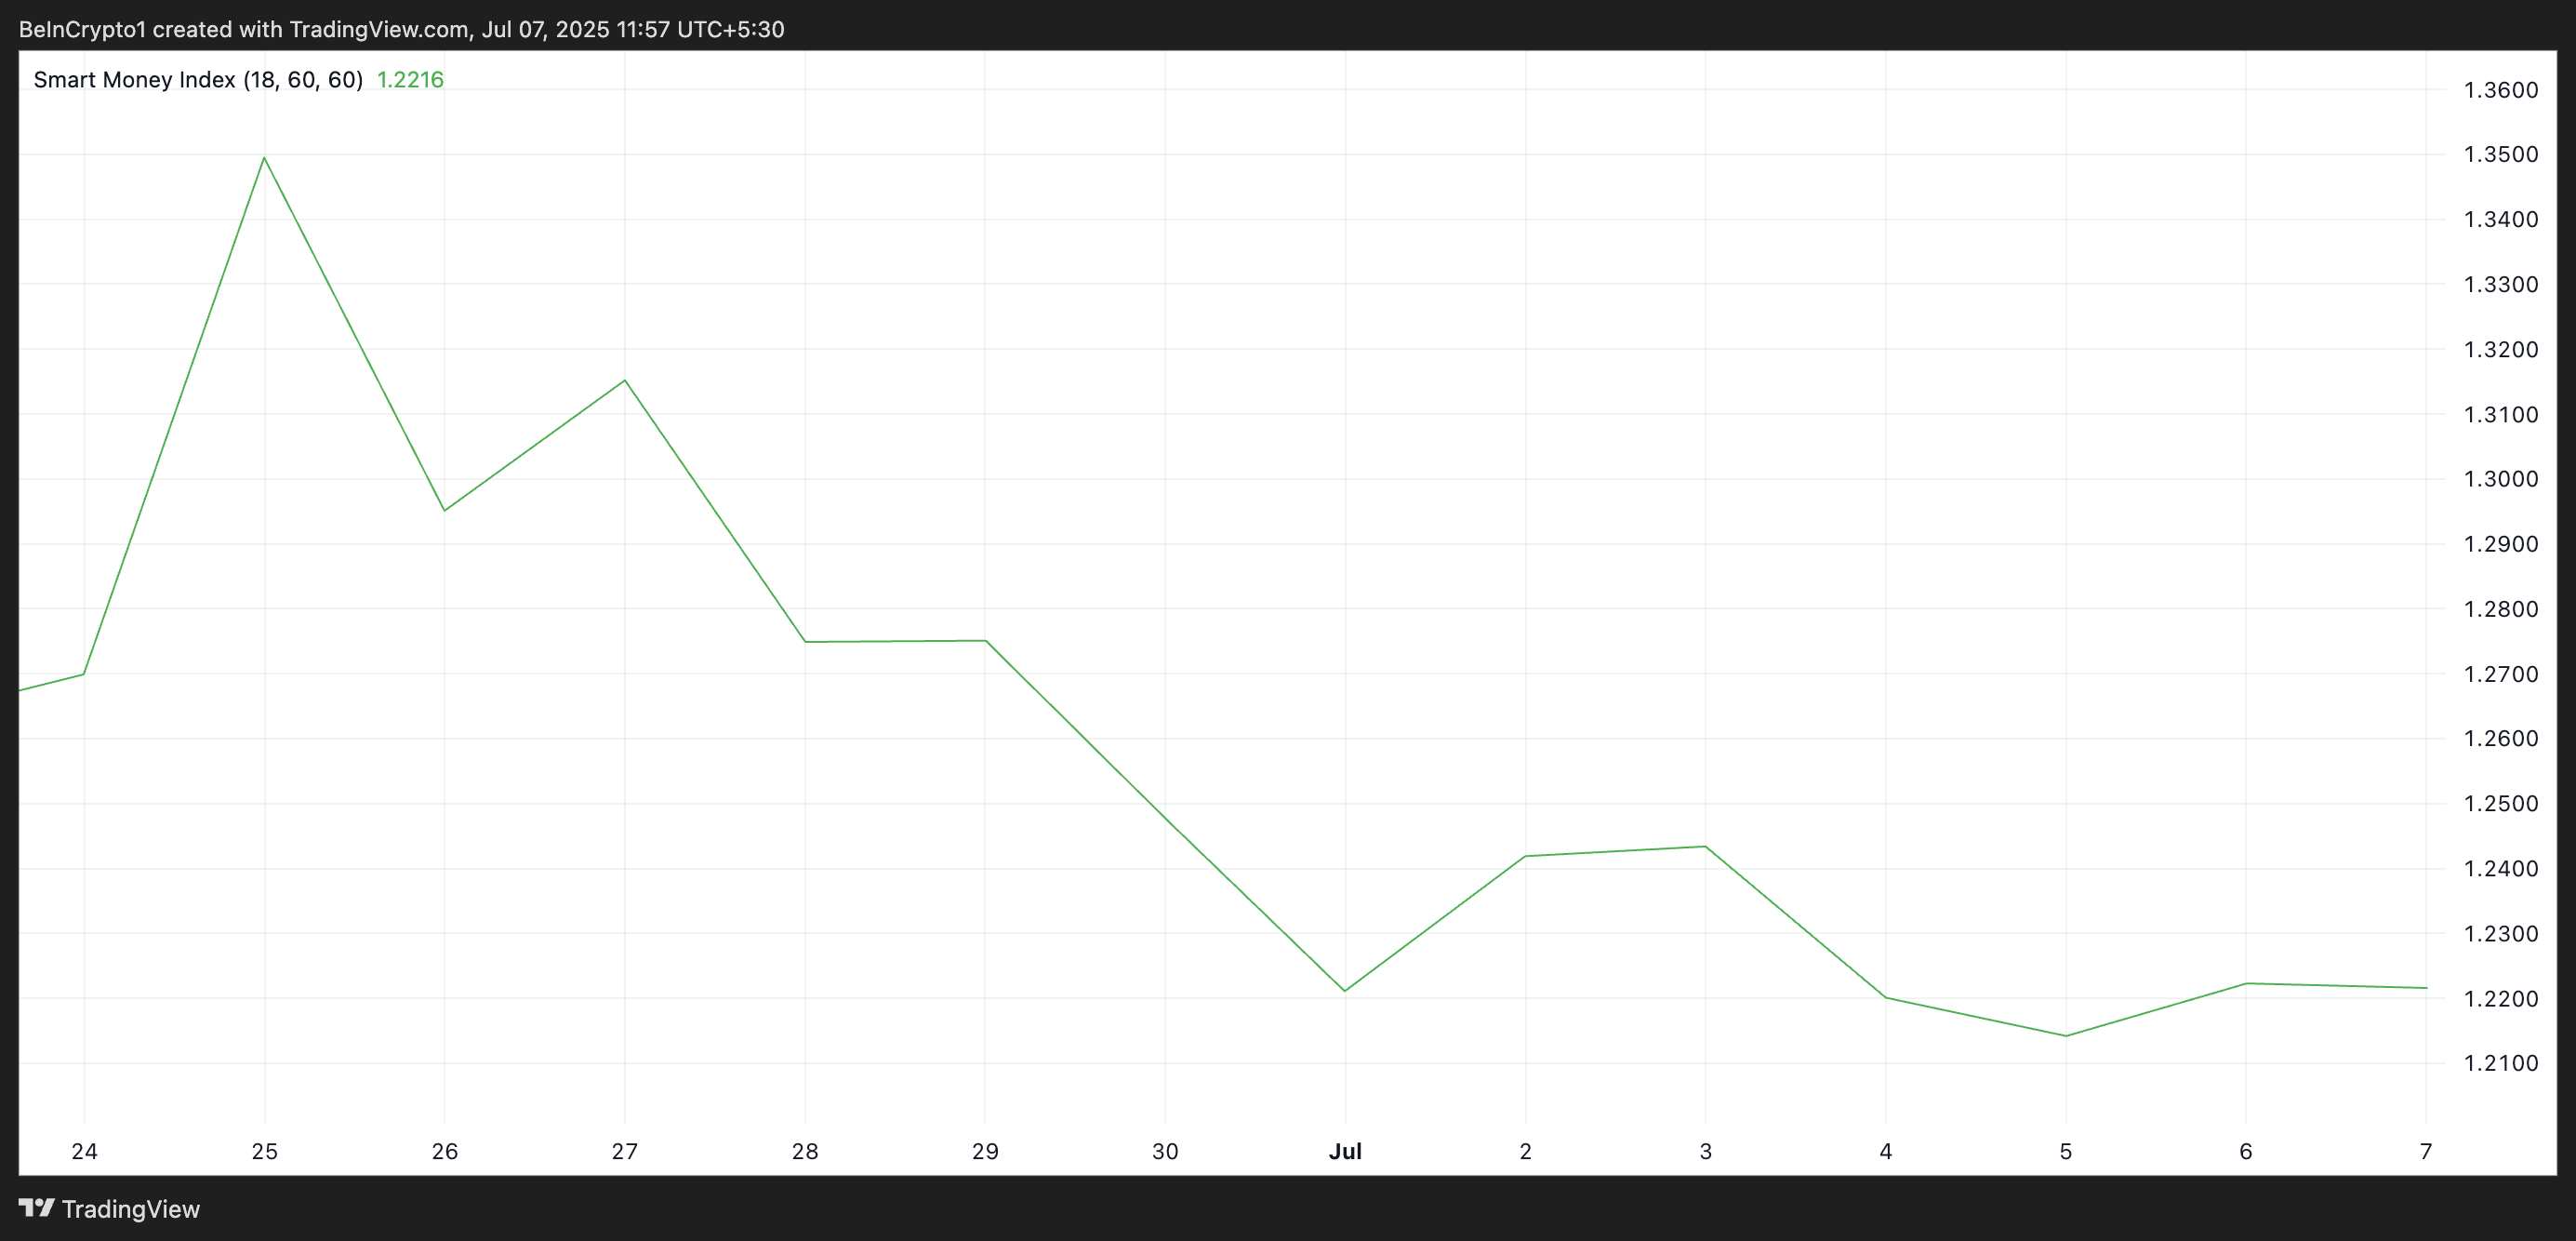
An asset's SMI analyzes market behavior during the first and last trading times to track the activities of experienced or institutional investors.
When the indicator rises, it indicates increased buying activity by these investors, meaning increased confidence in the asset.
Conversely, a decline like this indicates high selling activity and decreased confidence among experienced investors. This emphasizes the lack of confidence in short-term PI price recovery by major token holders.
PI Price Crisis... Will Selling Forces Drive It to an All-Time Low?
The continued weakness across technical indicators paints a cautious picture for investors expecting a quick rebound. If the downtrend dominates the market and PI selling increases, the price could break the newly formed 0.44 dollar support and fall to the all-time low of 0.40 dollars.
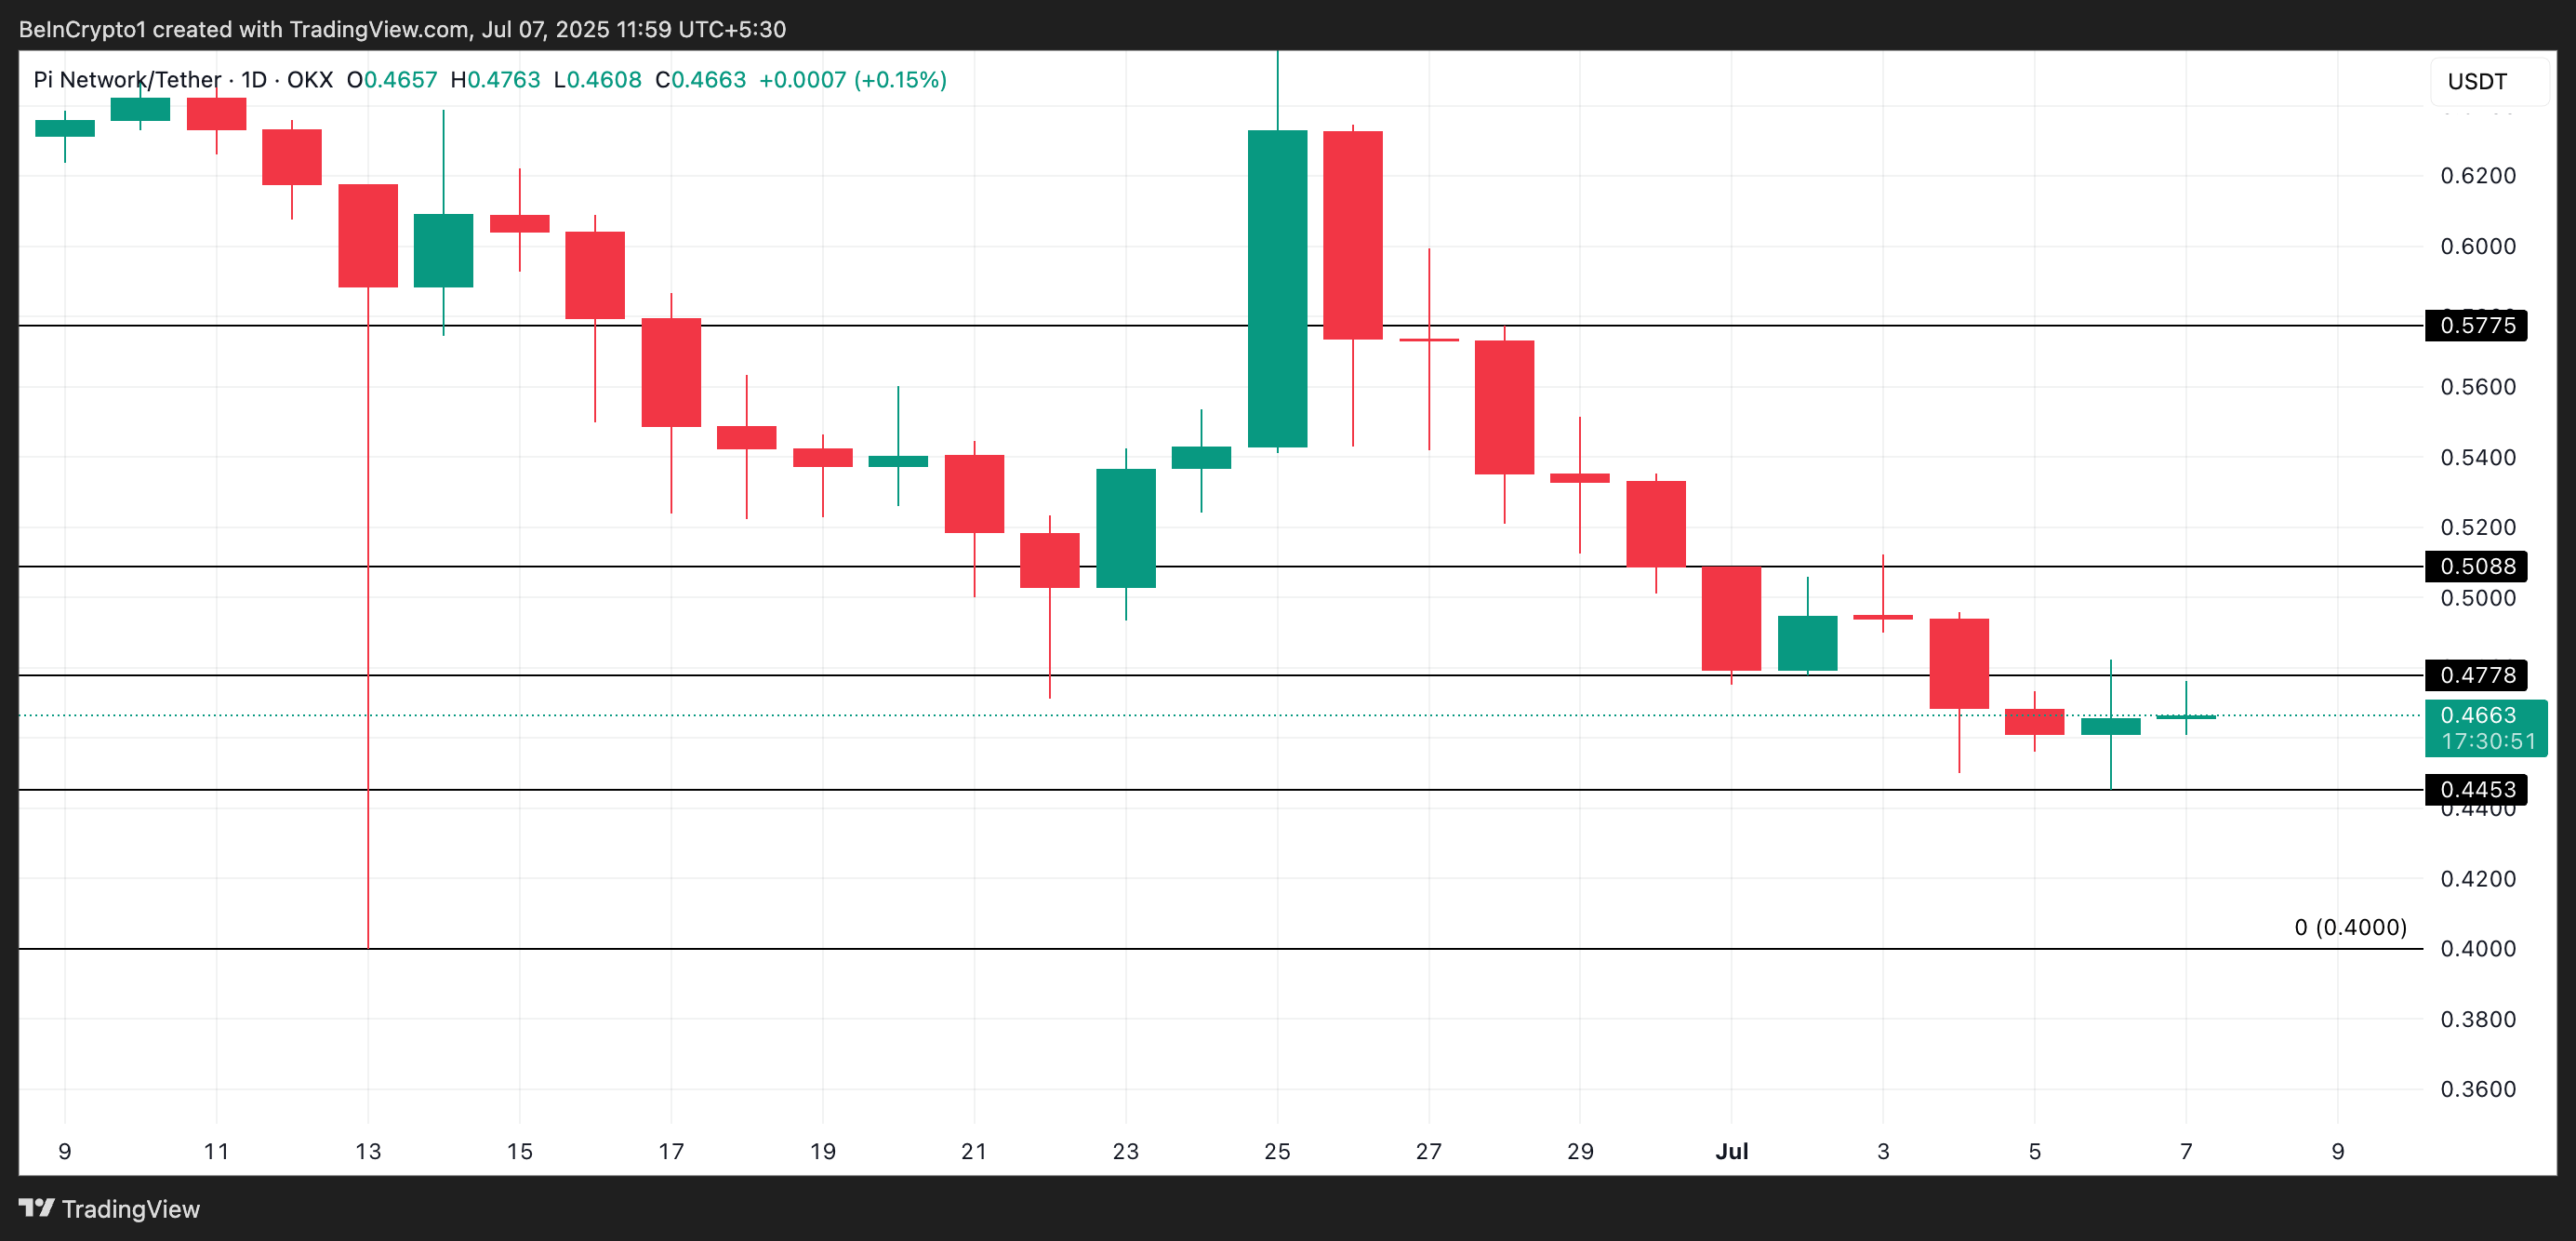
However, increased demand could prevent this. If new buyers enter the market, PI could break through 0.47 dollars and rise to 0.50 dollars.

