On the PI/Dollar daily chart, altcoins consolidated briefly from July 1st to 4th, facing resistance at $0.50 and support at $0.47.
However, as the downward trend intensified on Friday, the token was pushed below its short-term support range. Since then, PI has shown a downward trend, with a high likelihood of retesting its all-time low of $0.40.
PI Selling Intensifies…Upward Momentum Weakens
PI's Accumulation/Distribution (A/D) line has sharply declined over the past two weeks, indicating a significant decrease in buying volume and weakening investor confidence. Currently, this indicator is at -$373 million, having fallen 82% since June 25th.
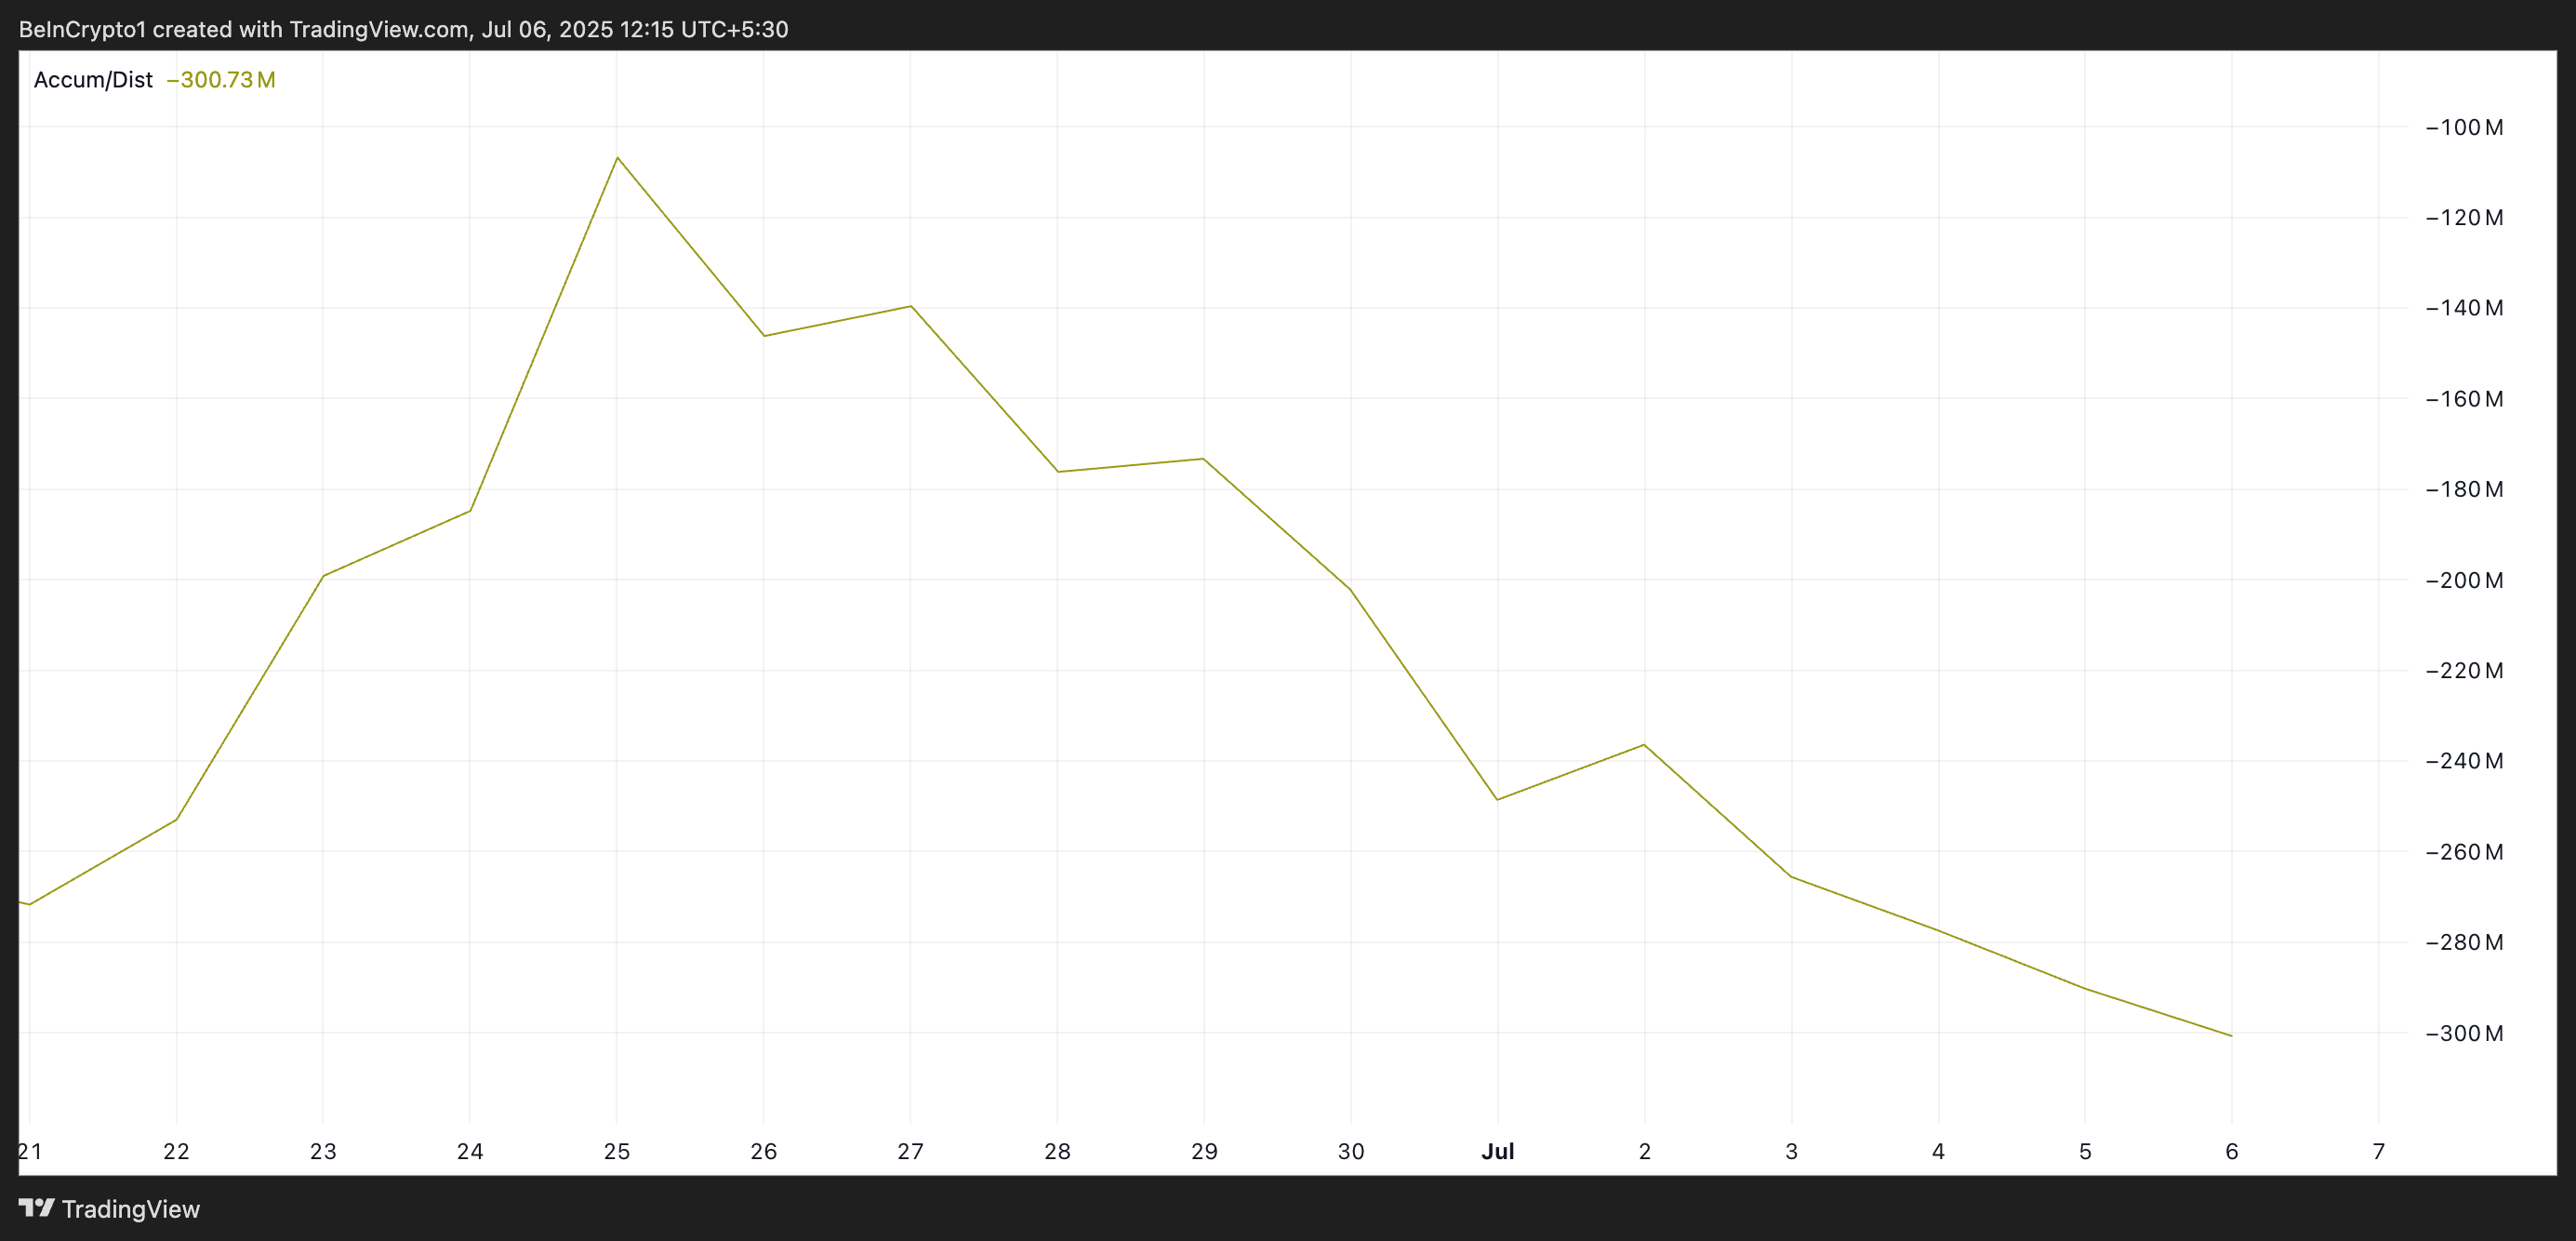
The A/D line measures buying and selling pressure by analyzing price movements and trading volume. When rising, it indicates strong accumulation, meaning buyers are driving demand and pushing prices up.
In contrast, as seen with PI, a declining A/D line suggests selling pressure exceeds buying interest. This indicates traders are selling rather than accumulating PI, signaling weakening confidence in the token's short-term recovery prospects.
Additionally, PI's Directional Movement Index (DMI) setting aligns with this downward trend. The token's positive directional index (+DI, blue) is currently below the negative directional index (-DI, orange), showing the negative trend is strengthening.
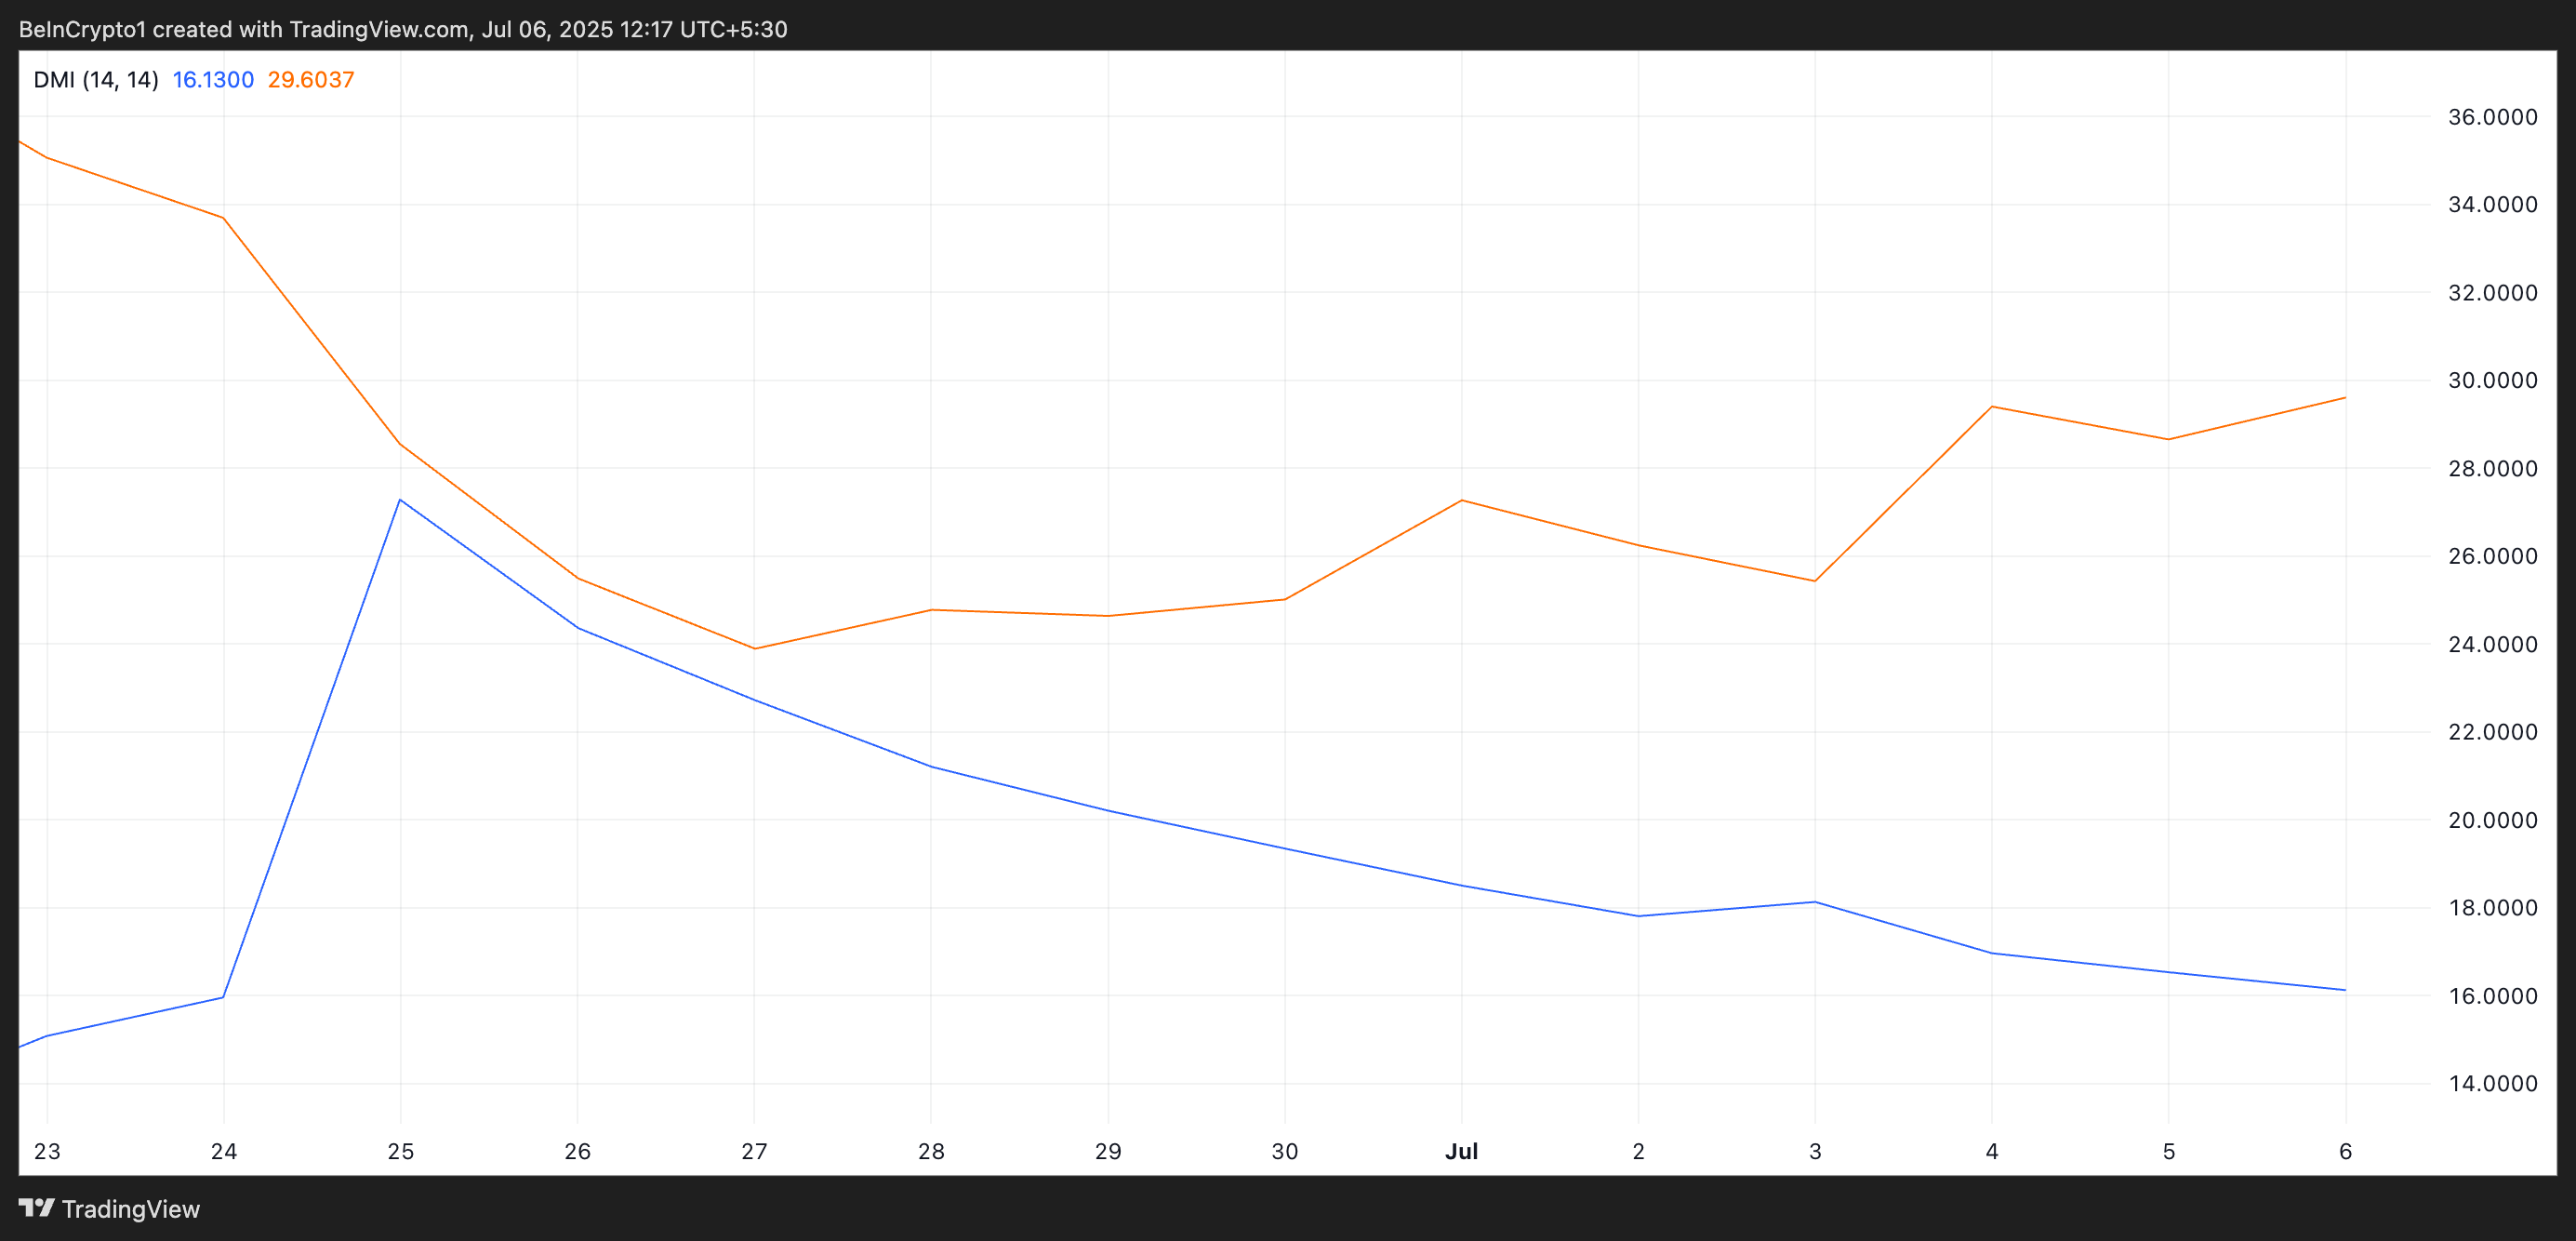
The DMI indicator measures the strength of an asset's price trend. It consists of two lines, with +DI representing upward price movements and -DI representing downward price movements.
When +DI is above -DI, the market trend is bullish. This means buying-side pressure is dominant, and the asset is in an upward trend.
Conversely, when +DI is below -DI, downward price movements are strong. This is a bearish signal indicating PI sellers are controlling the market more than buyers.
PI Market Dominated by Sellers…Potential for Buying Momentum Recovery?
Currently, PI is trading at $0.44, with the next major support level at the all-time low of $0.40. With sellers firmly controlling the market and building downward momentum, a revisit to this price bottom is possible.
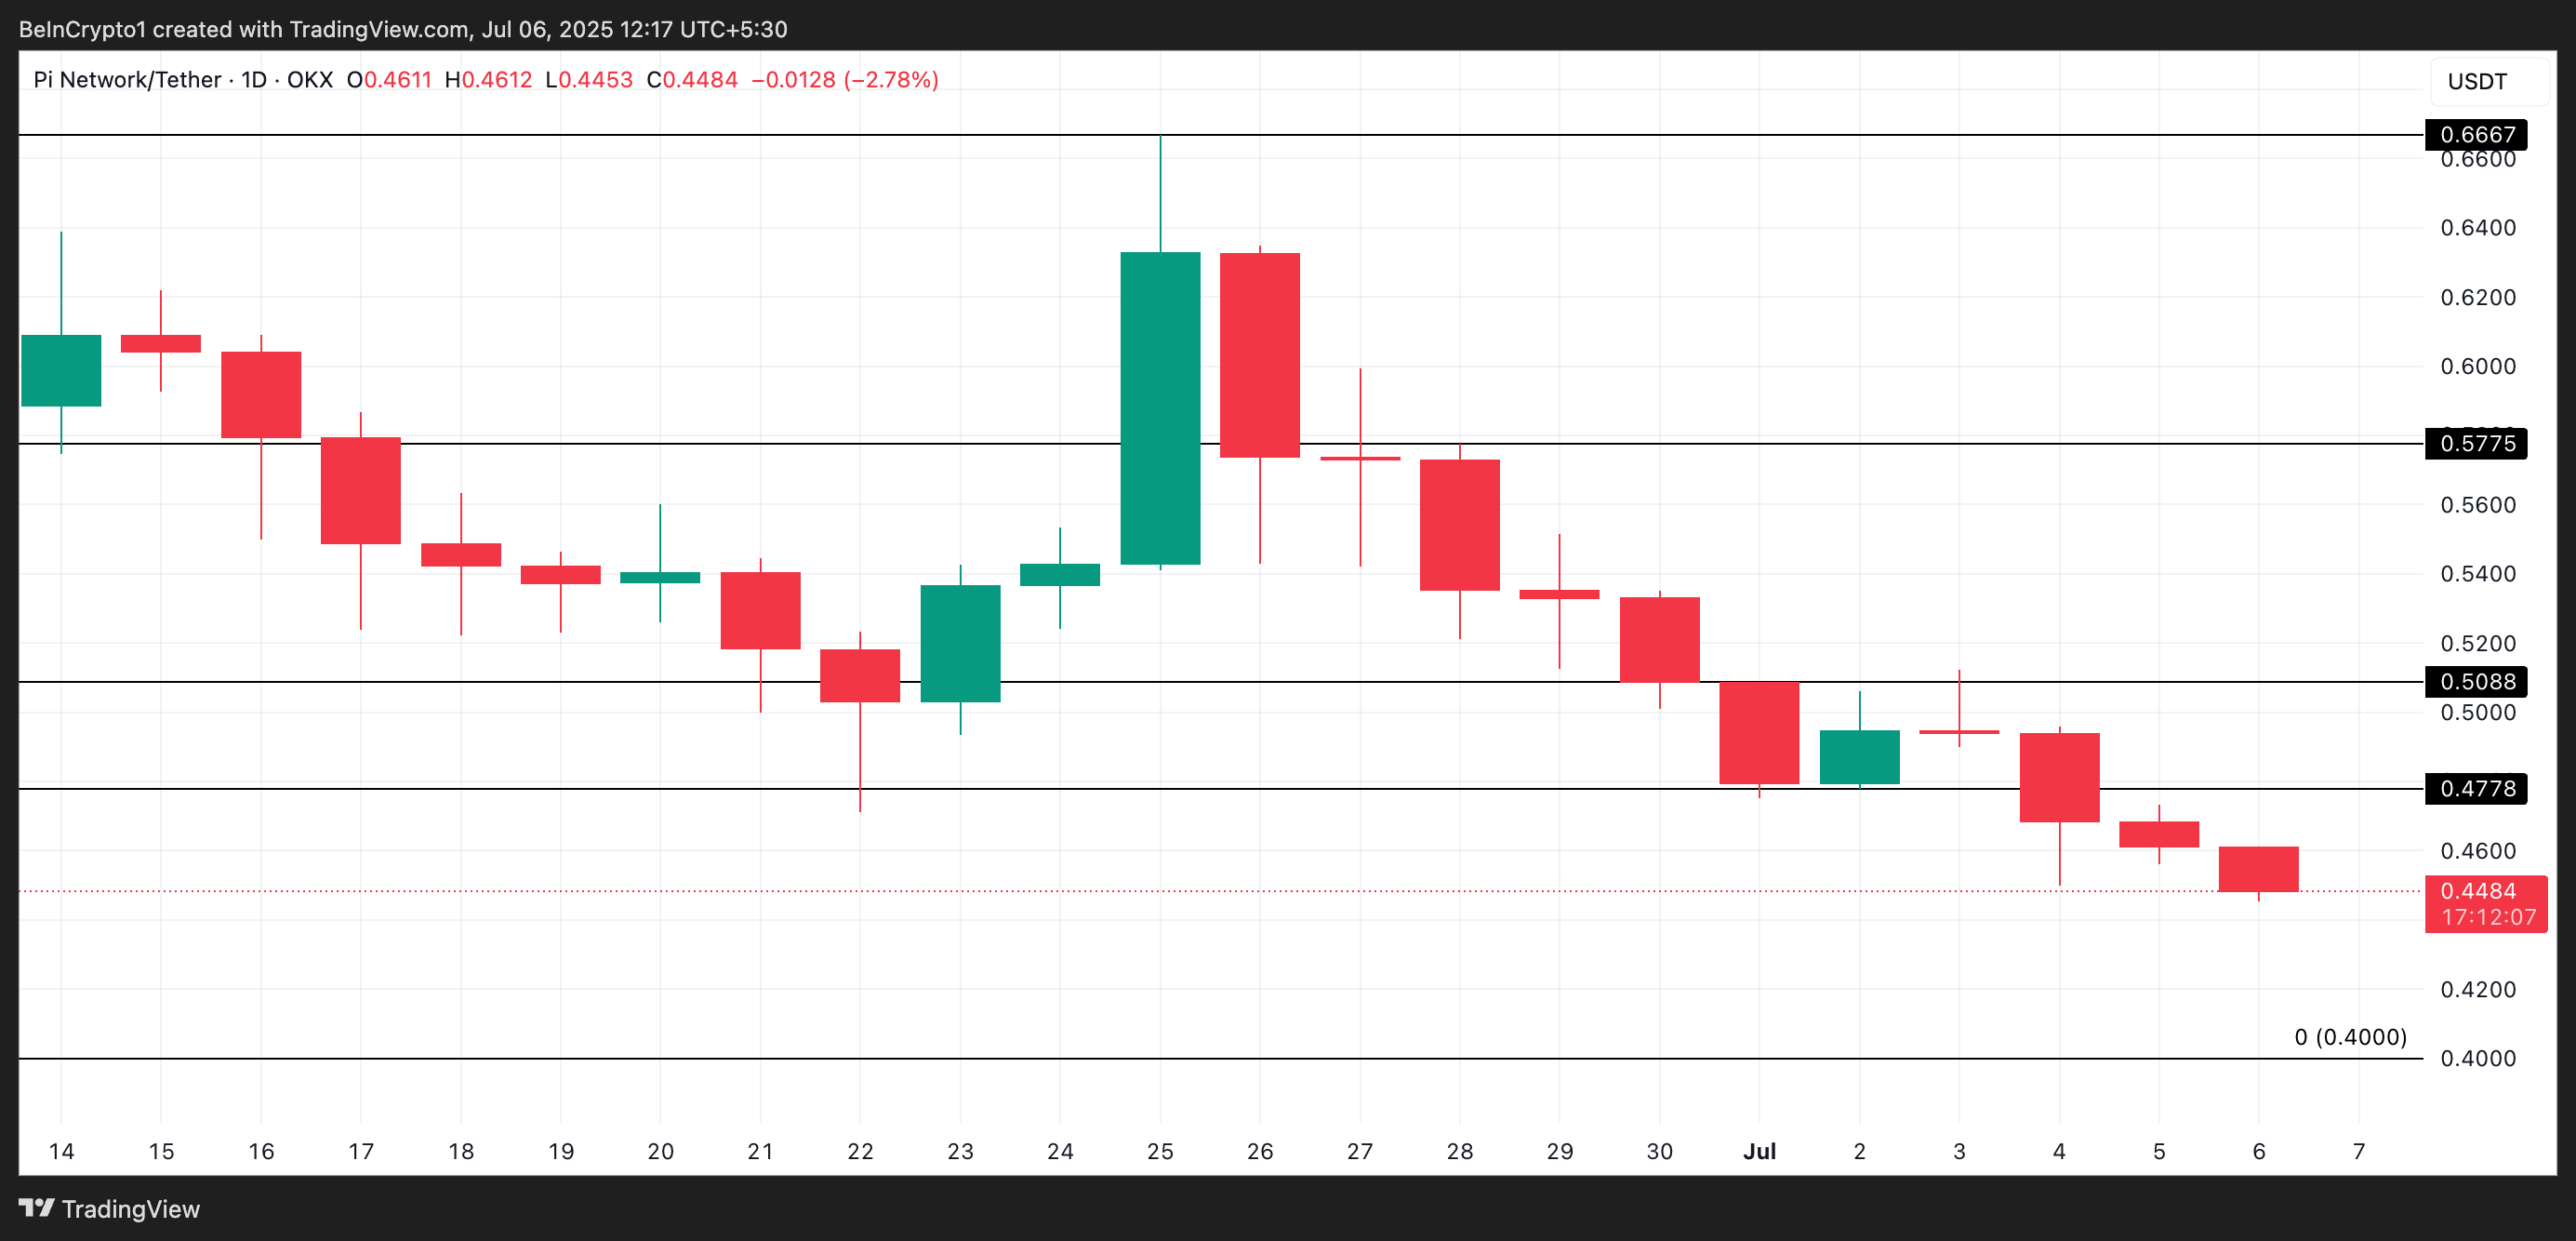
However, only a revival of buying demand could invalidate this bearish outlook. In such a case, the PI coin price could rebound, breaking through the new resistance level of $0.47 and rising to $0.50.