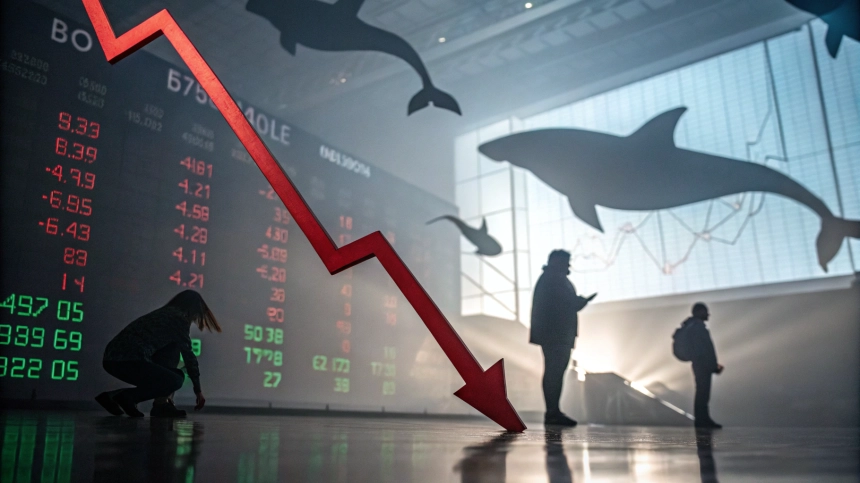
Bitcoin experienced a short-term decline following news of a 'OG whale' wallet movement after 14 years. However, technical analysis indicators still suggest a valid medium to long-term upward trend. Is this decline a warning sign or a 'healthy adjustment'?
Short-term decline triggered by whale wallet movement
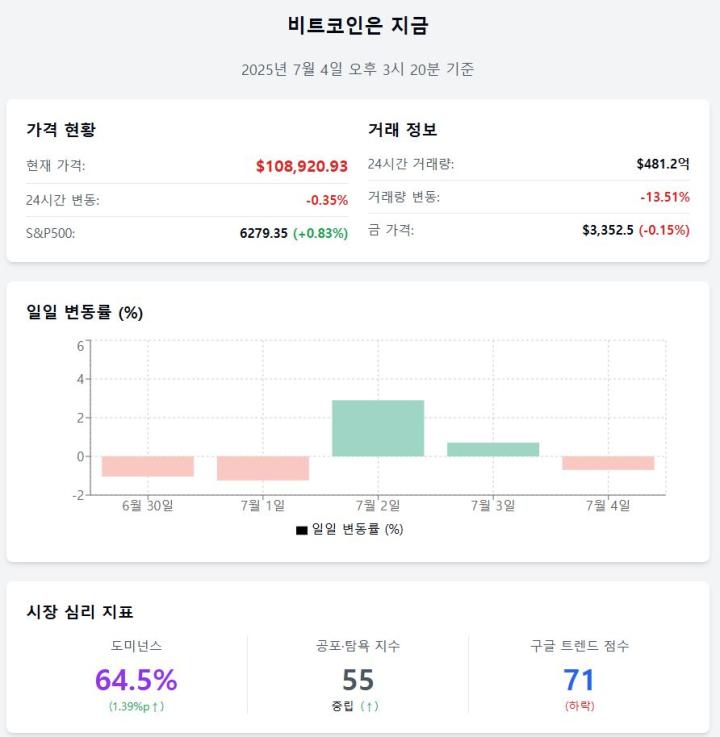
Recently, Bitcoin had been continuing its upward trend, rising to $110,561 at one point, but suddenly dropped to around $107,000 after news of a whale wallet from 14 years ago containing 80,000 BTC moved.
This wallet was mined or received in 2011 when Bitcoin was priced between $0.78 and $3.37, which is currently worth approximately $8.6 billion (about 11.8 trillion won). Connor Grogan, Director at Coinbase, stated, "This wallet could be from an early miner, exchange balance, or hacked funds."
In the market, when such massive amounts hidden beneath the surface suddenly move, it often stimulates short-term investors' anxiety, leading to selling pressure.
Technical Analysis: Upward Trend Remains
This decline is merely a short-term sentiment-driven adjustment, and technical indicators still show Bitcoin maintaining an upward trend in the medium to long term.
🔹 ADX (Average Directional Index): Trend Formation Starting Signal
-
The current ADX is at 25, which is typically the benchmark for determining trend existence.
-
Below 20 indicates 'no trend', while 25 or above suggests an upward or downward trend is forming.
-
The current value is at the beginning of a potential full-scale upward trend.
🔹 RSI (Relative Strength Index): Not Overbought, Plenty of Potential
-
RSI is currently at 62.
-
Typically, above 70 is considered overbought, and below 30 is oversold.
-
It has not yet reached the overheated zone and suggests significant upward potential.
🔹 EMA (Exponential Moving Average): Securing Solid Support Line
-
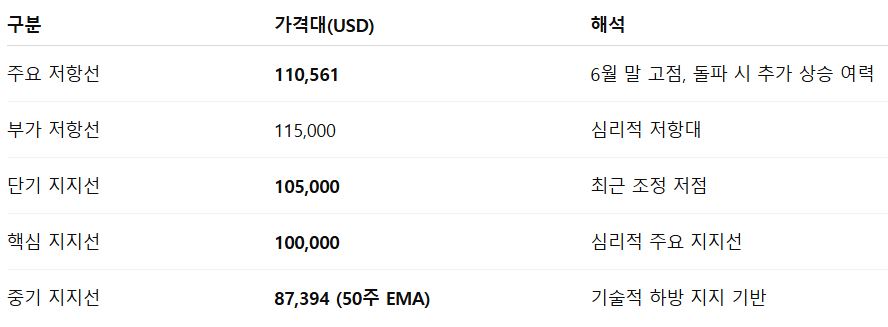
50-week EMA: $87,394, 200-week EMA: $56,114
-
Bitcoin's current price is far above both EMAs, indicating a robust long-term support line.
-
Especially, the 50-week EMA is maintaining recent upward momentum, signaling positive medium-term investment sentiment.
🔹 Squeeze Momentum Indicator: 'Green Signal' Activated
-
This indicator is used to predict trend direction after volatility compression.
-
Recently entered the 'decompression' zone, with green bars gradually increasing.
-
This suggests the possibility of a full-scale upward trend.
Key Price Ranges: Support and Resistance Lines
Investor Insights
While the short-term whale wallet movement stimulated selling sentiment and caused a correction, major technical indicators show Bitcoin's upward trend is maintained.
Market experts noted, "In the past, movements by long-term holders (OG whales) often resulted in only short-term impacts and sometimes even provided buying opportunities at lower prices," adding, "From a medium to long-term perspective, current technical indicators suggest a positive direction."
Get news in real-time...Go to Token Post Telegram
<Copyright ⓒ TokenPost, Unauthorized Reproduction and Redistribution Prohibited>