The rebound flow after a sharp decline can serve as a hint for the inflow of short-term buying. 'Dip' refers to the lowest price in the last 7 days, and 'Bounce' indicates the percentage increase from that low point. This allows us to examine both the technical rebound trend and market demand response. Stocks with a notable price recovery after a correction period may suggest the possibility of a trend reversal. We introduce assets with detected rebound trends based on recurring price patterns. [Editor's Note]
Top 5 Weekly Rebound Rates
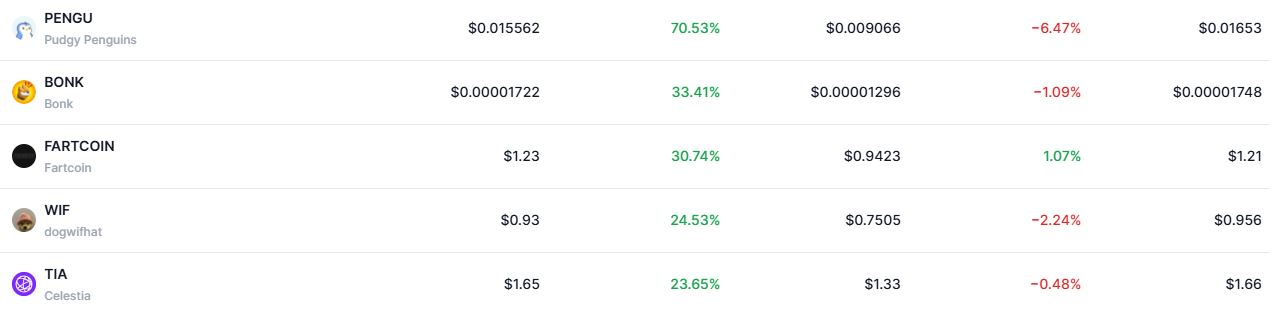
① PENGU +70.53%, –8.69% Low point $0.009066 | High point $0.01704 | Current $0.015562
It showed a strong technical rebound, surging nearly 70% from the weekly low point of $0.009066. After forming a weekly high point of $0.01704, it underwent a slight adjustment and is currently trading at $0.015562. Bottom-fishing buying seems to have significantly impacted demand elasticity, and the breakthrough of the high point resistance is expected to be a turning point for further increases.
② BONK +35.35%, –1.88% Low point $0.00001296 | High point $0.00001755 | Current $0.00001722
It rebounded more than 35% from the low point of $0.00001296 to the high point of $0.00001755. Despite short-term profit-taking, the current price at $0.00001722 shows limited decline. Trading sentiment centered on meme coins has been revived, leading to active short-term liquidity inflow.
③ FARTCOIN +35.81%, –3.91% Low point $0.9423 | High point $1.28 | Current $1.23
It rose from $0.9423 to $1.28, recording a rebound of over 35%. Currently, it remains slightly suppressed at $1.23. The section showed clear mid-to-low-price buying, and a potential new trend reversal is suggested if it breaks above $1.30 in the short term.
④ WIF +26.58%, –2.11% Low point $0.7505 | High point $0.95 | Current $0.93
It rebounded from $0.7505 to $0.95 and is currently maintaining the $0.93 level. A weekly increase of about 26% was confirmed, with limited short-term adjustment. It could be in the initial phase of a medium-to-short-term trend reversal, with trading volume expansion being a key variable.
⑤ TIA +27.82%, –2.94% Low point $1.33 | High point $1.70 | Current $1.65
It rose from $1.33 to $1.70, rebounding by about 28%. Currently stabilizing at $1.65, with an adjustment of less than 3% from the high point. This can be interpreted as an early signal of recovery from the recent downtrend, with attention on whether the short-term rebound will lead to additional upward momentum.
Additionally, notable rebounds include ▲JUP (+22.84%, –1.16%) ▲SPX (+20.74%, –5.67%) ▲Arbitrum (ARB, +20.45%, –8.47%) ▲VIRTUAL (+20.36%, –2.28%) ▲Injective (INJ, +18.85%, 0.00%).
[The rest of the translation follows the same pattern]After rebounding about 19% from the low of $10.08 to the high of $11.98, it is currently maintaining at $11.96 without significant adjustment. As a strong upward trend without correction, it is characterized by maintaining strong investment sentiment.
Additionally, the following assets showed high daily rebound rates: ▲Jupiter (JUP, +22.84%, –1.16%) ▲SPX6900 (SPX, +20.74%, –5.67%) ▲Arbitrum (ARB, +20.45%, –8.47%) ▲Virtuals Protocol (VIRTUAL, +20.36%, –2.28%) ▲Injective (INJ, +18.85%, 0.00%).
Assets with Limited and Expanded Daily Adjustment Range
Assets that maintained stable prices with limited decline from the peak after the rebound include ▲Ton Coin (TON, +3.91%, 0.00%) ▲USDC (+0.07%, 0.00%) ▲Dai (+0.04%, 0.00%) ▲BUIDL (0.00%, 0.00%) ▲Four (FORM, +0.53%, –0.35%).
Assets with significant declines from the peak after rebounding include ▲Sky (SKY, +7.07%, –7.77%) ▲Etena Staked USDe (sUSD, +0.18%, –5.93%) ▲USDS (–0.01%, –3.99%) ▲SPX6900 (SPX, +9.53%, –2.87%) ▲PayPal USD (PYUSD, +3.98%, –0.08%).
Short-term profit-taking has been observed near the peak, causing price adjustments. Particularly, Sky has declined nearly 8% from its peak, indicating a notable short-term selling pressure.