In the recent efforts to stabilize Bitcoin above the critical $105,000 price level, on-chain data revealed one trend.
The total circulating supply held by short-term holders (STH) has significantly increased over the past few days. Historically, this has served as a bearish signal for the coin's short-term price movements.
Weak hands, BTC accumulation...pressured market
According to glassnode, the total supply held by BTC short-term holders plummeted to an annual low of 2.24 million coins on June 22nd, then strongly rebounded to 2.31 million coins, with these new or more reactive investors - typically called "weak hands" or "paper hands" - purchasing 70,000 coins.
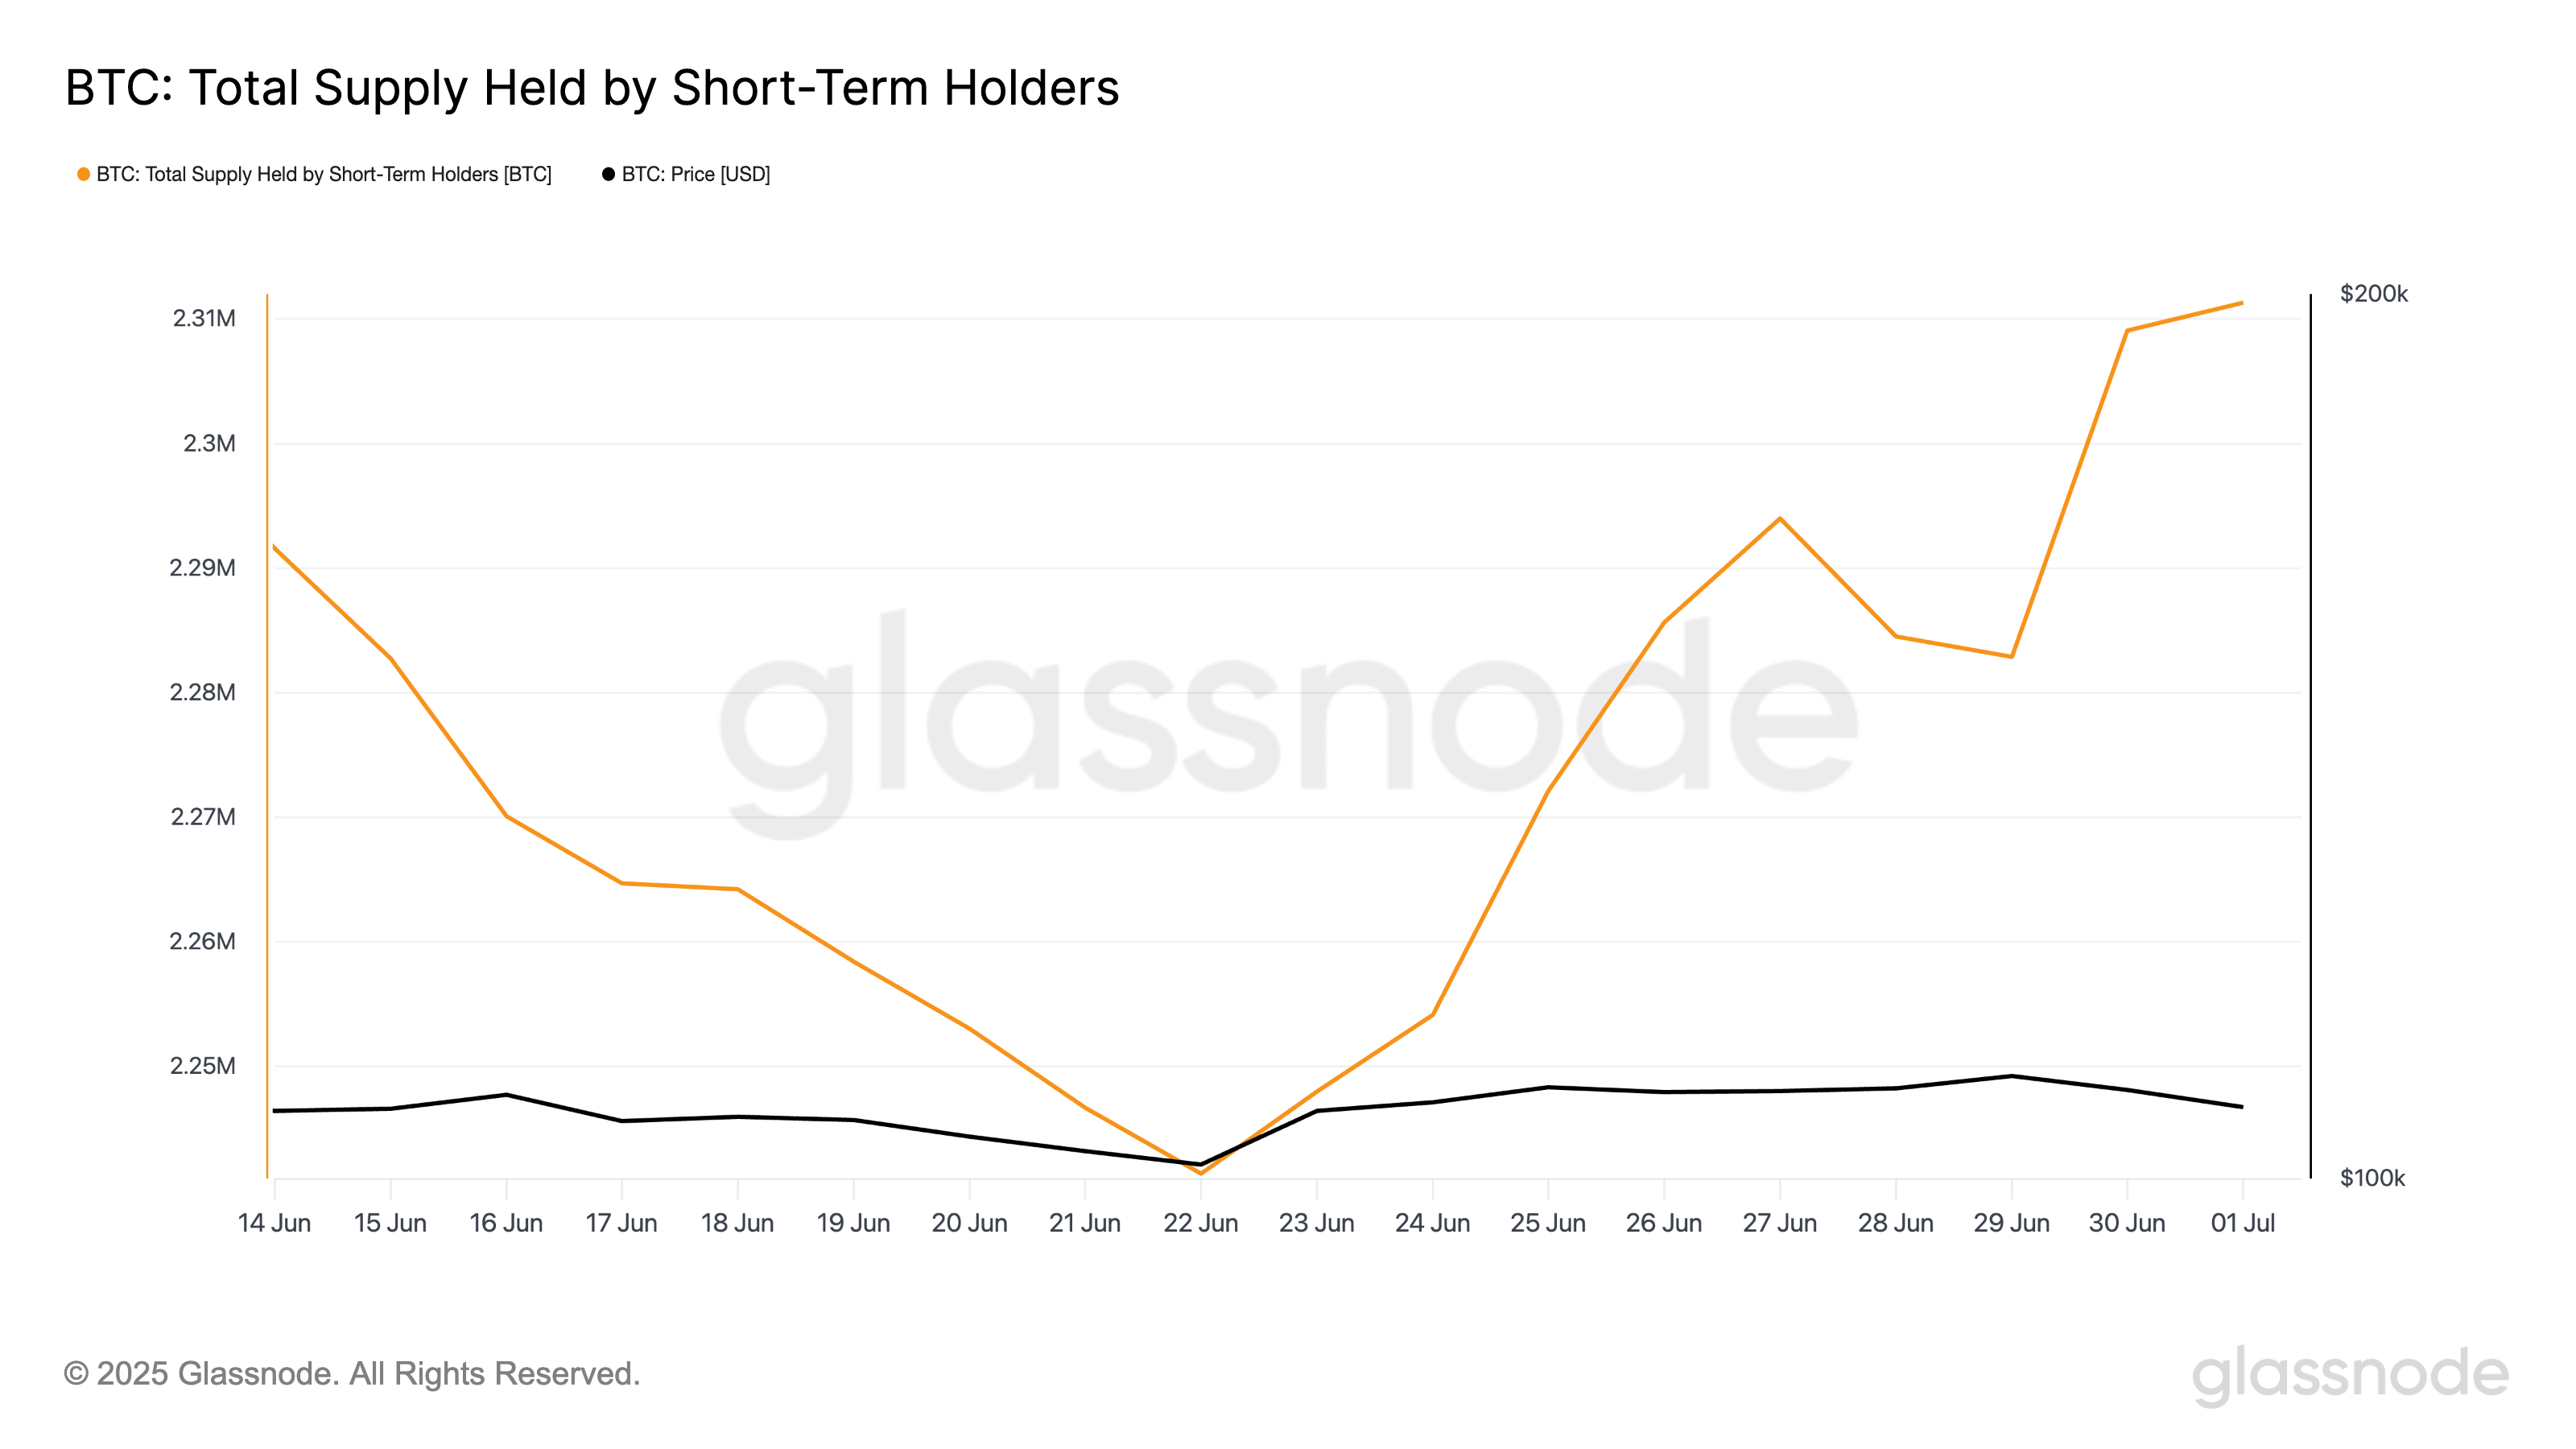
STH are investors holding coins for less than 155 days. This group is historically known to be more sensitive to price fluctuations. Therefore, when their accumulation surges, the asset is more likely to quickly exit the market at the first signs of uncertainty, amplifying volatility.
Additionally, glassnode's data confirms this trend is occurring alongside a slight decrease in long-term holders' (LTH) holdings. According to the data provider, their total supply holdings decreased by 0.13%.
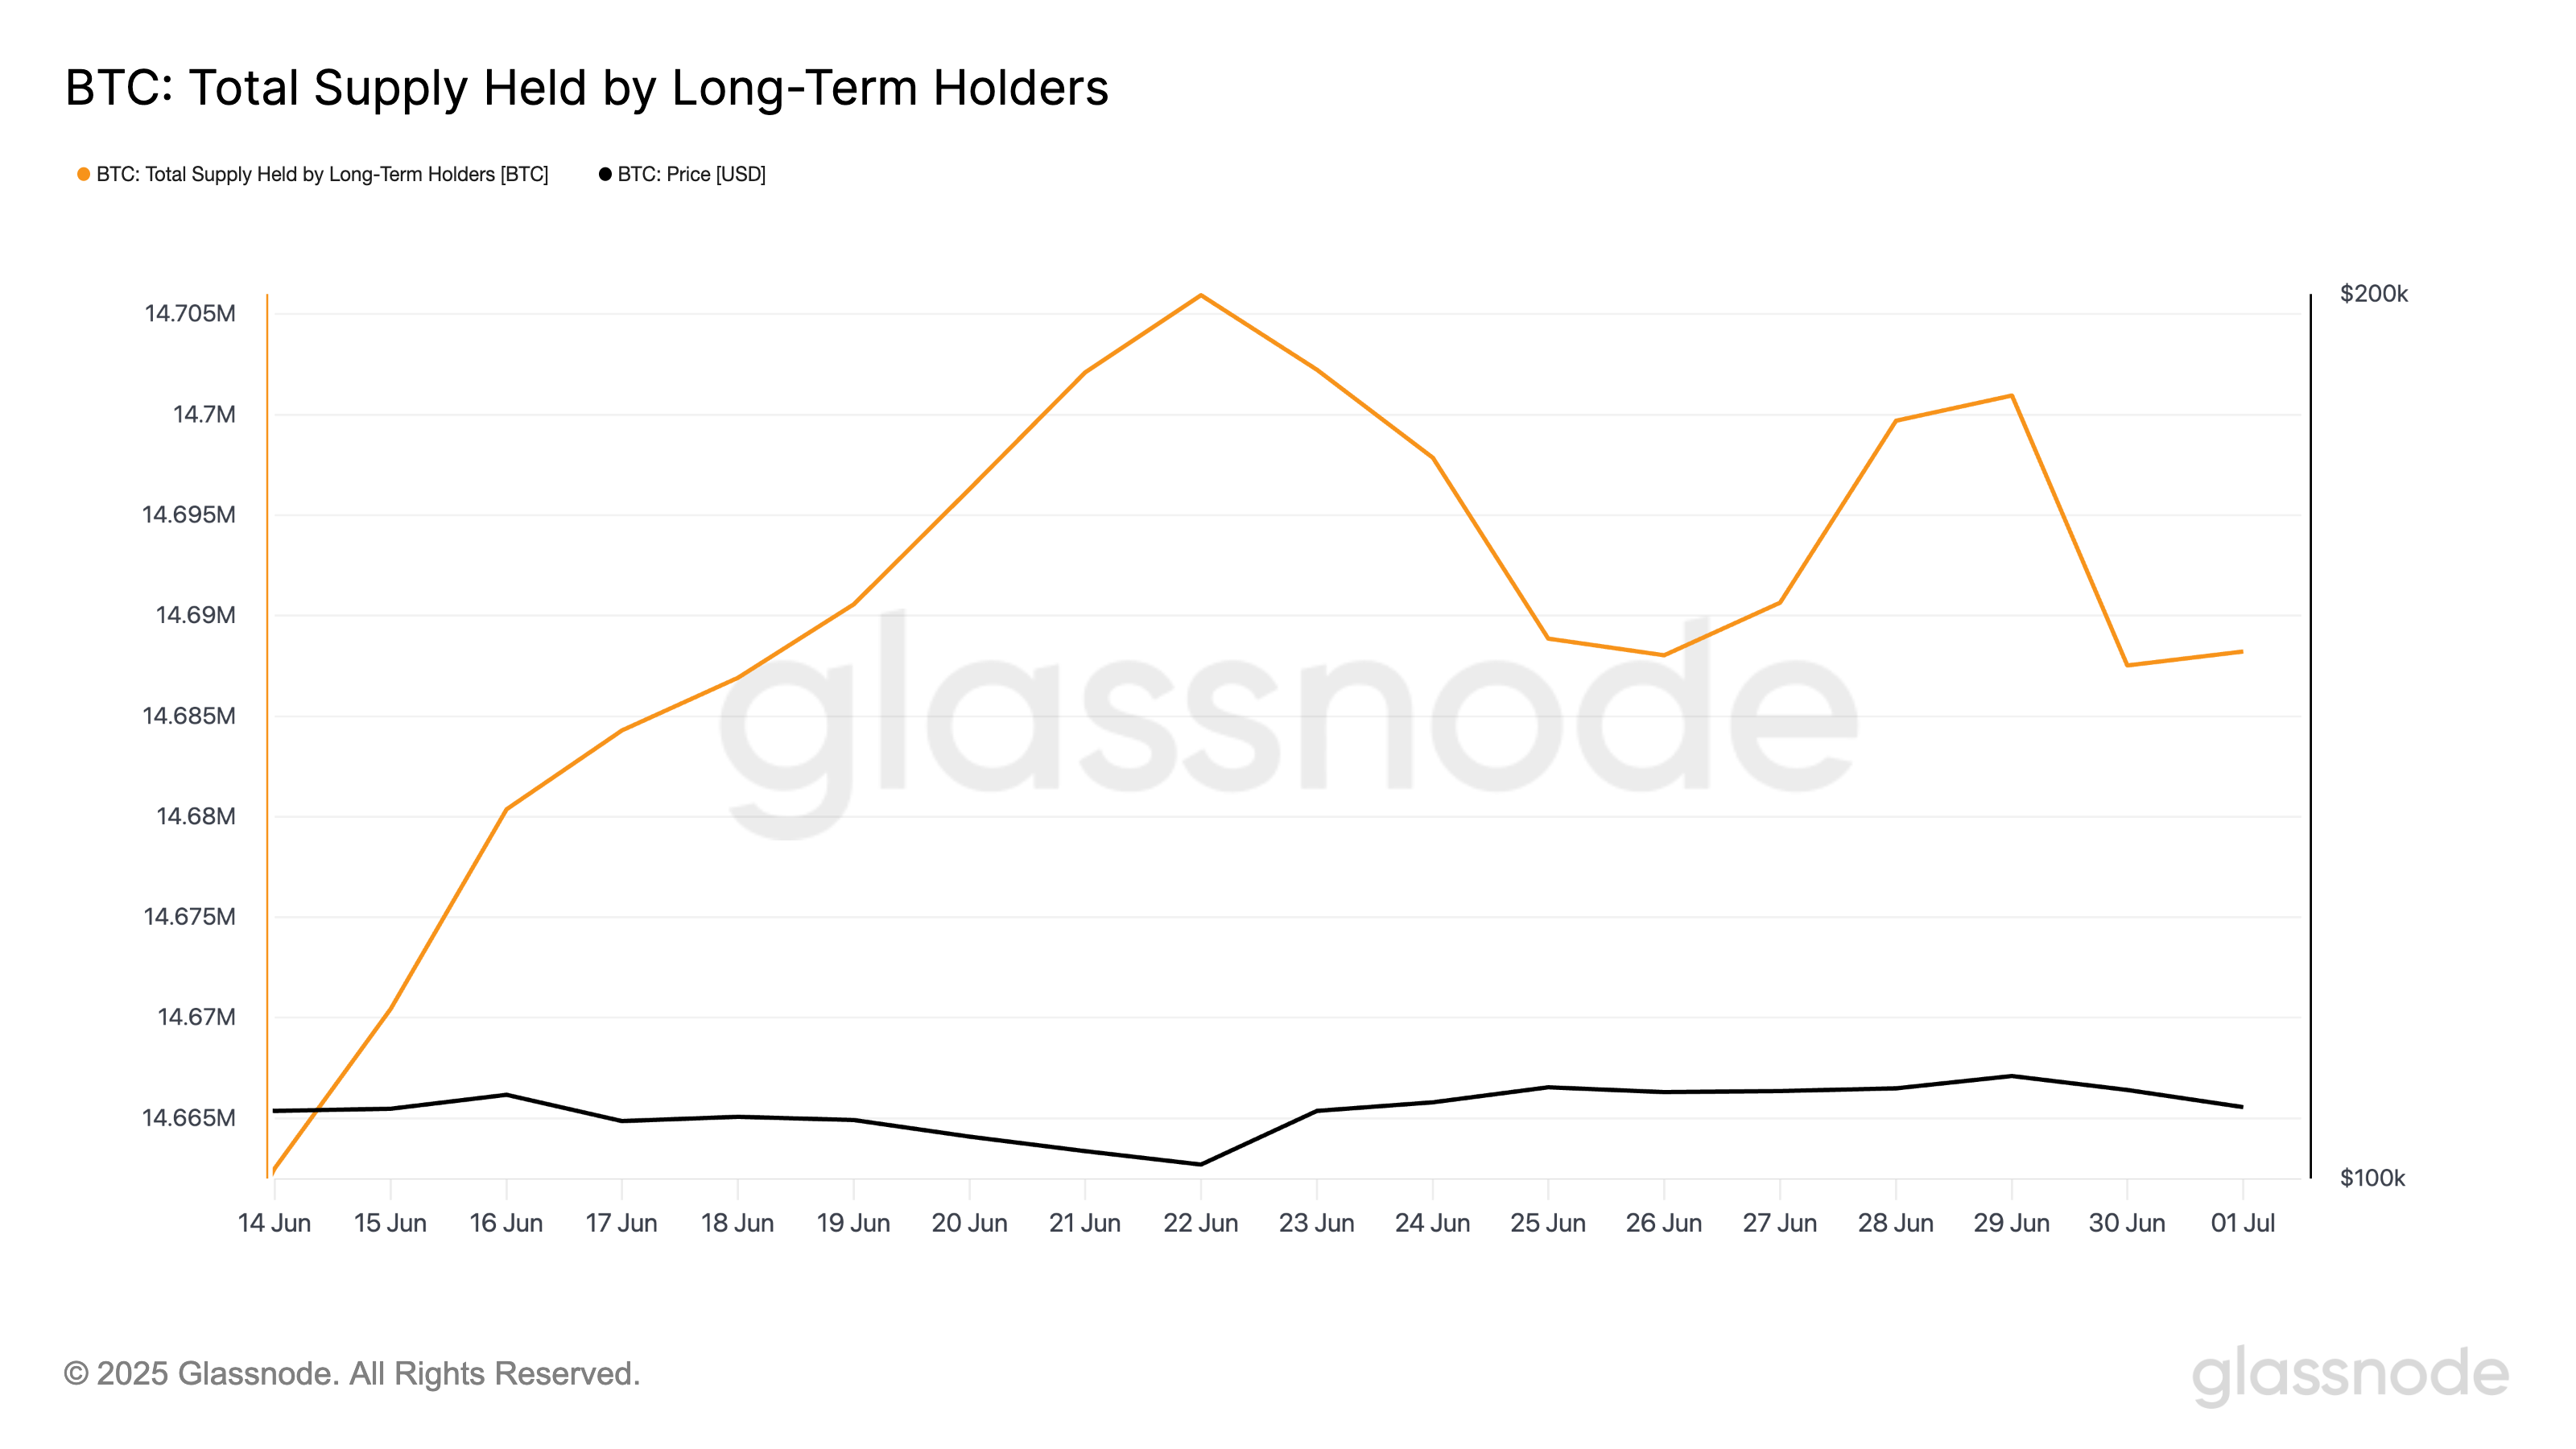
As these investors sell some coins, the market's fundamental support could weaken. This means BTC could become more vulnerable to sharp price movements in the short term.
BTC struggles under bearish pressure
BTC's BBTrend's lengthening red bars reflect a steady increase in bearish pressure. This consistent growth indicates sellers are gradually regaining market control, and downward momentum is strengthening.
BBTrend measures trend strength and direction based on Bollinger Bands' expansion and contraction. When red bars return, the asset's price consistently closes near the lower Bollinger Band, reflecting persistent selling pressure and suggesting further decline potential.
If this situation continues, the coin could extend its decline, dropping sharply to $104,709.
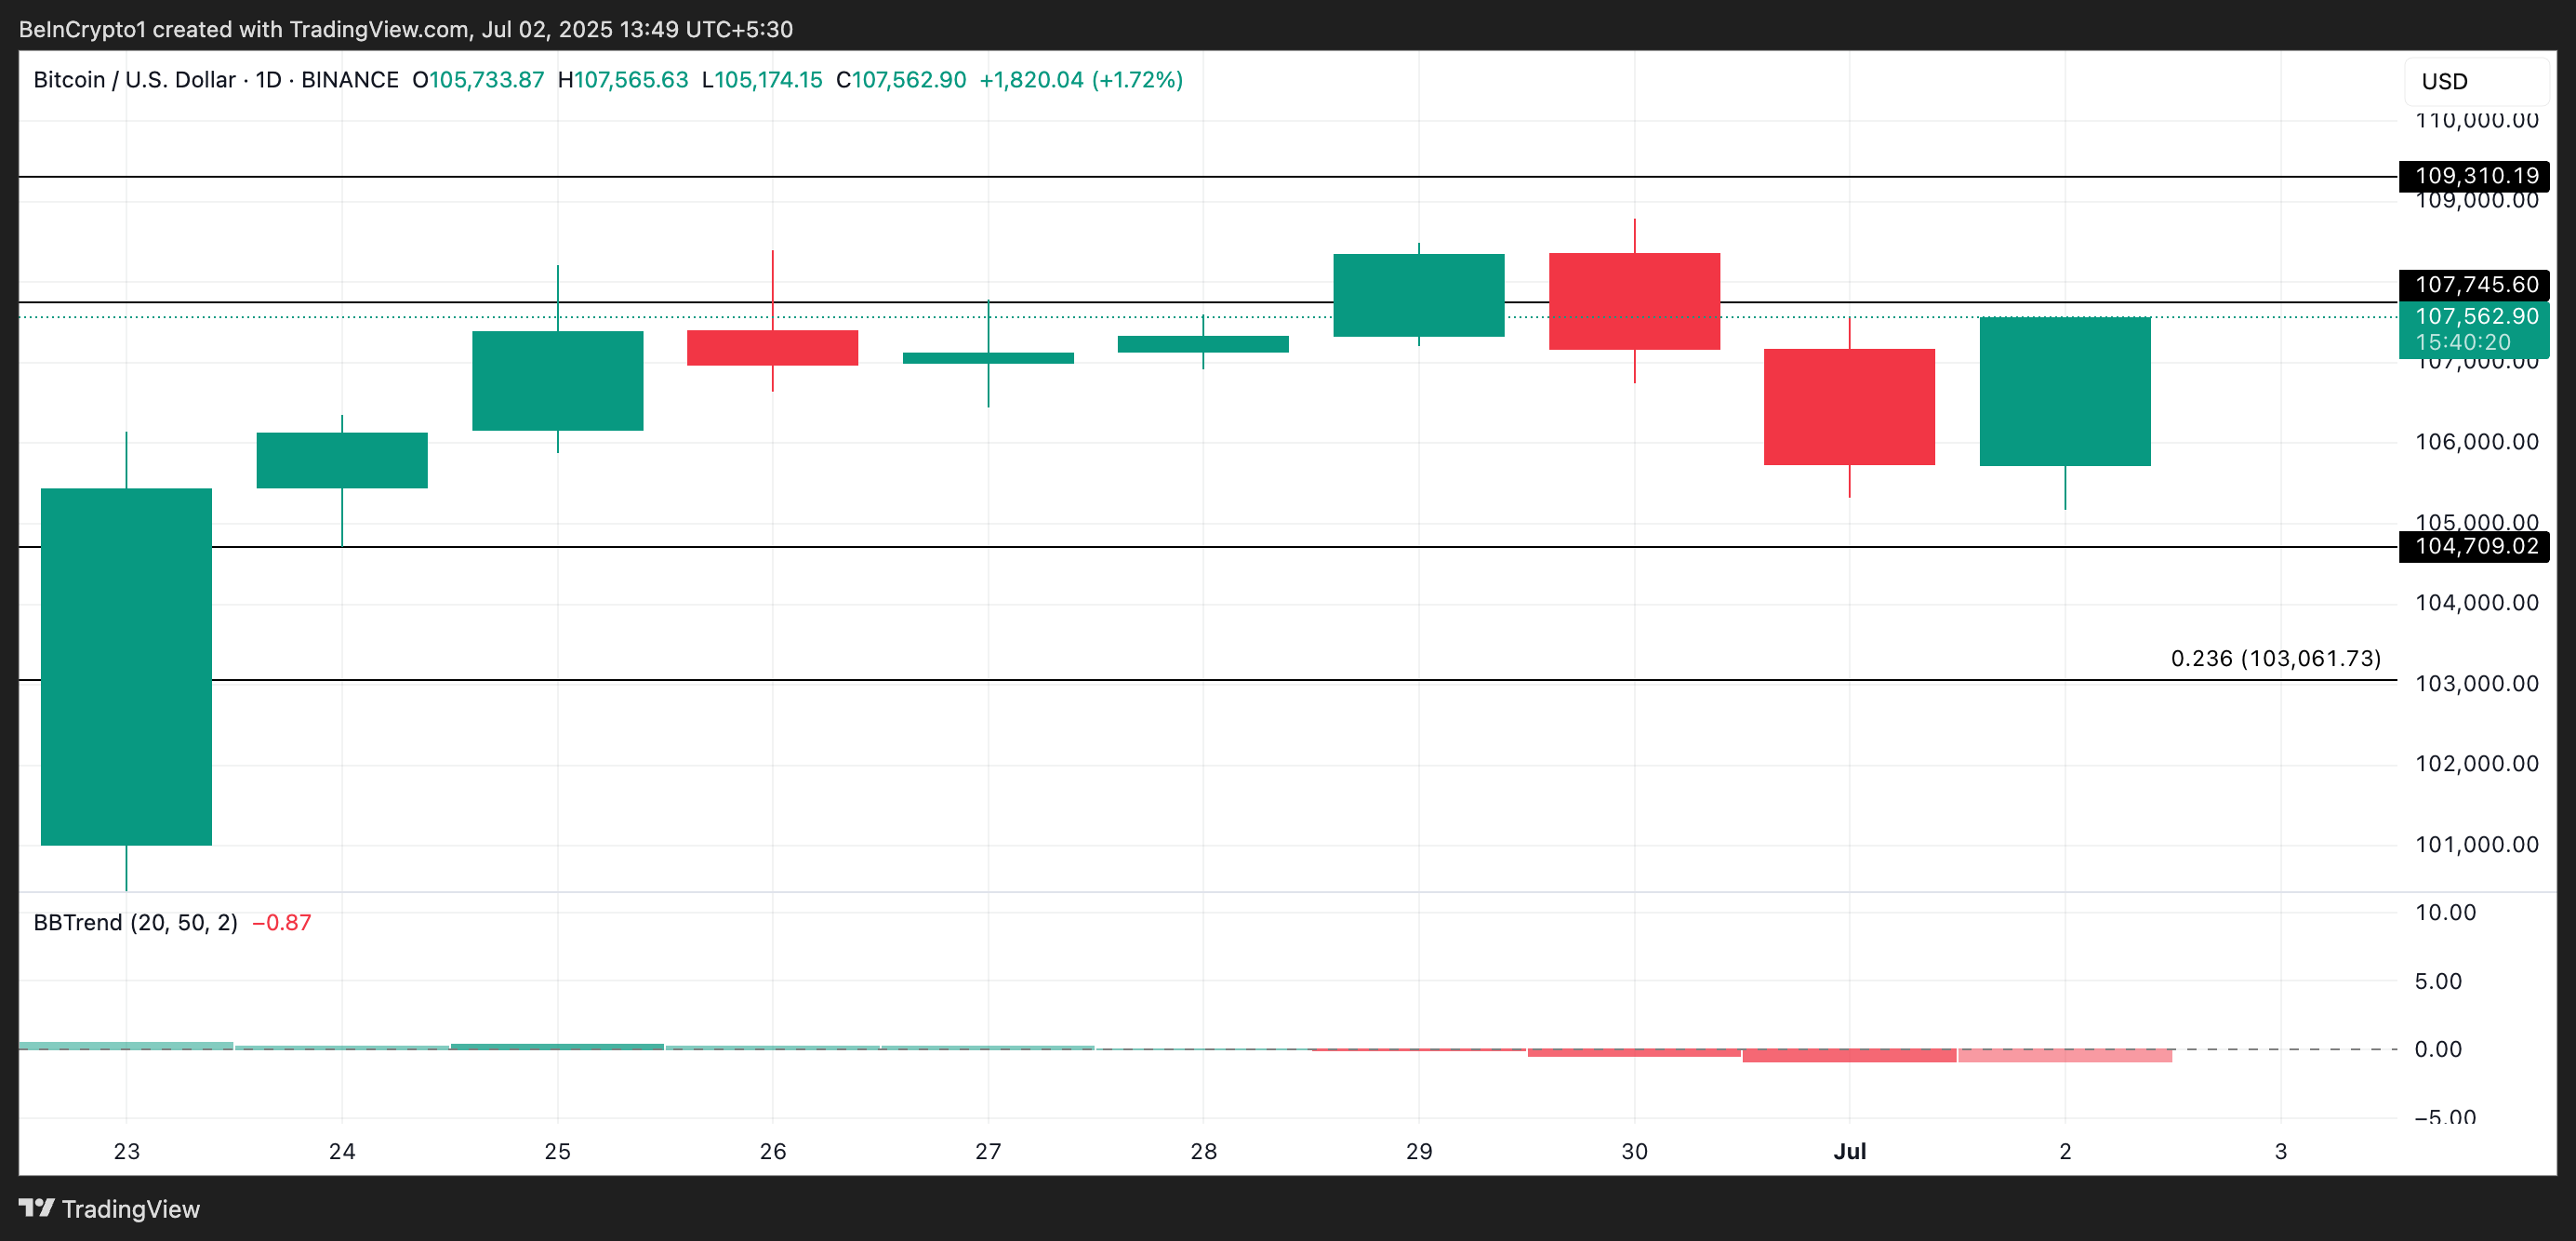
Conversely, if demand surges, BTC's price could exceed $107,745 and move towards $109,310.