

Binance's Bitcoin inflows and outflows provide insights into the current market sentiment.
According to CryptoQuant data, despite the price remaining stable above $100,000, Binance's BTC 30-day moving average (30-DMA) inflows decreased to 5,147 BTC on Tuesday.
VX: TZ7971
Notably, on December 5, 2024, when Bitcoin was trading below $100,000, the 30-day average daily inflows reached approximately 13,200 BTC—almost triple the current amount.
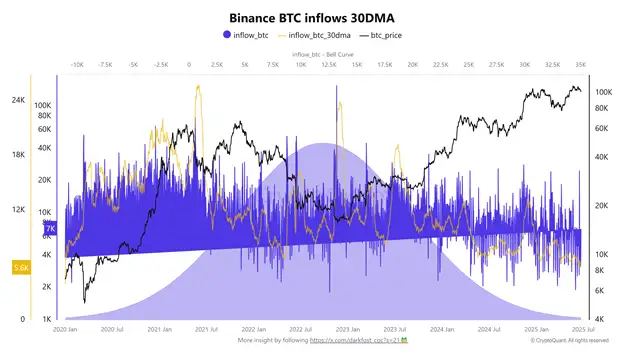
While outflows often attract market attention, inflows better reflect investor behavior—especially during periods of risk aversion and profit-taking.
Historically, BTC exchange inflow surges often coincide with local market peaks, followed by short to medium-term corrections. A typical example is the FTX collapse in late 2022, when monthly inflows spiked to around 24,000 BTC, reflecting panic selling.
However, the current situation is quite different. Despite Bitcoin trading at around $107,000, Binance's monthly BTC inflows have fallen below bear market benchmarks. This is less than half the peak during the FTX turmoil and far below the average of 12,000 BTC per month since 2020.
The inflow/outflow ratio (30-day SMA) remains high, similar to the situation in late 2023 (the beginning of the bull market cycle). This indicates that demand for BTC remains very strong.
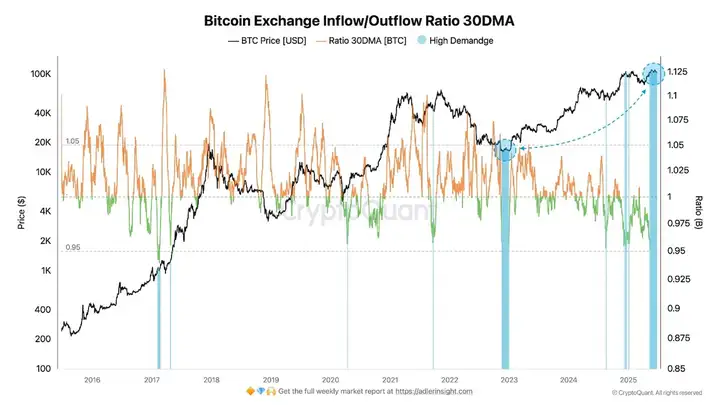
The sharp decline in inflows clearly demonstrates a shift in investor strategy. Market participants seem less eager to sell during price increases, instead holding their stocks, suggesting reduced selling pressure.
However, the overall environment remains complex. The market's response to ongoing geopolitical events and macroeconomic uncertainties means that any upward momentum should be approached cautiously. Although data shows a more confident and long-term resilient investor base, price trends remain susceptible to external shocks.
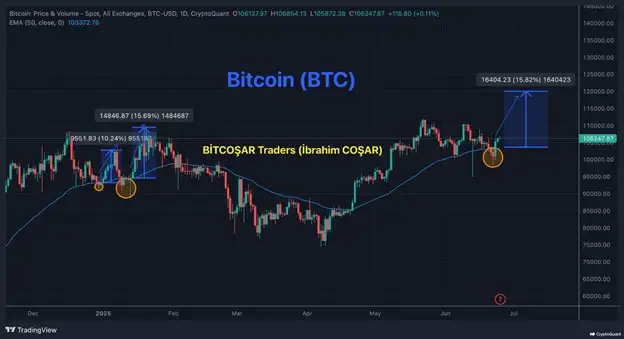
Bitcoin Reclaiming 50-Day Moving Average May Drive It to $120,000
Bitcoin's recent rise above the 50-day exponential moving average (EMA) may lay the groundwork for an ascent to $120,000.
The 50-day moving average remains a critical technical level, historically providing strong support during trend correction phases. The market repeatedly shows a pattern of brief drops below this level followed by quick recoveries, representing 10% to 20% bullish breakouts.
After a recent pullback, Bitcoin briefly traded below the 50-day moving average but has now closed above it for three consecutive days. Such a rebound is typically a bullish signal, and we've seen similar situations that have triggered significant rallies.
BTC bulls have taken the lead, thanks to the rising spot indicator CVD (Cumulative Volume Delta). The CVD indicator measures the net difference between buying and selling pressures by aggregating volume data, thus revealing the balance of market participant behavior. As observed, the CVD's rise indicates strong BTC spot demand, with the current price hovering around $108,000.
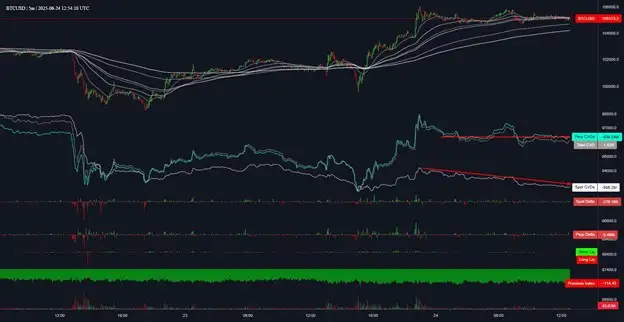
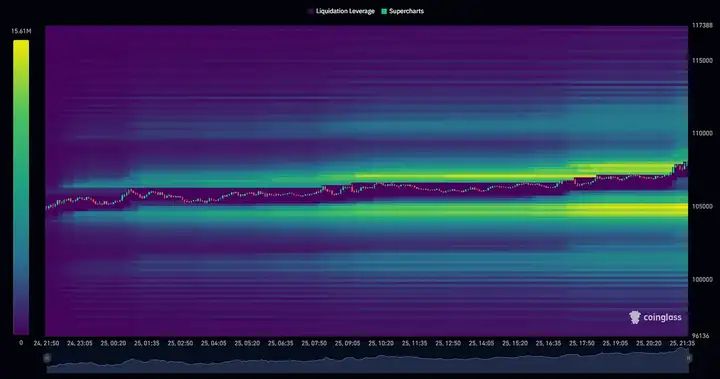
With the Middle East situation easing, Bitcoin rose from $100,000 to $108,000, quickly recovering the $106,000 support point in just two days. Despite no particularly positive news yesterday and average U.S. stock performance, Bitcoin's price continued to climb, likely to clear out short-side liquidity. Around 9 PM last night, the liquidation map showed almost all high-leverage short positions between $106,000 and $108,000 being cleared.
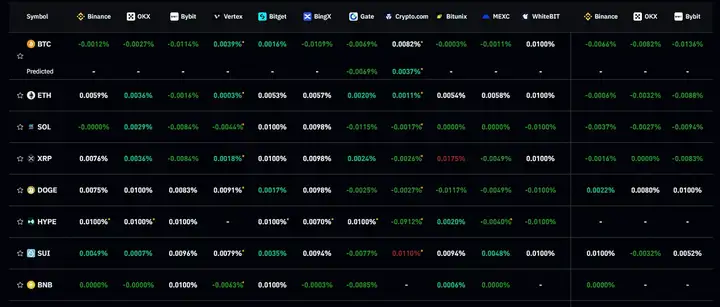
Looking at major exchanges, the funding rates for mainstream cryptocurrencies are negative, indicating more short positions than long positions, suggesting people believe Bitcoin's price should drop. However, such situations typically show sufficient market liquidity to allow the price to continue rising, so it's not ruled out that the price will continue to oscillate upward until most open short positions on exchanges are cleared.
Yesterday, Trump's attendance at the NATO summit, where he stated that Israel and Iran have a chance of conflict in a short time, caused a slight U.S. stock pullback and halted Bitcoin at $108,000. The market fears that a renewed Israel-Iran war could risk U.S. involvement, but currently, neither side shows obvious boundary-crossing behavior, so the market maintains a wait-and-see attitude. As for Bitcoin's trend, without any surprises, the next two days will focus on clearing liquidity at $105,000 and $108,000.


