The market, project, currency, and other information and views mentioned in this report are for reference only and do not constitute any investment advice. Written by 0xBrooker
This week, crypto assets experienced a triple intertwining of "institutional fund support, derivative market warning escalation, and geopolitical risk sudden amplification".
BTC continued to probe the $102,000-$109,000 range and experienced a brief panic sell-off during the weekend due to the US strike on Iranian nuclear facilities, followed by partial recovery.
The internal structural forces of the crypto market remained intact, serving as an important support for price stability, but short-term traders priced BTC downward due to intensifying geopolitical conflicts.
Subsequently, with internal structure stable, BTC's subsequent trend will entirely depend on whether the Iran-Israel conflict continues to escalate, such as Iran directly supplying US military bases and ships, or even blocking the Hormuz Strait. If the conflict gradually recovers, BTC will likely return to the $105,000 level.
Policy, Macroeconomic, and Economic Data
The Iran-Israel conflict escalated spirally this week.
From June 16 to 18, Israel continued "surgical" airstrikes targeting Iranian missile positions and Shiite militia command centers; Iran subsequently retaliated with ballistic missiles and drones, raising the battlefield temperature. The market immediately entered defense mode: Brent crude rose nearly 7% that week, briefly breaking the $78 mark; gold simultaneously rose, reaching a high of $33,452.37 per ounce.
On June 19, the White House publicly stated for the first time that it was "assessing military options", marking a turning point from behind-the-scenes coordination to open intervention. On the day of the announcement, Brent crude futures rose 2.8% to $78.85, a five-month high; the VIX volatility index increased, while US Treasury yields showed a safe-haven decline.
A brief easing occurred on June 20 - the market speculated that Washington might end with additional sanctions rather than military action, causing oil prices to slightly retreat and global stock indexes to experience a technical rebound.
However, just a day later, this optimistic "sanctions instead of strikes" was completely shattered: US President Trump ordered three B-2 stealth bombers to precisely strike three uranium enrichment facilities in Iran (Fordow, Natanz, and Isfahan) with GBU-57 "massive bunker buster" bombs in the early morning of June 21 Eastern Time. Trump declared in a TV speech that "key core capabilities have been reset to zero", suggesting the action could end if Iran is willing to negotiate.
This immediately triggered a violent diplomatic shock. UN Secretary-General Guterres described the situation as "fragile as an egg"; the EU and UK condemned Iran's nuclear ambitions while urging restraint. The Iranian Foreign Minister accused the US of "blatantly violating the UN Charter", vowing "equivalent or asymmetric retaliation" and not ruling out a "selective blockade" of the Hormuz Strait. The Iranian parliament subsequently passed a resolution that could close the Hormuz Strait (affecting 20% of global oil export transportation), with the final decision to be made by Iran's Supreme National Security Council.
As the airstrike occurred during the weekend market closure, mainstream financial markets' pricing is yet to be revealed, but derivatives and offshore trading have provided forward-looking signals: energy and military ETFs rose in night trading; CME crude oil options OI significantly increased above the $90 strike price; high-risk crypto assets saw initial selling pressure, with BTC dropping about 1.14% and ETH falling over 2.96% during trading.
In last week's report, we proposed that BTC's short-term trend depends on the progress of "geopolitical conflicts". If conflicts escalate, risk assets including BTC will remain volatile or be priced downward; if conflicts ease, equity assets might gradually recover losses.
The US direct intervention this week escalated the conflict, driving BTC down 4.36% or $4,602.38 for the week. If Iran's retaliatory actions involve supplying US military bases or "blocking" the Hormuz Strait, it will further impact the downward pricing of global US stocks and crypto assets.
This week's events have pushed the Middle East situation into a gray area between "controllable confrontation" and "proxy escalation", with the market entering a typical "oil inflation - US Treasury safe haven - tech pullback - precious metals favored" mode. If Iran's retaliation remains limited by domestic political and military capabilities in the coming weeks, the market might digest the situation amid high volatility; however, if the conflict further spreads to maritime energy routes or US military bases, the global asset repricing's magnitude and rhythm will significantly intensify.
Historical data shows that BTC often initially retreats during geopolitical crises and subsequently recovers with a weak negative correlation to gold; however, if the conflict evolves into a dual squeeze on global liquidity and funding costs, Bitcoin and Ethereum's sensitivity will be significantly amplified.
Crypto Market
This week, crypto assets experienced a triple intertwining of "institutional fund support, derivative market warning escalation, and geopolitical risk sudden amplification". BTC continued to probe the $102,000-$109,000 range and experienced a brief panic sell-off during the weekend due to the US strike on Iranian nuclear facilities, followed by partial recovery.
At the beginning of the week, market expectations of "controllable" Iran-Israel conflict brought a slight recovery: BTC rebounded to a high of $109,000, with Bitcoin spot ETF net inflows for eight consecutive trading days. This funding data provided critical support for prices amid macro noise. Against the background of cooling in-market funds, institutional buying power became the primary force maintaining BTC price above $100,000.
Subsequently, the June 19 FOMC result of "hold steady + dot plot deceleration" did not disrupt BTC's oscillation rhythm, but futures markets showed increasing hedging scale.
Friday's post-market data showed ETH ETF experiencing its largest single-day net outflow in June ($11.3 million), with institutional deleveraging triggering a chain reaction, causing ETH to plummet to $2,372, expanding trading volume and simultaneously driving high-beta assets like SOL and DOGE to retreat.
During the US market session on June 20, an in-market high-leverage squeeze quickly pushed BTC below $103,000, with over 90% being long positions; ETH, SOL, and others fell 6-9%. This "instant liquidation" event confirmed the fragility of excessive derivatives leverage and marked the market's first large-scale systematic liquidation since May's rapid upward movement.
The risk peak during the weekend occurred in the early morning of June 21-22 Eastern Time: News of the US B-2 bombers' precise strike on three Iranian uranium enrichment facilities broke the weekend liquidity vacuum. As the only 24/7 real-time trading large asset class, BTC briefly dropped below $100,000 but closed down -1.14%, showing relatively strong performance. However, ETH, after falling nearly 10% over two consecutive days, dropped another 2.96%, indicating the extremely fragile liquidity of high-risk assets.
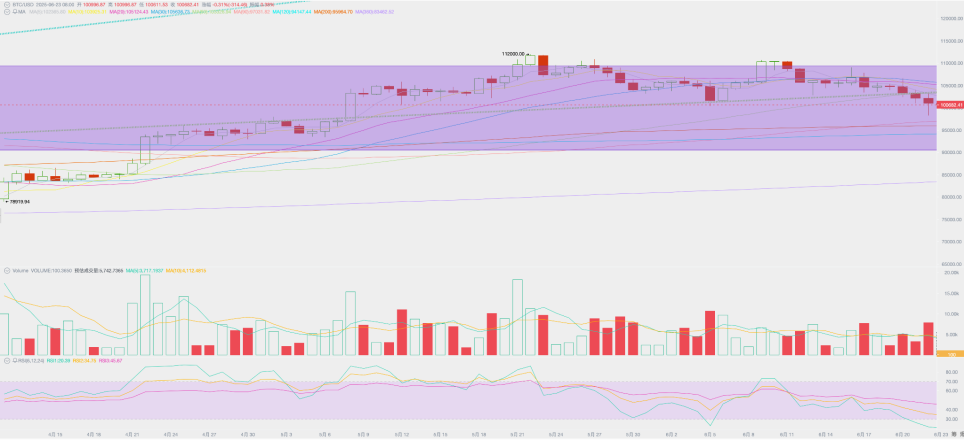
From a technical indicator perspective, the geopolitical conflict caused BTC to temporarily break below the first upward trend line but still operates within the $90,000-$110,000 range. We believe that the internal structural tension remains intact, with minimal changes in fund support. BTC's downward pricing this week was due to panic caused by escalating geopolitical conflicts. If the conflict continues to escalate, this impact will gradually dissipate, but further escalation will test the critical support levels of $100,000 and $90,000.
Capital Inflow and Outflow
After the major rebound in April and May, capital inflow has become differentiated, with stablecoin channel funds beginning to weaken, while BTC Spot ETF channel funds remain relatively robust and stable.
This week, BTC Spot ETF channel funds inflow was $1.022 billion, significantly weakening compared to last week's $1.384 billion, but still maintaining a high level. However, next week this data may face significant challenges, and if geopolitical conflicts continue to cool down US stocks, BTC Spot ETF channel funds are likely to struggle to maintain an independent trend.
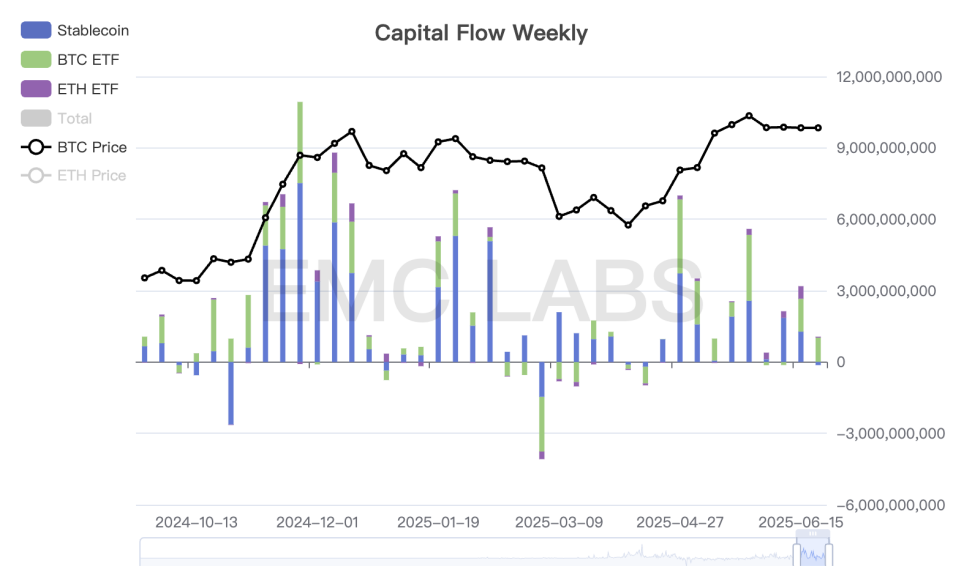
Cryptocurrency Market Fund Entry Statistics (Weekly)
Stablecoin channels saw an inflow of $1.273 billion last week, but this week turned to an outflow of $132 million. This rapid cooling is consistent with the trends we observed in the futures and lending markets.
This week, ETH Spot ETF inflow was $40.77 million, with reduced inflow in the first half of the week, turning to an outflow of over $100 million by Friday. The decrease in ETH fund inflow may put pressure on high-beta assets. A flash crash could cause significant damage to the market.
Selling Pressure and Liquidation
Against the backdrop of delayed interest rate cuts and geopolitical tensions, BTC price remains at a high of $10-12, with decisive forces coming from institutional allocation and internal structural tensions.
This week, long-term holdings continued to increase by 28,920 coins, while short-term holdings decreased by 24,650 coins. Centralized exchange inventory continued to decrease. Due to panic selling and reduced speculative enthusiasm, this week's exchange outflow significantly decreased to 1,555.9 coins.
These data may indicate that long-term holders' confidence in BTC is continuously strengthening, but short-term traders' enthusiasm is cooling faster. BTC's short-term pricing is jointly determined by internal short-term traders and BTC Spot ETF channel funds. Currently, both are showing cooling signs. If the Iran-Israel conflict is quickly resolved, BTC might turn the situation around and return to the $105,000 range. If the situation worsens, it's likely to fall below $100,000, and potentially test $90,000 (low probability).
EMC Labs believes the logic of BTC's medium to long-term price trend remains unchanged, unless the Iran-Israel conflict evolves into a regional war involving the United States.
Cycle Indicators
According to eMerge Engine, the EMC BTC Cycle Metrics indicator is 0.625, currently in an upward phase.

EMC Labs was established in April 2023 by crypto asset investors and data scientists. Focusing on blockchain industry research and Crypto secondary market investment, with industrial foresight, insights, and data mining as core competencies, committed to participating in the booming blockchain industry through research and investment, and promoting blockchain and crypto assets for human benefit.
For more information, please visit:https://www.emc.fund