Despite recent volatility, renowned analysts argue that XRP's technical composition is not yet bearish. They emphasize critical price levels to confirm the trend.
Technically evaluating XRP's chart over the past 5 days provides context to these analysts' perspectives.
Analysts Cautiously Optimistic About XRP Price
XRP price dropped nearly 7% last week. This is particularly attributed to heightened geopolitical tensions due to US strikes on Iranian facilities. The altcoin fell to a low near $1.90 from around $2.20 and stabilized at $2.06.
Veteran trader Peter Brandt highlighted a potential head and shoulders (H&S) pattern on the XRP chart. This is traditionally a bearish indicator signaling a reversal from bullish to bearish, if key support levels break.
However, Brandt emphasizes caution against hasty bearish conclusions. He explicitly mentions the importance of XRP maintaining support above $1.80.
Treat the Apr 7 overshoot as an out-of-line movement and we have a possible H&S top in $XRP
— Peter Brandt (@PeterLBrandt) June 23, 2025
For the sake of the uneducated trolls among you, this chart need NOT be interpreted as bearish
Price is at support right now
I will review if price closes below 1.8xxxx pic.twitter.com/YlsqLi2SzN
A decisive weekly close below that critical level is needed to confirm the bearish scenario.
Meanwhile, analyst EGRAG CRYPTO provided a detailed bullish perspective using multiple technical indicators.
The Gaussian channel is a volatility indicator used to identify trend strength and potential reversals. Closing within this channel's boundary, currently around $1.75, could weaken momentum and create downward pressure.
EGRAG emphasizes the importance of XRP staying above this boundary to maintain bullishness.
Additionally, the 21-week moving average is a crucial moving average traders use to identify macro trends.
Closing above the EMA level of $2.33 indicates strong bullish momentum.
Furthermore, breaking the $2.65 resistance would confirm a robust long-term bullish trend.
EGRAG also applies Elliott Wave analysis, a technical approach identifying recurring patterns (waves) in market prices to predict potential targets.
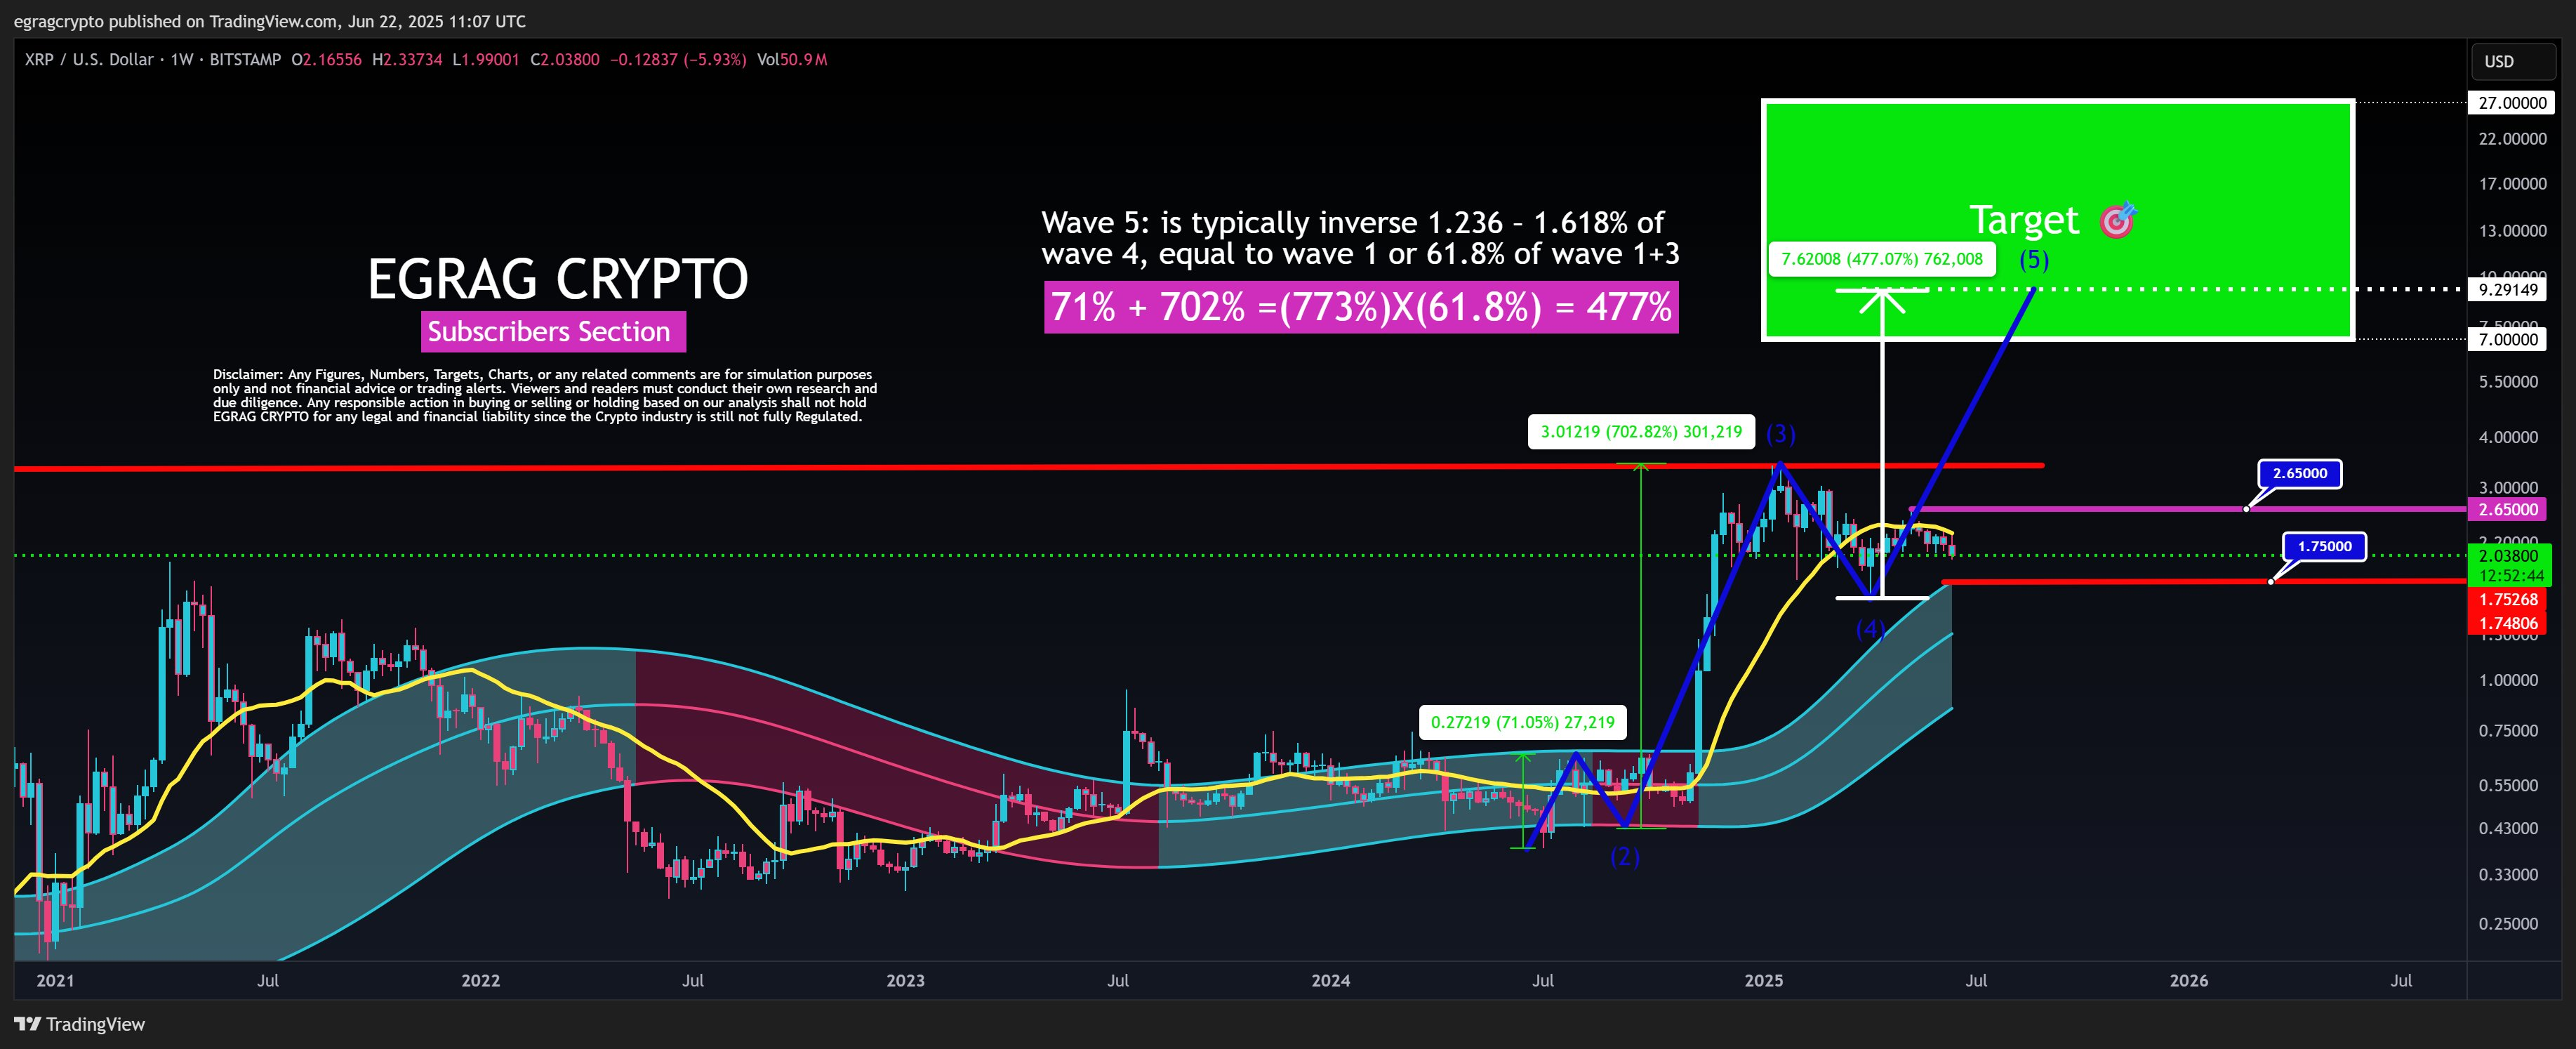
Using Elliott Wave ratios, the analyst predicts XRP could reach between $9 and $10 if it successfully completes the expected fifth wave, provided current support levels are firmly maintained.
Short-Term Technical Analysis Requires Caution
XRP experienced significant selling pressure as its price sharply dropped to $1.90. This was confirmed by a notable decline in the accumulation/distribution (A/D) line.
The A/D line measures cumulative buying and selling pressure, and its decline indicates increased trading volume during price drops, reflecting strong seller activity.
As XRP price reached support near $1.90, the A/D line stabilized and began slightly rising during the rebound, indicating resumed buyer activity.
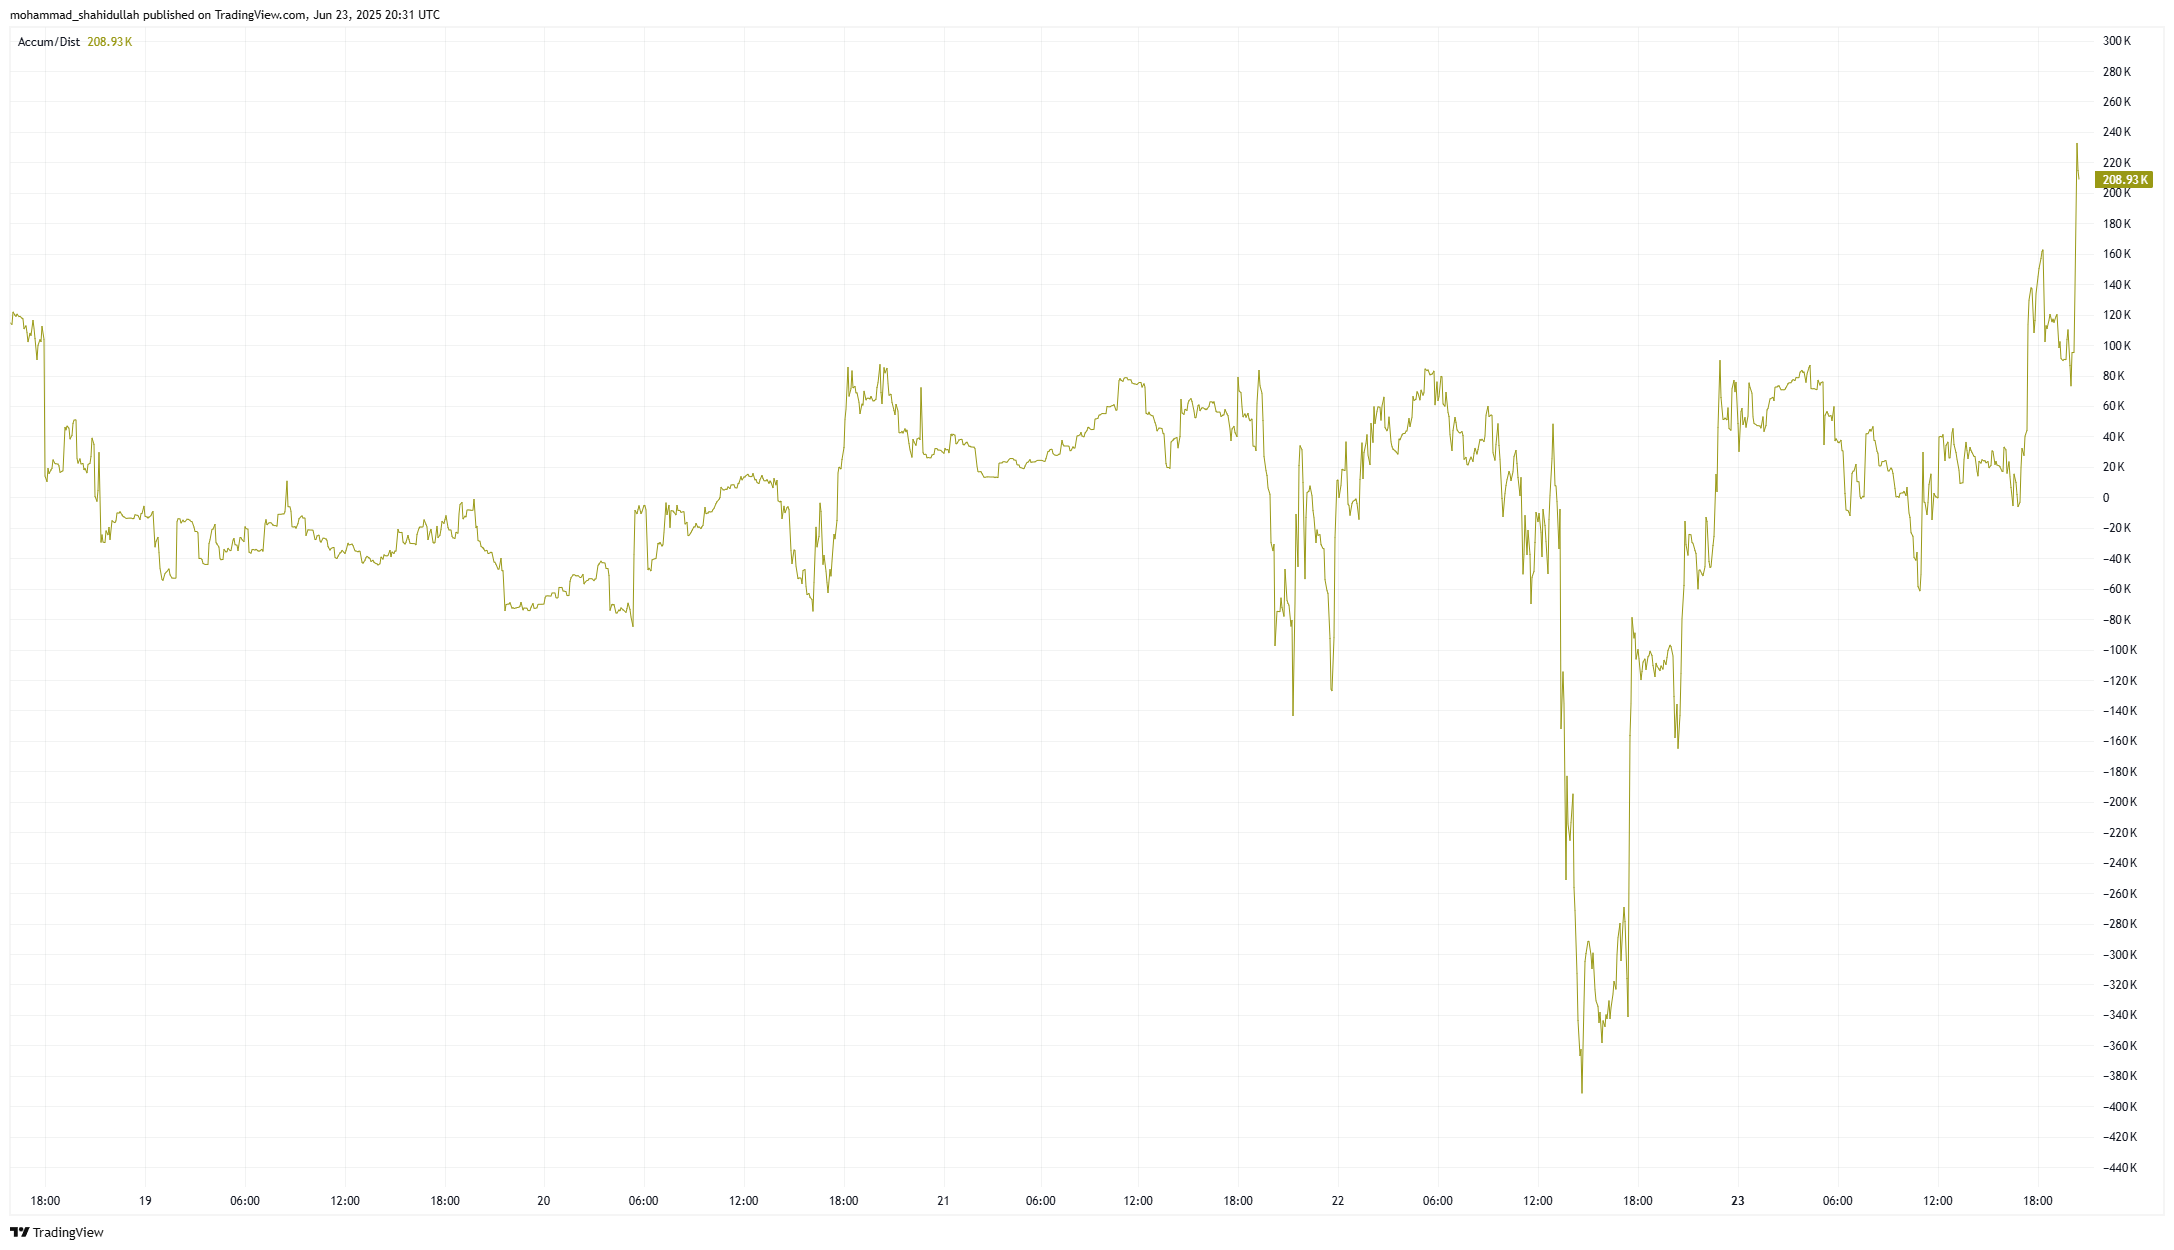
However, the accumulation during this rebound did not fully neutralize the previous distribution, suggesting caution is needed.
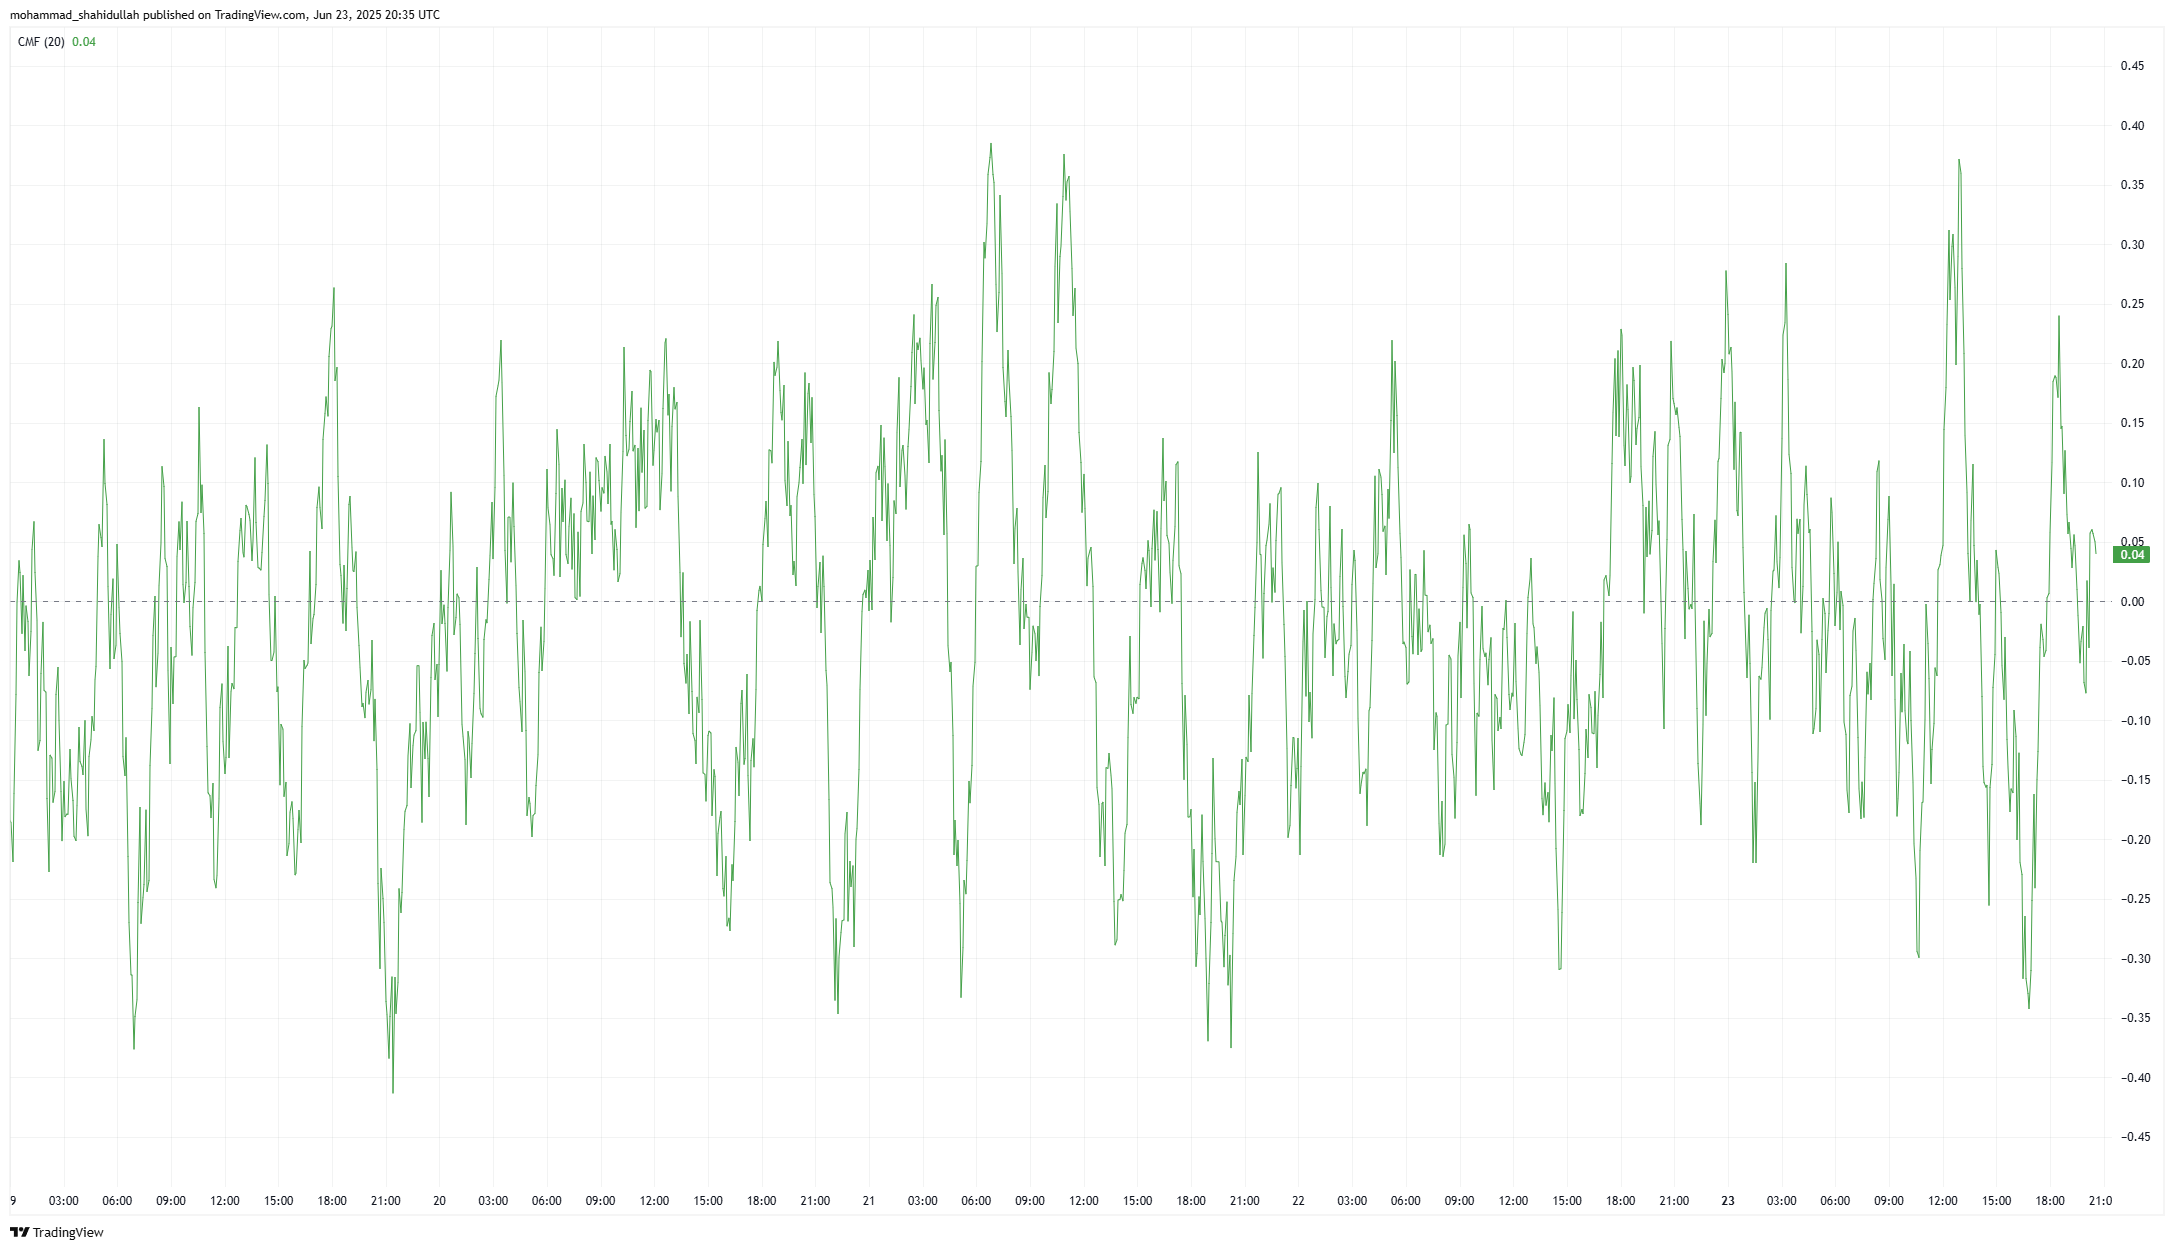
Meanwhile, the Chaikin Money Flow (CMF), an indicator showing the strength of money flowing into an asset, confirmed strong outflows during selling and turned negative.
The CMF somewhat improved during XRP's rebound but remains bearish, failing to enter positive territory. This indicates buyers are still maintaining caution.
XRP Correction…Key Levels to Watch
These technical indicators suggest XRP is currently in a cautious correction. While support near $1.90 was strong, the CMF's limited improvement indicates ongoing market uncertainty.
Overall, this analysis aligns with analysts' views that key support between $1.75 and $1.80 is being maintained. Only a decisive weekly close below these supports would confirm a bearish outlook.
Traders should carefully monitor XRP's interactions with its key support and resistance levels.

Specifically, breaking above $2.33 and $2.65 could sustain the uptrend, while definitively breaking below the $1.75-$1.80 support could increase downside risks.