Bitcoin's price has been significantly fluctuating over the past two months, forming a decline pattern that raises concerns among investors. After a sharp rise, Bitcoin has recently encountered resistance, and the current pattern suggests potential further losses.
Bitcoin has repeatedly failed to break through major resistance levels. The market sentiment is increasingly turning cautious. Some suggest a potential drop to $92,000.
Bitcoin Overbought Condition
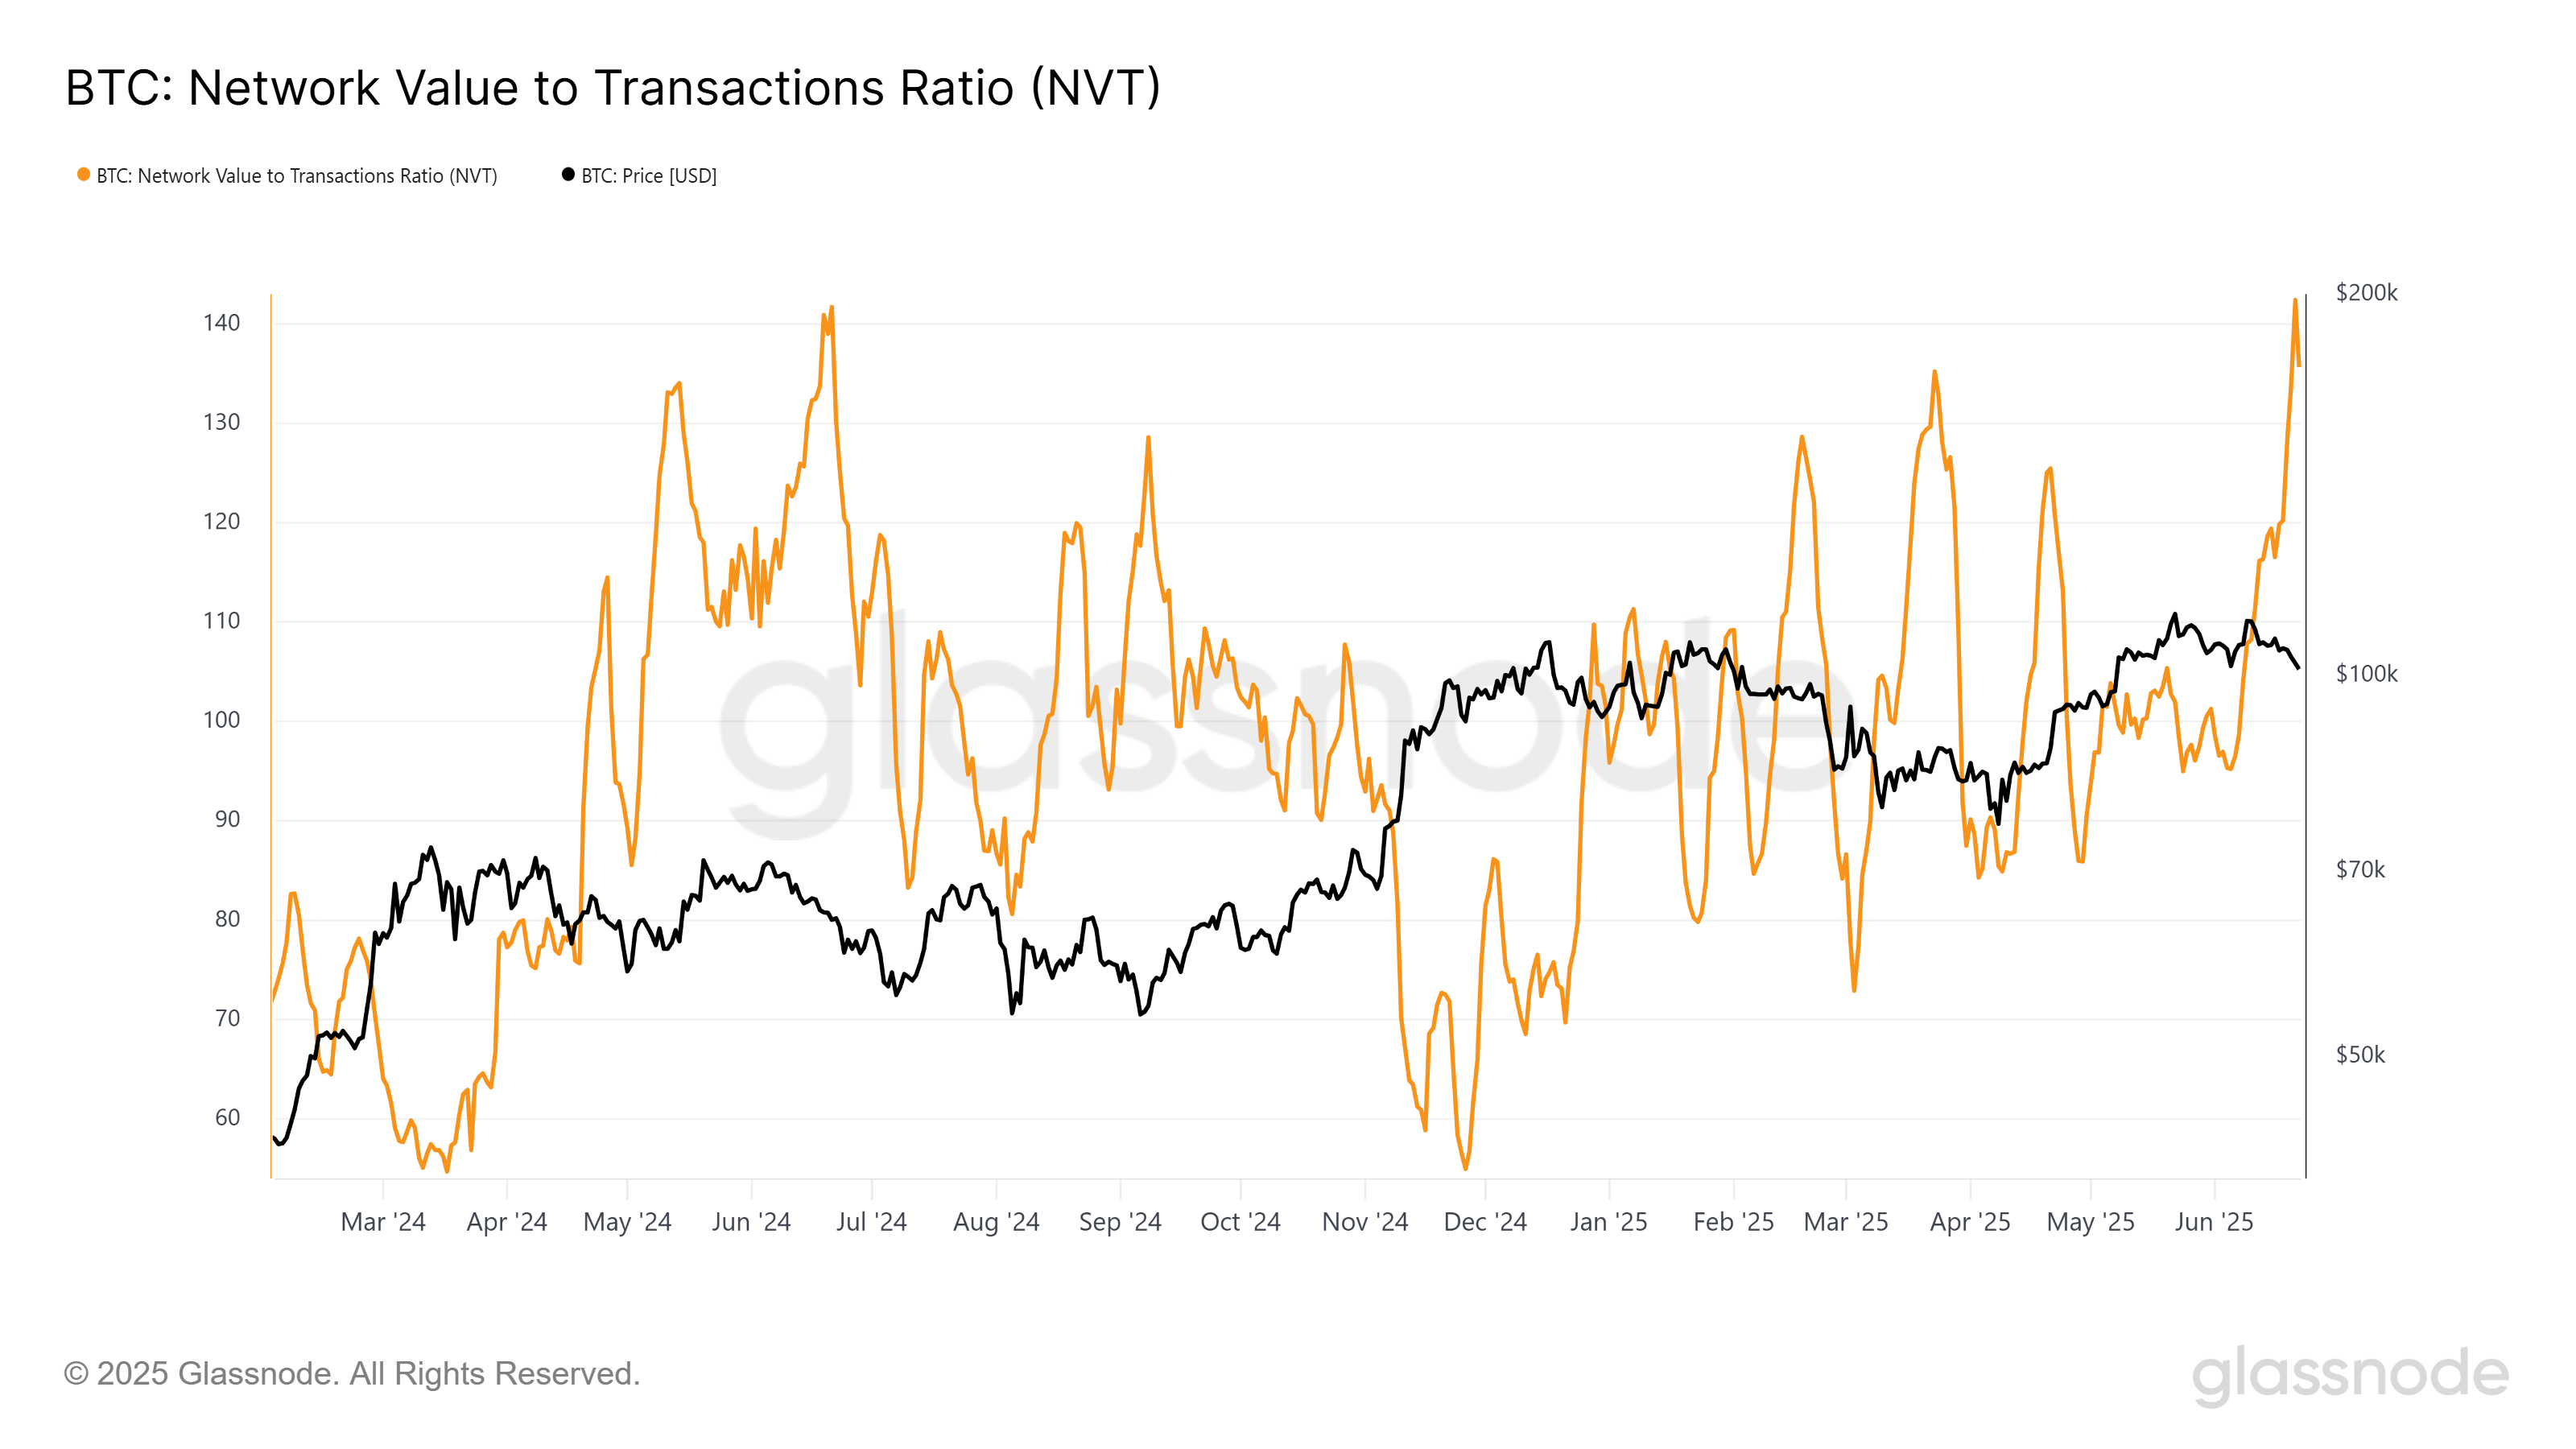
Bitcoin's Network Value to Transactions (NVT) ratio is currently at its highest level in a year, indicating that network valuation far exceeds trading activity. Historically, such spikes in the NVT ratio have often been a precursor to market corrections.
This suggests that Bitcoin may be overvalued and could lead to a potential price adjustment. A slight decline in the NVT ratio was observed over the weekend, but this was mainly due to external factors and did not change the overall trend.
Bitcoin remains vulnerable as an overbought asset, and historical patterns show that corrections often follow such accumulation.
Moreover, the Bitcoin liquidation map indicates that over $1.17 billion in long positions could be liquidated if Bitcoin's price drops to $92,000. This potential surge in liquidations suggests significant risk for those holding long positions.
While positive funding rates have inspired some optimism, the liquidation map shows that Bitcoin could face substantial downward pressure if it reaches $92,000. This suggests that the downward trend is not yet over and that Bitcoin may struggle to maintain prices above key support levels.

BTC Price, Risk of Losses
Bitcoin is currently forming a double-top pattern, or an inverted W pattern. This pattern is typically considered a bearish signal and suggests Bitcoin may experience a correction if verified. The formation of this pattern over the past two months emphasizes increasing selling pressure, which could lead to further price declines.
The pattern is currently maintaining above $100,000, but a drop below this critical level would confirm the bearish setup. If Bitcoin's price falls below $98,000, it is likely to target $92,000, representing a 9% decline. This would trigger additional selling, reinforcing the bearish outlook for Bitcoin in the short term.
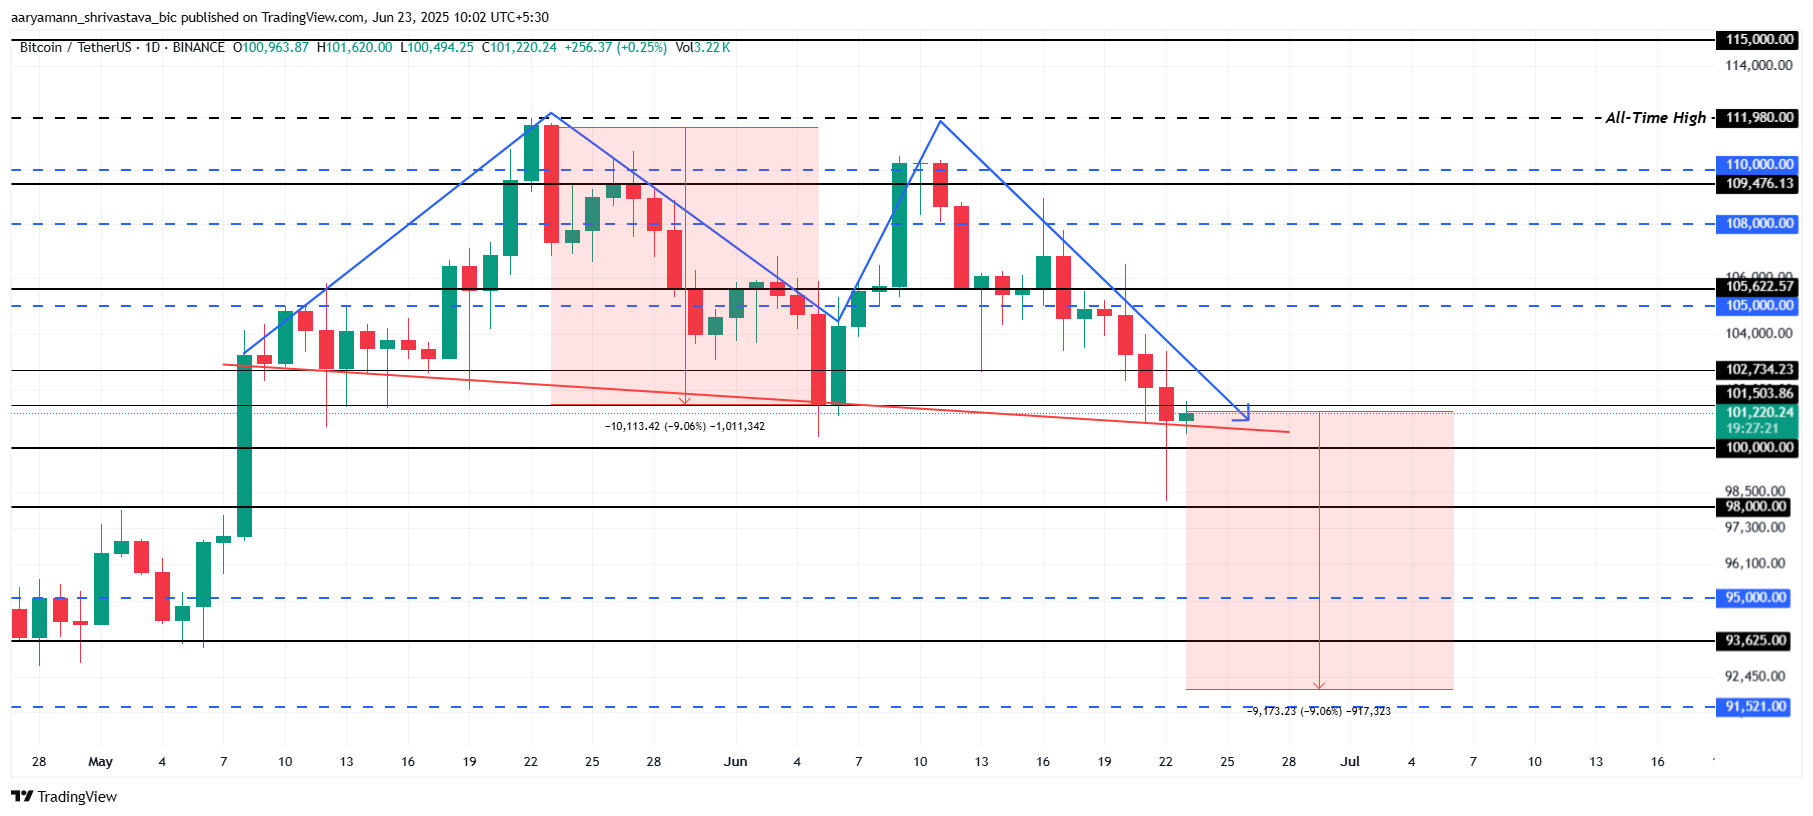
However, if the overall market conditions improve and Bitcoin can maintain above the $100,000 support level, it could rebound. A recovery that transforms the $102,734 resistance into support would signal a shift to an upward trend. This could potentially drive Bitcoin's price to $105,000, invalidating the current bearish narrative.