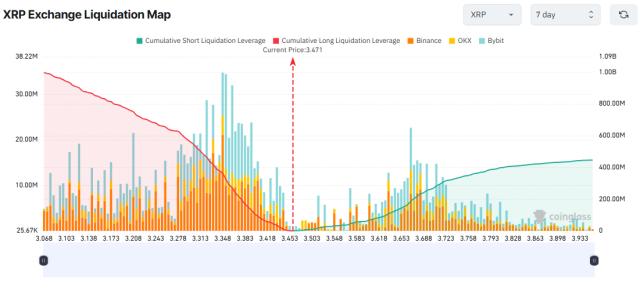
Solana's (SOL) market capitalization is over $80 billion, but it has dropped more than 10% in the past 30 days. Despite a recent rebound, the price has remained below $170 since May 29. The RSI has recovered to 54.51 but has not exceeded 60, indicating a lack of strong upward momentum.
The Ichimoku Cloud is still red and thick, showing strong resistance. The conversion line has crossed the baseline, but the price remains within the cloud. The moving average structure is still bearish, with the short-term line below the long-term line. Solana needs strong momentum to confirm a trend reversal.
Solana's RSI Rebounds…Difficulty Breaking 60
SOL is showing initial signals of momentum shift, with the Relative Strength Index (RSI) currently at 54.51, significantly up from 39.26 three days ago.
Since yesterday, the RSI has been attempting to break above the 60 level, which often indicates strong upward momentum.
The rise from below 40 suggests a recovery of buyer interest, but the RSI remains in the neutral zone, indicating that buyers are hesitant to fully regain control.
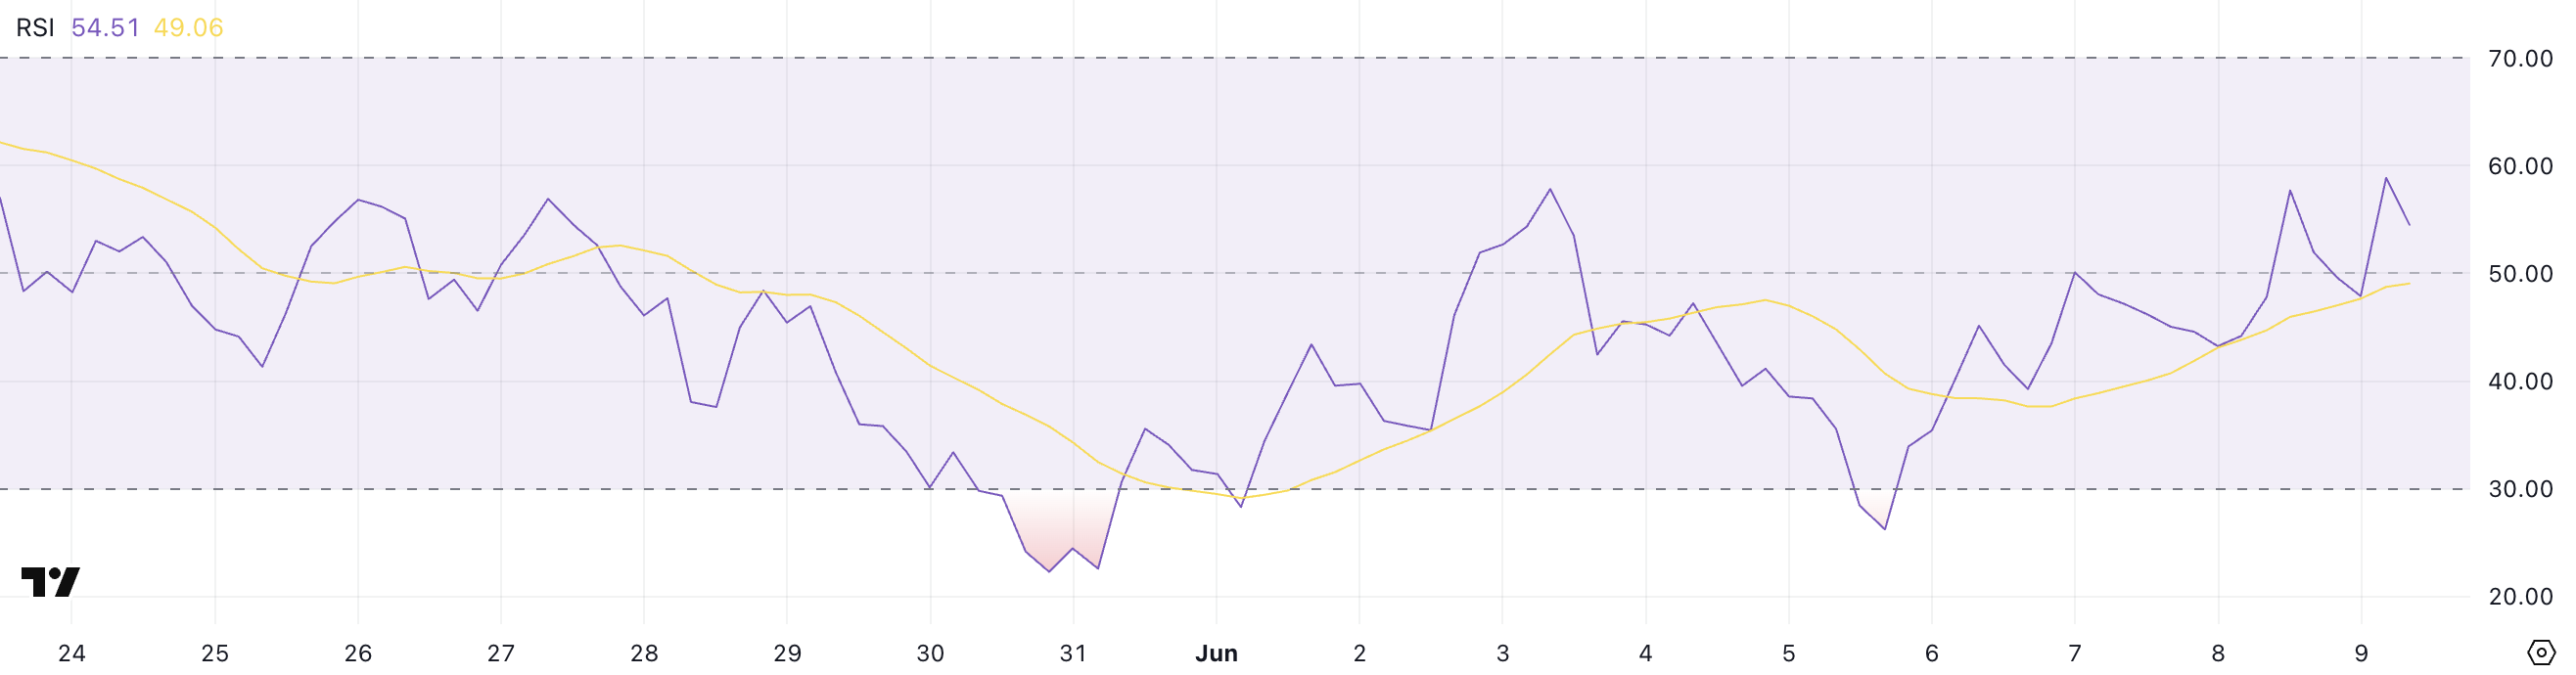
The RSI is a widely used momentum indicator ranging from 0 to 100. It is designed to measure the speed and change of price movements.
Values above 70 indicate an overbought state, while below 30 indicate an oversold state. Values near 50 are considered neutral.
With SOL's RSI currently at 54.51, the market is cautiously showing an upward trend, but may be limited in short-term additional increases if it fails to break above 60.
SOL Struggles Against Weak Ichimoku Cloud Resistance
Solana's price is testing an important resistance zone defined by the Ichimoku Cloud. Recent price has been pushed up from below the red cloud, indicating an attempt to reverse the current downward trend.
However, the cloud remains thick and red, showing strong resistance and suggesting that overall market sentiment has not yet shifted to an upward trend.
Leading Span A (green line) remains below Leading Span B (red line), confirming that the cloud is still in a downward alignment.
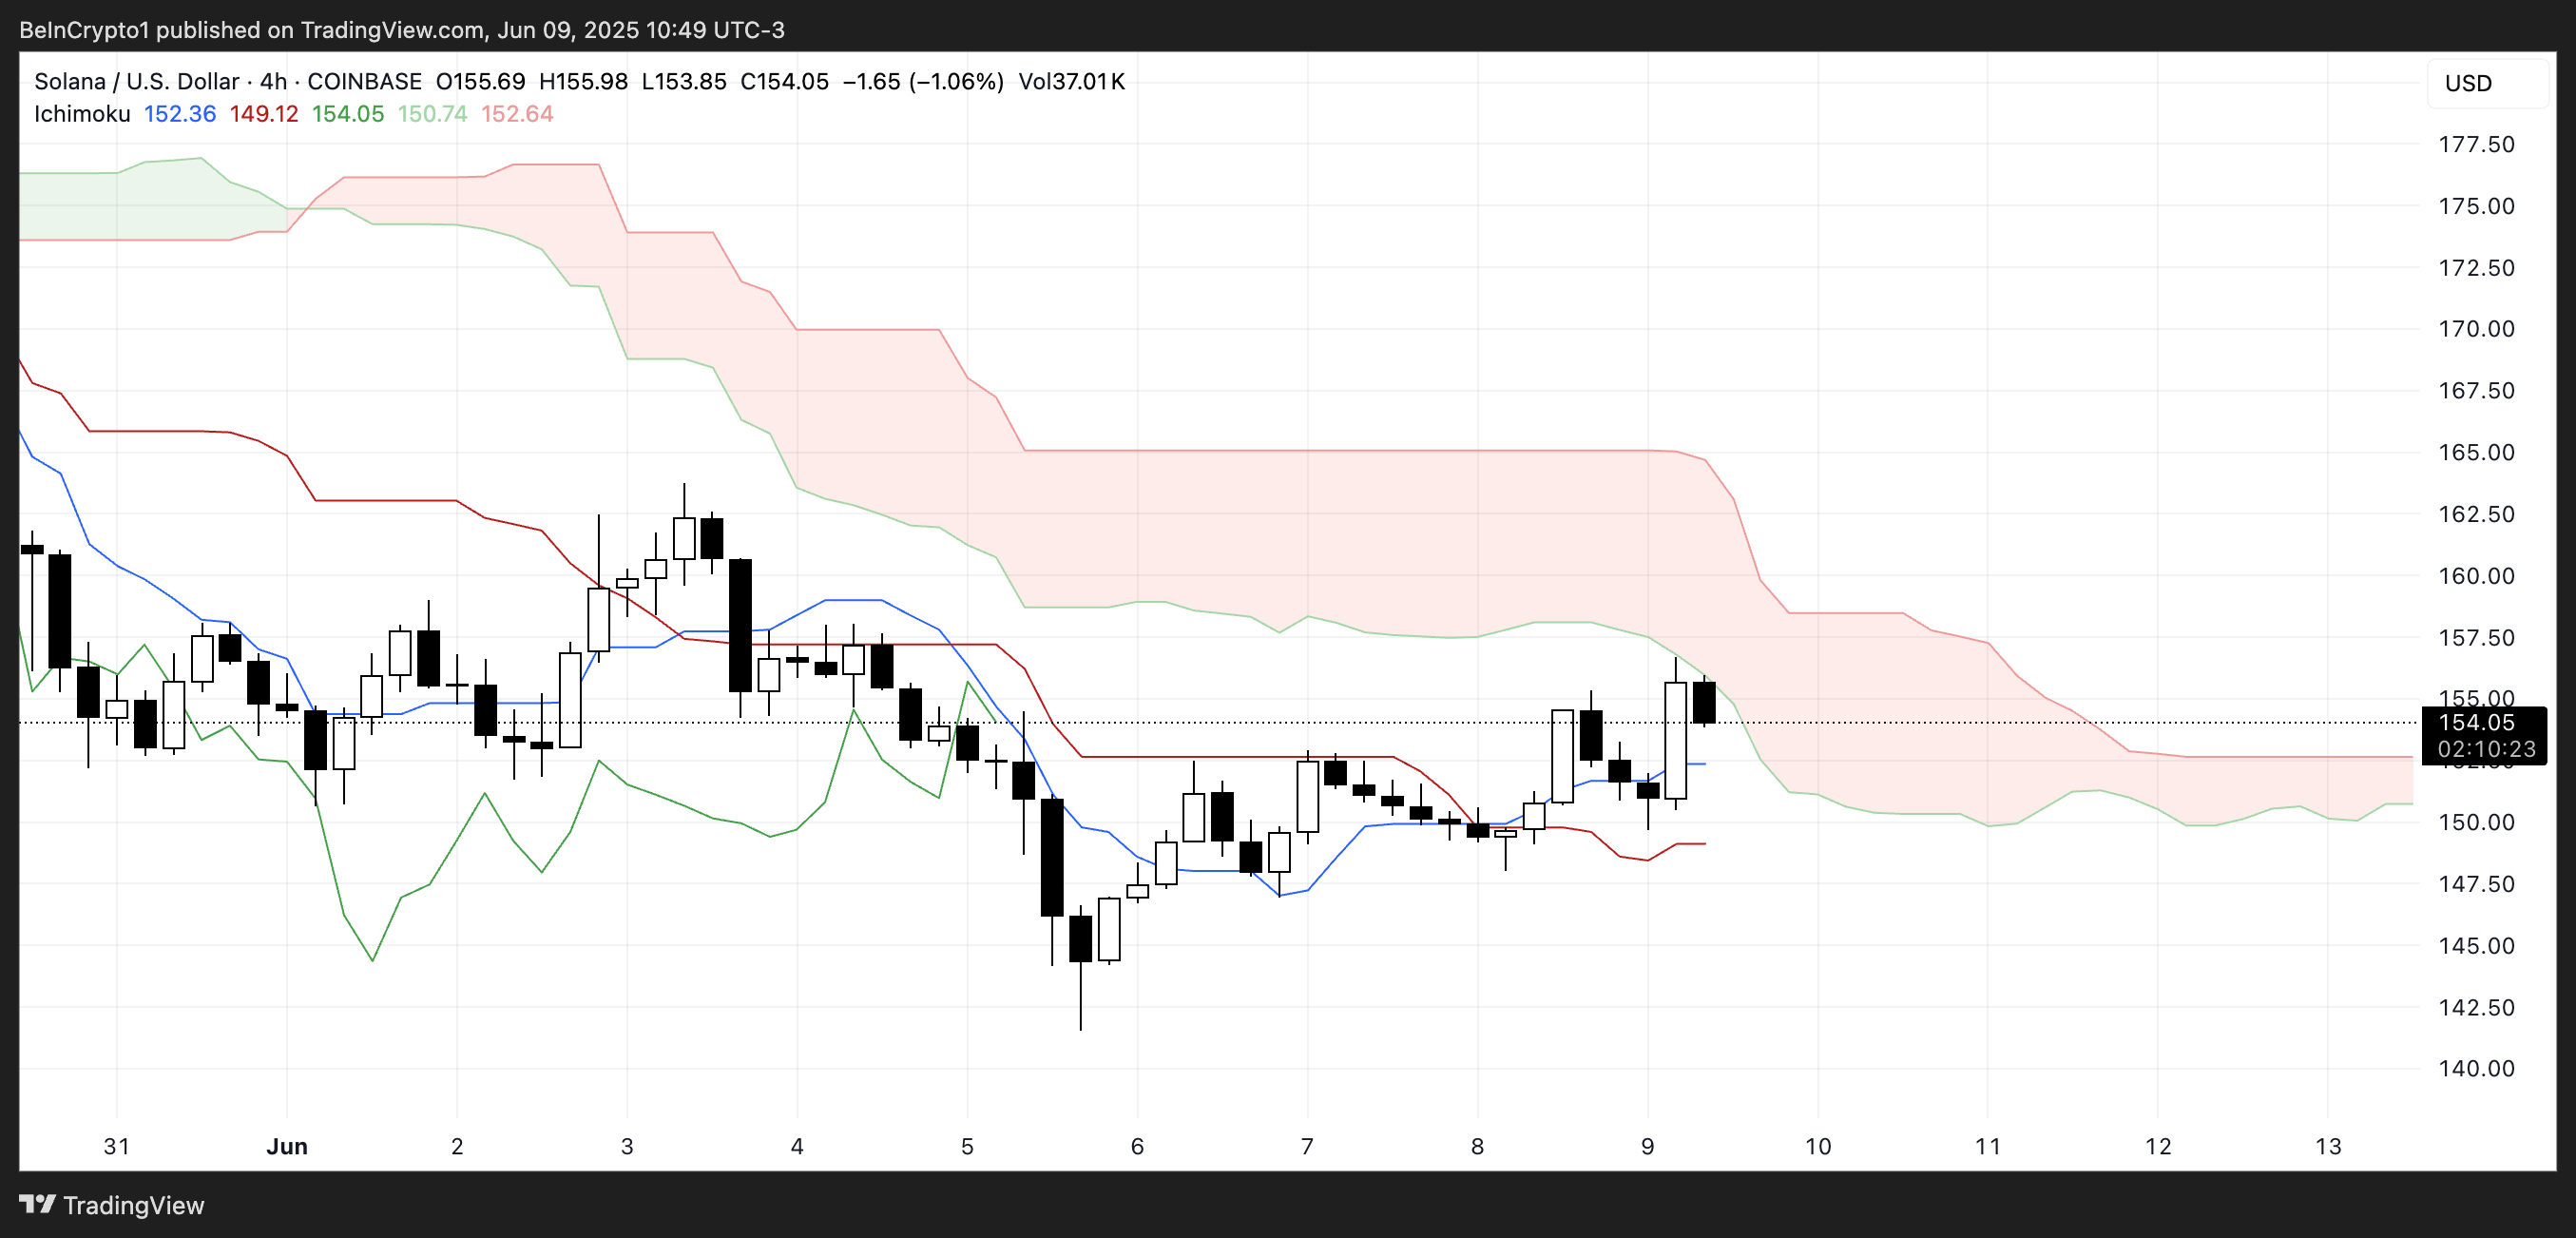
The conversion line (blue line) has crossed above the baseline (red line), which is typically an early bullish signal. Additionally, the price is hovering around this conversion line, showing short-term upward momentum.
However, with the price still within the cloud and the future cloud continuing to predict resistance, SOL needs a strong breakout to confirm a bullish reversal.
Until then, the trend remains uncertain, with the upper boundary of the cloud acting as a major obstacle.
Solana Breaks $150 Line…Moving Averages Still Weak
Solana's price has risen nearly 8% over the past four days, breaking through $150 and showing renewed upward interest.
Despite this rise, moving averages still reflect a downward trend, with short-term averages below long-term averages. If the current momentum continues, SOL could rise to higher prices and test the $163.76 resistance.
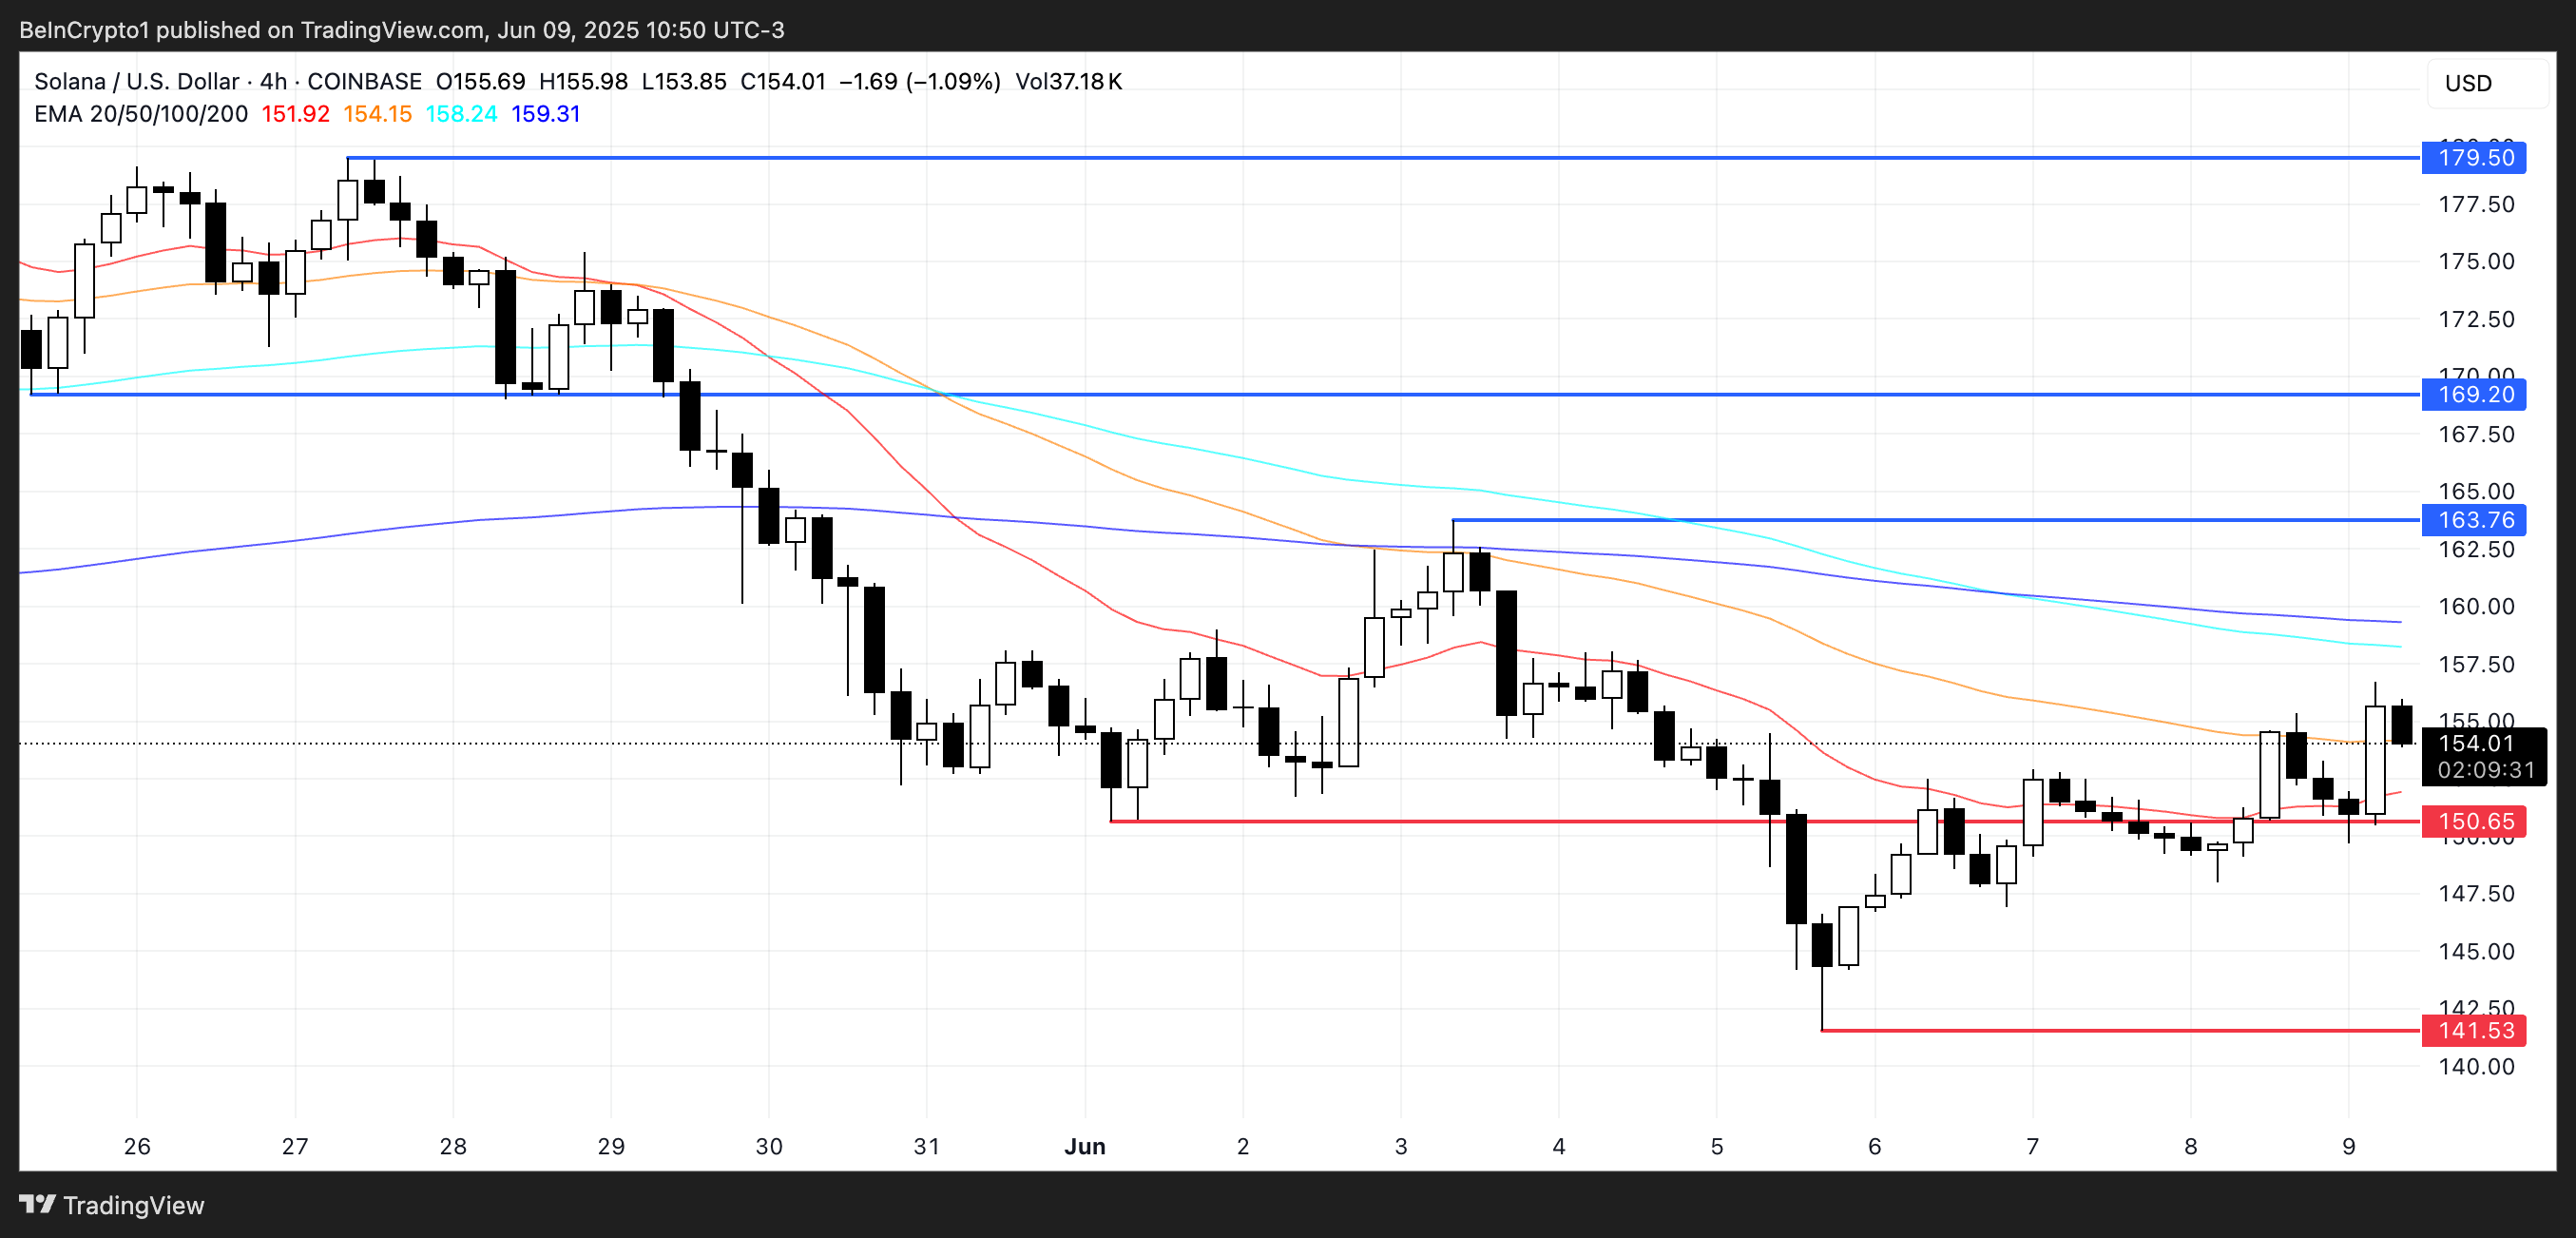
A breakout there could open the way to $169.20, and in a strong and sustained buying scenario, the price could rise to $179.50, potentially representing a 16.7% increase from current levels.
However, this upward path depends on the strength of the ongoing upward trend.
If Solana fails to maintain its recent breakout level and loses support at $150.65, the price could drop back to $141.53.