Hyperliquid (HYPE) is surging strongly, increasing 24.5% in the past 24 hours and nearly 82% in the past 30 days. This platform continues to be among the most profitable in the cryptocurrency field, generating 5.6 million USD in fees in the past day and 56 million USD in the past month, ranking 9th among the highest-income chains or protocols.
As HYPE surpasses $33 and approaches its All-Time-High, technical indicators show both strength and potential warning signs. Momentum remains high, but the oversold RSI and sharp decline in BBTrend suggest potential short-term volatility.
HYPE RSI reaches 82, signaling overbought conditions after sudden surge
HYPE's RSI has soared to 82.19, sharply increasing from 49.98 just a day earlier, a strong indicator of rapid momentum growth.
RSI is a momentum oscillator measuring price movement speed and change, ranging from 0 to 100.
Indices below 30 typically indicate oversold assets, while indices above 70 suggest it is overbought and may need adjustment or consolidation.
 HYPE RSI. Source: TradingView.
With HYPE's RSI currently above the 70 threshold, the token is now in the overbought zone.
This level typically signals that price momentum has extended too far too quickly, increasing the likelihood of short-term correction or sideways movement.
However, strong RSI indicators can also be maintained in parabolic movements, especially if volume and market sentiment remain high. Traders will closely monitor signs of momentum weakening or price divergence that could mark a potential reversal.
HYPE BBTrend turns negative, signaling strong momentum reversal
HYPE's BBTrend has sharply dropped to -7.19, from 1.57 just a day earlier, ending three days in the positive zone. BBTrend (Bollinger Band Trend) measures price strength and direction relative to Bollinger Bands.
Positive values indicate upward momentum, while negative values suggest increasing downward price pressure.
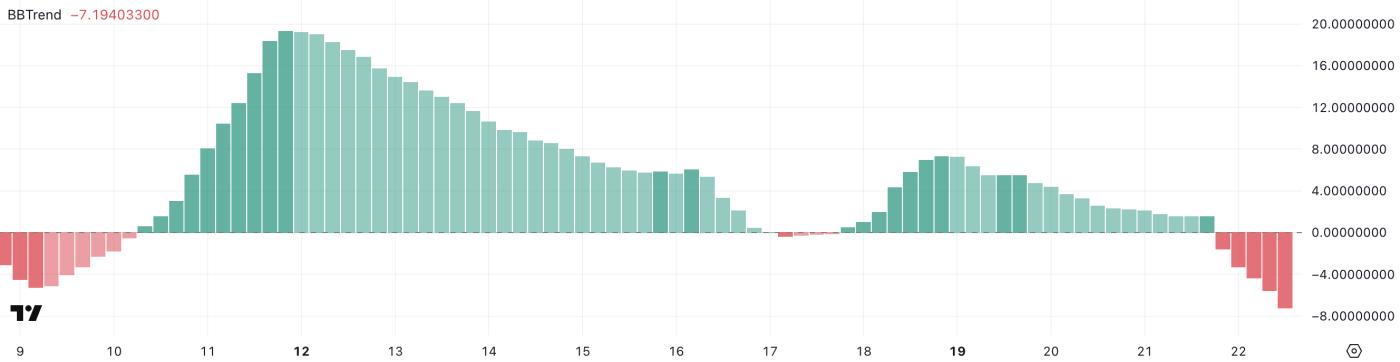 HYPE BBTrend. Source: TradingView.
A BBTrend index at -7.19 signals a sudden shift towards downward momentum. This sharp decline may reflect increased downward volatility and could lead to further selling if this trend continues.
For Hyperliquid, this reversal suggests caution, especially if it coincides with volume reduction or important support levels being challenged.
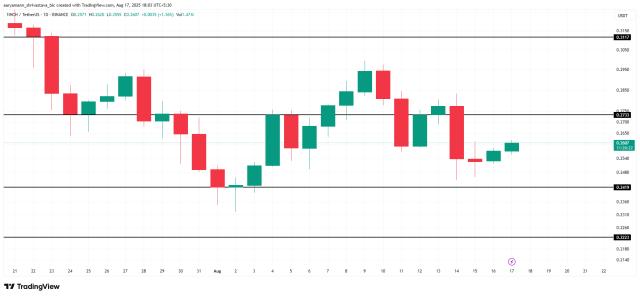
Hyperliquid surpasses $30, only 5% from ATH—but BBTrend warns caution
HYPE is now only 5% away from its All-Time-High, crossing $30 today for the first time since December 2024.
The EMA structure remains strongly bullish, with short-term moving averages above long-term averages, typically a signal of sustained upward momentum.
If the current trend holds, HYPE could surpass $34 and potentially reach $35 in the short term.
 HYPE Price Analysis. Source: TradingView.
However, the recent decline in BBTrend suggests the upward trend may be weakening.
If momentum changes, Hyperliquid might test support at $28.2.
A break below that level could push the price down to $24.32, with a risk of further decline to $21.5 if downward pressure increases.