


Get the best data-driven crypto insights and analysis every week:
Is Bitcoin Decoupling from the Market?
By: Tanay Ved, Victor Ramirez
Key Takeaways:
Bitcoin’s correlations with equities and gold have recently fallen near zero, suggesting a unique phase of decoupling typically seen during major market catalysts or shocks.
While Bitcoin’s correlation to interest rates is generally low, shifts in monetary regimes have influenced its behavior, with the strongest negative correlation to rate hikes appearing during the 2022–2023 tightening cycle.
Despite its reputation as “digital gold,” Bitcoin has historically exhibited higher beta and stronger upside sensitivity to equities, especially during bullish macro conditions.
Bitcoin’s realized volatility has steadily declined since 2021, now trending closer to that of popular technology stocks and reflecting a maturing risk profile.
Introduction
Is Bitcoin decoupling from the broader market? Bitcoin’s recent outperformance relative to gold and equities has re-ignited this narrative. Over its 16 year history, Bitcoin has taken on many labels from “digital gold” to “store of value” to a “risk-on asset”. But does it reflect these characteristics, and live up those labels? And is Bitcoin unique enough as an investment or just a levered expression of risky assets that already exist in markets?
In this issue of Coin Metrics’ State of the Network, we’ll explore how Bitcoin has behaved across different market environments, highlighting the catalysts and conditions behind periods of low correlation with traditional assets like equities or gold. We also examine how shifts in monetary regimes have influenced Bitcoin’s performance, assess its sensitivity to the broader market, and contextualize its volatility profile relative to other major assets.
Bitcoin Across Interest Rate Regimes
The U.S. Federal Reserve is one of the most influential forces in financial markets because of its ability to affect interest rates. Changes in the federal funds rate directly impacts money supply, market liquidity and investor risk appetite, both during tightening or loosening conditions. Over the past decade, we’ve transitioned from an era of zero-interest rates, to unprecedented easing during COVID, to aggressive rate hikes in 2022 in response to rising inflation.
To understand Bitcoin’s sensitivity to changes in monetary policy, we segment its history into 5 key interest rate regimes. These take into account the direction and level of interest-rates, ranging from accommodative (Federal Funds Rate < 2%) to restrictive (Federal Funds Rate > 2%). To account for the relatively infrequent changes in interest rates, we compare Bitcoin’s monthly returns to monthly changes in the Fed funds rate.
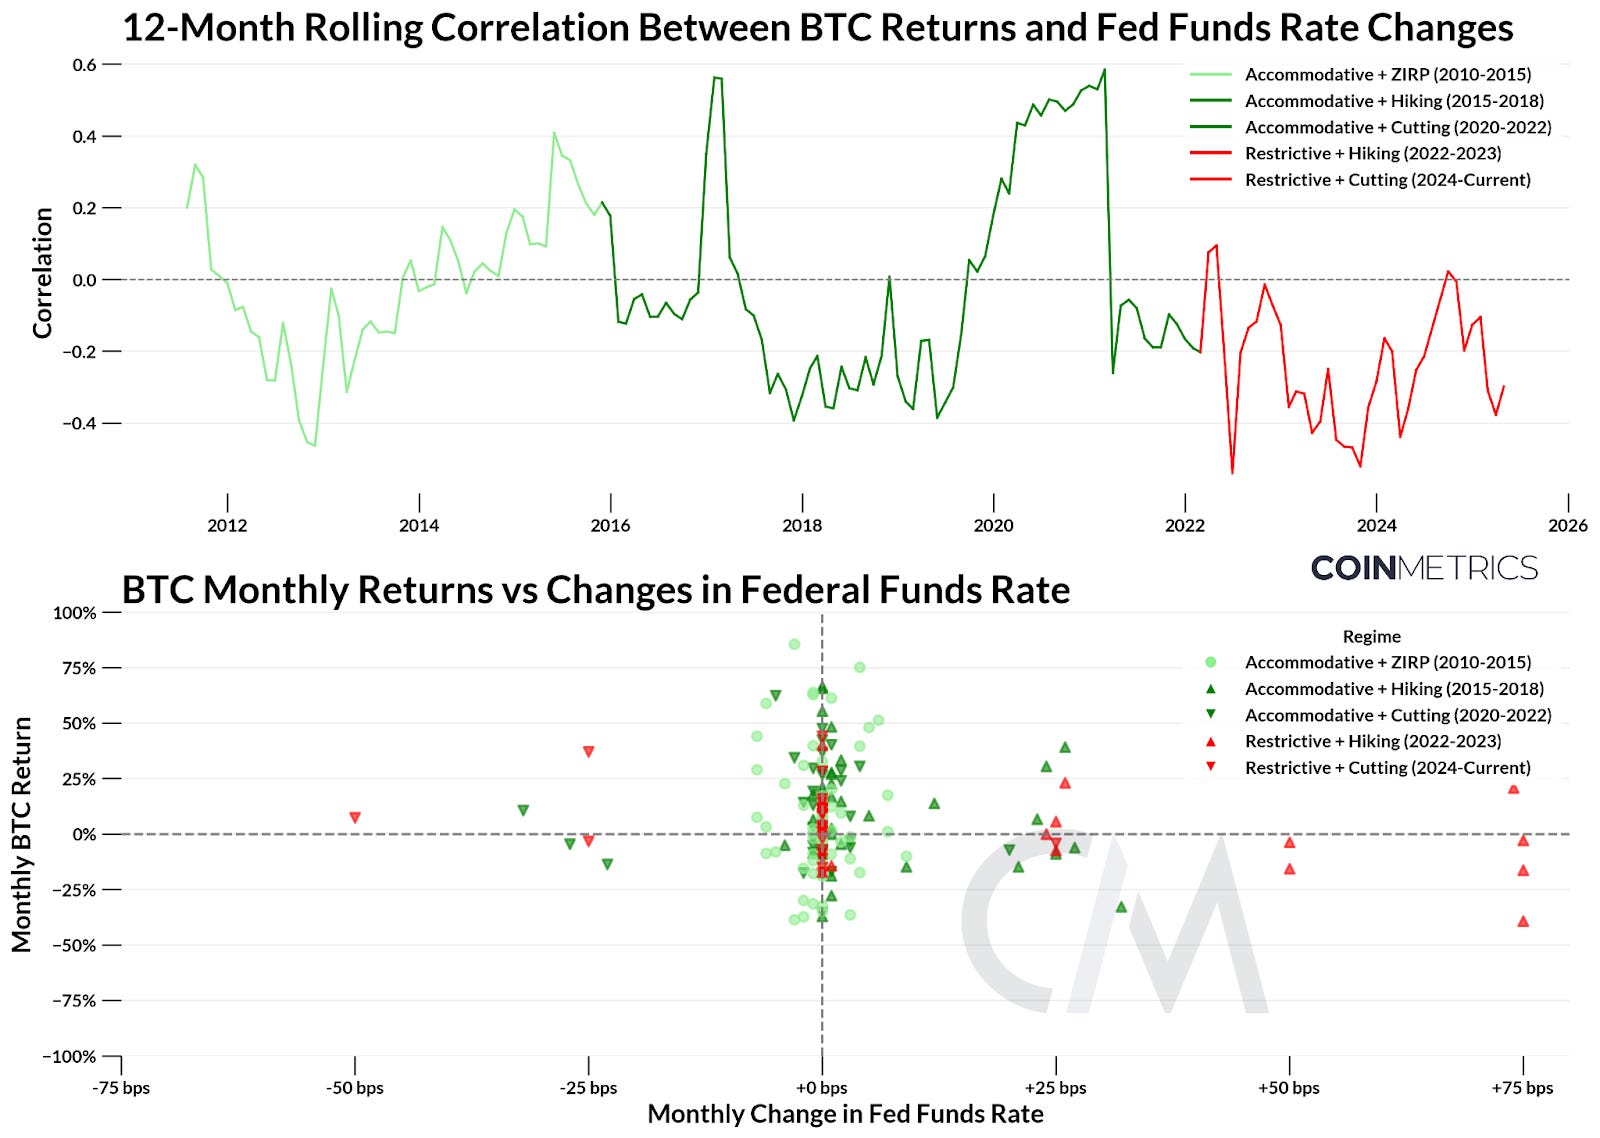
Source: Coin Metrics Reference Rates & Federal Reserve Bank of New York
While Bitcoin’s correlation with interest-rate changes is generally low and clustered around the center, distinct patterns emerge especially during shifts in policy regimes:
Accommodative + Zero Interest Rate Policy (2010-2015): Driven by zero interest rates after the 2008 financial crisis, this period saw some of Bitcoin’s highest returns. Correlation with interest rates was broadly neutral and coincided with Bitcoin’s early stage growth.
Accommodative + Hiking (2015-2018): As the Federal Reserve started raising interest-rates towards 2%, bitcoin returns were volatile to the upside and downside. While correlations spiked in 2017, they generally remained low, suggesting a disconnect from macro policy.
Accommodative + Cutting (2018-2022): A period of aggressive rate cuts and fiscal stimulus began in response to the COVID-19 pandemic, followed by 2 years of near-zero interest-rates. Bitcoin’s returns were highly variable, but skewed positive. This period saw major swings in correlation, going from below -0.3 in 2019 to +0.59 in 2021, before settling back near neutral.
Restrictive + Hiking (2022-2023): To combat surging inflation, the Federal Reserve executed one of its fastest rate hiking cycles, pushing the federal funds rate above 5%. This regime showed the strongest negative correlation between BTC and rate changes. Bitcoin’s performance weakened under tighter financial conditions and risk-off sentiment, compounded by crypto-specific shocks like the collapse of FTX in November 2022.
Restrictive + Cutting (2023-Current): With three rate cuts from elevated levels completed, we’ve seen neutral to modestly positive BTC performance. This period also saw catalysts like the U.S. presidential elections and shocks like the trade war, which continue to influence its behavior. Correlation remains negative, but appears to edge closer towards 0, suggesting a transitional phase as macro conditions begin to ease.
While interest rates shape the backdrop, comparing Bitcoin’s relationship with equities and gold can help reveal its relative behavior to major asset classes.
How Bitcoin Returns Move with Gold and Equities
Correlations
The most straightforward way to answer if an asset’s decoupled from another is to look at the correlation of returns. Below is a plot of Bitcoin’s 90-day correlation between the S&P 500 and gold.
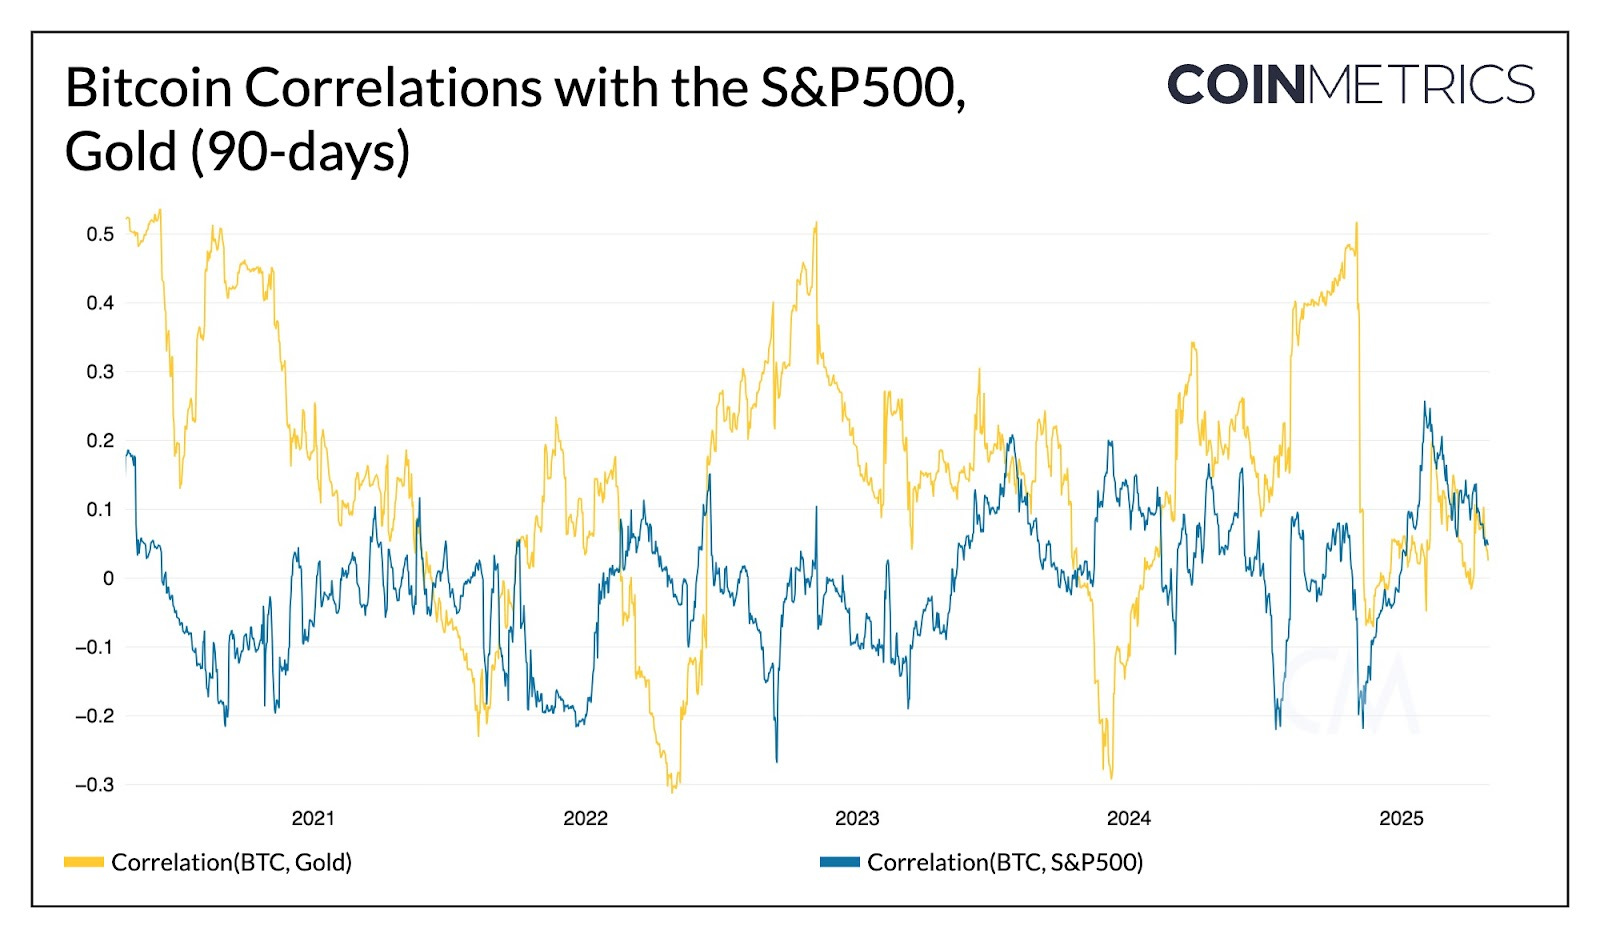
Source: Coin Metrics Charting Tool
Indeed, we do see historically low correlations for Bitcoin across both gold and stocks. Typically, Bitcoin returns fluctuate between being more correlated with gold or equities, with correlations to gold generally showing a greater magnitude. Notably, Bitcoin’s correlation with the S&P 500 had risen into 2025 as market sentiment was boosted across the board. But starting around February 2025, both correlations against gold and equities have trended toward zero, suggesting that Bitcoin is in a unique phase of ‘dethroupling’ against both gold and stocks. This hasn’t happened since late 2021 during the peak of the previous cycle.
What tends to happen when correlations are this low? We compiled the time periods where Bitcoin’s rolling 90-day correlations between the S&P500 and Gold were below a notable threshold (~0.15) and annotated the most noteworthy events at the time.
Low Correlation Periods Between Bitcoin and S&P500

Low Correlation Periods Between Bitcoin and Gold
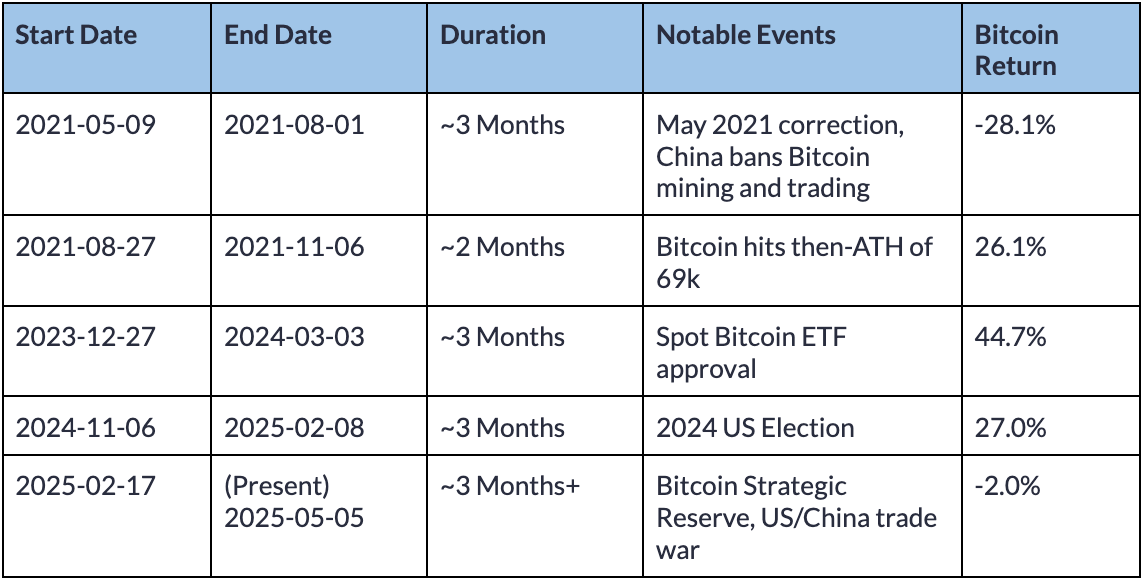
Unsurprisingly, past decouplings happened during periods surrounding major idiosyncratic shocks in the crypto market such as the China ban on Bitcoin and spot Bitcoin ETF approval. Historically, low correlation periods tend to last on the order of 2-3 months, though it depends on the threshold of your correlations.
These periods do coincide with moderately positive returns, but given that each of these periods are unique in their own way, it’s wise to reflect on what makes these periods unique before drawing any conclusions to how Bitcoin may perform in the near future. Having said that, Bitcoin’s low correlation against other assets of late is a desirable property to have for an asset looking to have a major allocation into risk-diversified portfolios.
Market Beta
In addition to correlation, market beta is another useful metric for measuring the relationship between an asset’s and a market’s return. Market beta quantifies how much an asset’s returns are expected to move with a market asset, calculated as the sensitivity of an asset’s returns minus the risk-free rate relative to some benchmark. While correlations measure the direction and strength of the linear relationship between an asset and a benchmark’s returns, market beta measures the direction and magnitude of an asset’s sensitivity to market movements, scaled by the market’s volatility.
For example, it’s often colloquially said that Bitcoin trades at a “high beta” against the stock market. Concretely, an asset (e.g. Bitcoin) which has a market beta of 1.5 is expected to have its returns increase by 1.5% when there is a 1% change in a market benchmark asset (S&P500). A negative beta means that the asset’s returns are negative with respect to a positive change for the benchmark asset.
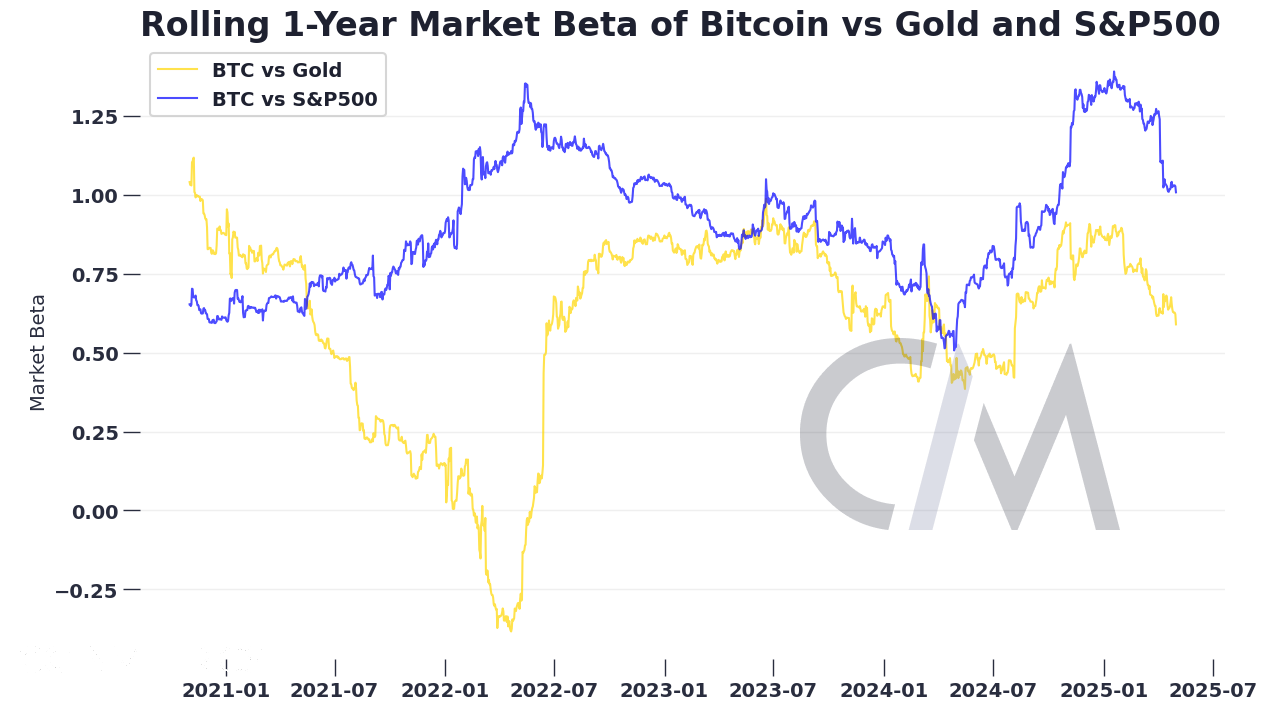
For much of 2024, Bitcoin had a beta of well above 1 against the S&P500, meaning it’s been highly sensitive to movements in the stock market. In bullish, risk-on environments, investors with some exposure to Bitcoin have been rewarded with higher upside compared to just holding the S&P500. Although Bitcoin is oft-labeled “digital gold”, its low beta against analog gold suggests holding both hedges against the downside risks of each respective asset.
As we get deeper into 2025, Bitcoin has started to trade at a lower beta to both the S&P500 and gold. Bitcoin is still sensitive to market risks and its returns are still tethered to market returns, albeit getting less dependent on those assets. Bitcoin may be emerging as a distinct asset class, but it still trades much like a risk-on asset and there isn’t strong evidence that it’s become a ‘safe-haven’ asset just yet.
Bitcoin Performance In Times of High Volatility
Realized volatility adds another dimension to understanding Bitcoin’s risk profile, measuring how widely BTC’s price has fluctuated over a period of time. Volatility is often cited as one of Bitcoin’s core characteristics, both as a driver of risk and source of returns. The chart below compares the 180-day rolling realized volatility for Bitcoin to major indices like the Nasdaq, S&P 500 and a few technology stocks.
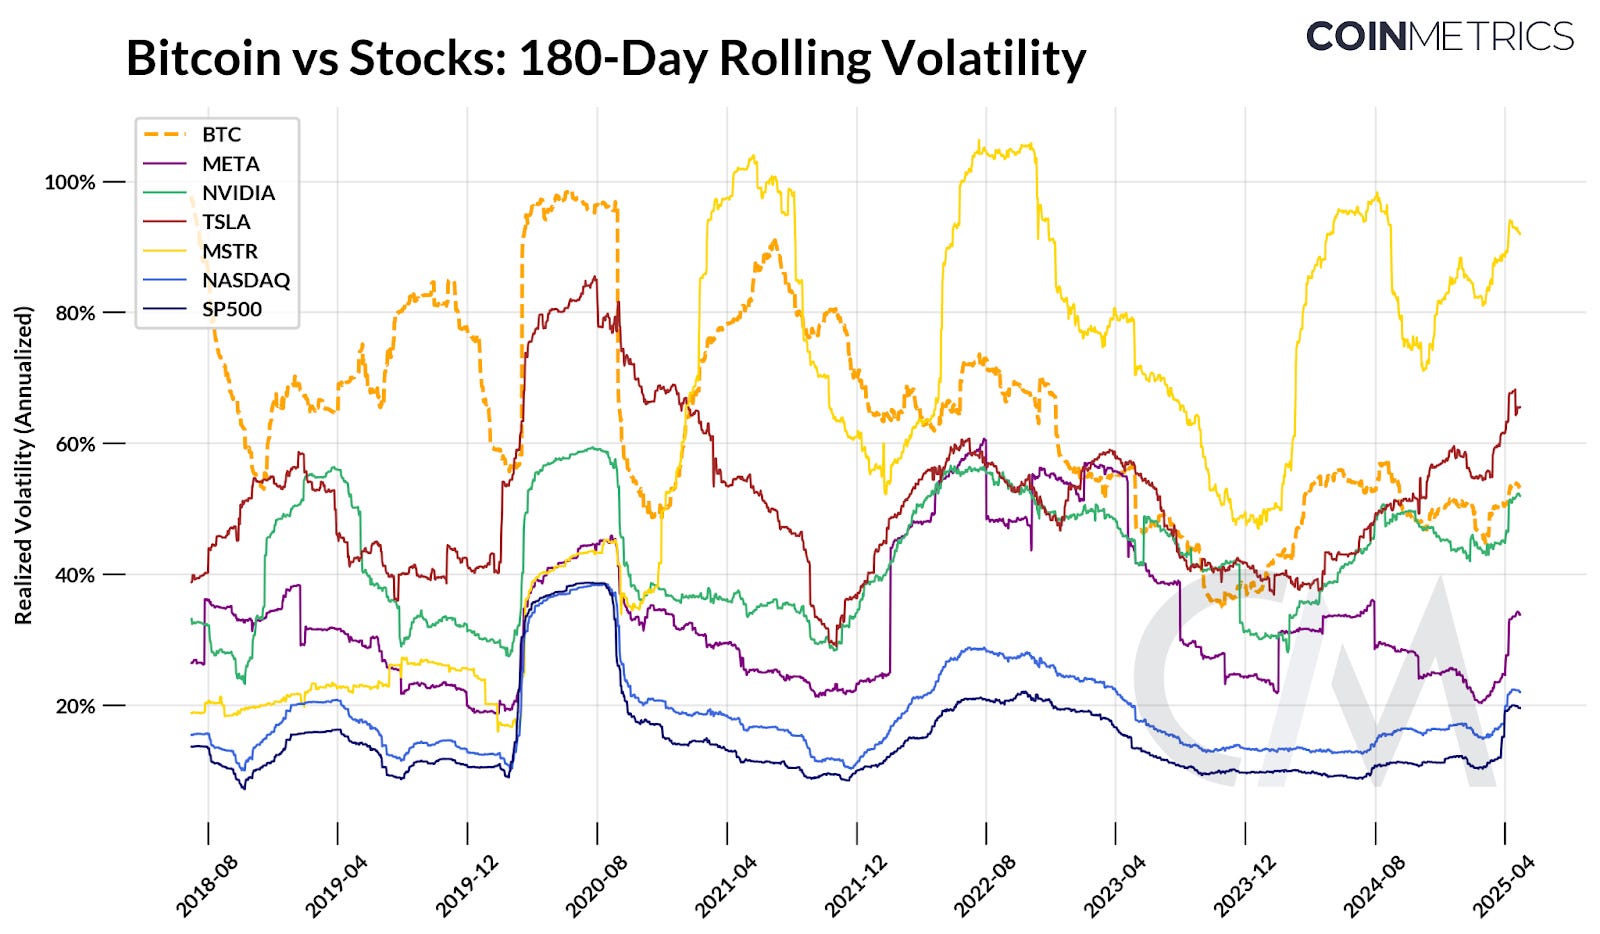
Source: Coin Metrics Reference Rates & Google Finance, Based on Coin Metrics’ Realized Volatility Methodology
Bitcoin’s volatility has trended down over time. During its early phases, it regularly exceeded 80-100% in realized volatility driven by explosive cycles of appreciation and correction. Volatility rose in tandem with equities during COVID, and also in isolation during periods of 2021 and 2022, influenced by crypto-specific shocks like Terra Luna and FTX’s collapse.
However, its 180-day realized volatility has gradually declined since 2021, recently stabilizing around 50-60% even in the face of elevated market volatility. This brings it in line with many popularly held technology stocks, below MSTR and TSLA, while closely aligning with NVIDIA.While still prone to short-term market volatility, its relative stability compared to past cycles may be a reflection of its maturity as an asset and evolving ownership base.
Conclusion
Has Bitcoin decoupled from the rest of the market? It depends on how you measure it. Bitcoin is not completely insulated from the real world. It’s still beholden to market forces that affect all assets: interest rates, idiosyncratic market events, and yes, the returns of other financial assets. Of late, we have seen Bitcoin returns become uncorrelated with the rest of the market, but it remains to be seen whether this is a temporary trend or part of a longer term market regime. As with all trends: it is, until it isn’t.
Whether Bitcoin has decoupled or not feeds into a larger question: What role does it play in an investment portfolio seeking to diversify its risk against the rest of the market? Bitcoin’s risk and return profile can lead the investor to a narrative vertigo where one week it’s a highly levered NASDAQ, another it’s digital gold, and another it’s a hedge against the fiat debasement. But perhaps this volatility is a feature and not a bug. Rather than making imperfect analogues to other assets, it would be more constructive to understand why Bitcoin moves in its own direction as it continues to mature into a distinct asset class.
Coin Metrics Updates
We are excited to announce the release of options volume and open interest metrics across assets, exchanges, exchange-assets and pairs.
Follow Coin Metrics’ State of the Market newsletter which contextualizes the week’s crypto market movements with concise commentary, rich visuals, and timely data.
As always, if you have any feedback or requests please let us know here.
Subscribe and Past Issues
Coin Metrics’ State of the Network, is an unbiased, weekly view of the crypto market informed by our own network (on-chain) and market data.
If you'd like to get State of the Network in your inbox, please subscribe here. You can see previous issues of State of the Network here.


