

Author: Robert Osborne
Translated by: TechFlow
Overview
In the first quarter of 2025, Web3 financing remained stable, with a total of $7.7 billion raised, almost on par with the record-breaking fourth quarter of 2024 ($7.9 billion). However, the number of transactions decreased by 34%, reaching the lowest level since the third quarter of 2023.
Binance's single financing round of $2 billion accounted for more than a quarter of the total capital this quarter. Excluding this financing, the actual market activity was around $5.7 billion, basically consistent with the average level in 2024.
Strategic financing rounds dominate the market, with 102 transactions attracting $2.5 billion in funding, continuing the trend of sovereign funds and ecosystem funds supporting large infrastructure and Layer 1 projects.
Early-stage financing shows divergence: Seed round financing dropped to a two-year low ($4.4 million), while Pre-seed round financing remained strong ($2.9 million). A-round financing continues to be squeezed, with only 27 transactions completed, but the average financing amount per round increased to $15.6 million.
The category landscape reveals a mix of dispersion and focus. The Networks category leads the way (thanks to Binance's push), while Data, Wallets, and Consumer Infrastructure show higher median financing amounts. Developer Tooling attracted the most investor participation but with smaller financing rounds, indicating it remains the "long tail" of the infrastructure sector.
Token financing rebounds strongly: 96 public and private sales raised $1.6 billion, the strongest quarter since 2022. World Liberty ($590 million) and TON ($400 million) stand out as landmark cases.
Market Overview: Capital Concentration Prioritized over Transaction Numbers
[The rest of the translation follows the same approach, maintaining the original structure and translating all text except for content within <> tags.]Chart 3: Median Financing Changes for Pre-seed, Seed, and Series A Stages from Q1 2021 to Q1 2025
Source: Outlier Ventures, Messari
The median financing for pre-seed rounds reached $2.9 million, almost reaching the peak of Q1 2024 and close to three times the 2021 average. This marks a quiet resurgence of confidence in the earliest stages. Accelerators, ecosystem funds, and angel investment alliances seem to still favor early investments with optionality, especially those based on high-conviction narratives such as decentralized physical infrastructure networks (DePIN), native AI infrastructure, and onchain agent tooling. For founders, this remains the most capital-friendly stage.
However, seed rounds have been hit hard. The median financing dropped to $4.4 million, down from over $5.8 million in the previous quarter, reaching its lowest level since Q4 2022. This is a strong signal that the middle stage is shrinking. Investors are reducing check sizes, tightening terms, or directly bypassing this stage unless the project has clear key metrics or distribution capabilities. The "spray-and-scale" model is clearly no longer in existence.
Series A financing saw a slight rebound, with the median reaching $15.6 million, higher than the previous quarter's cyclical low point ($13.2 million). Nevertheless, this is still far below the peaks of 2021 and early 2022, when medians often exceeded $30 million. More importantly, the number of deals at this stage was extremely low (only 27), highlighting the market's selectivity. These Series A financings are not mere formalities - they are priced more like mini-B rounds, suitable only for companies that already have revenue, market traction, and an executable token strategy.
In short, the "barbell effect" persists: capital continues to flow into the ideation and market traction stages, while the middle stage is abandoned. This is not a financing winter, but a reshaping and balancing of founder expectations.
Capital Flow: Category Highlights
From a category perspective, Q1 2025 continues to highlight the diversification of capital deployment and the differentiation of investor enthusiasm.
As expected, Networks topped the list, with a median financing of $45.1 million, significantly influenced by Binance's $2 billion strategic financing. Even without this outlier, the 243 investment transactions in this category demonstrate high institutional allocator, strategic fund, and ecosystem supporter interest in Layer 1 public chains and scalability projects. Network infrastructure remains the "stronghold" of capital flow, an area where investors want to demonstrate serious intent.
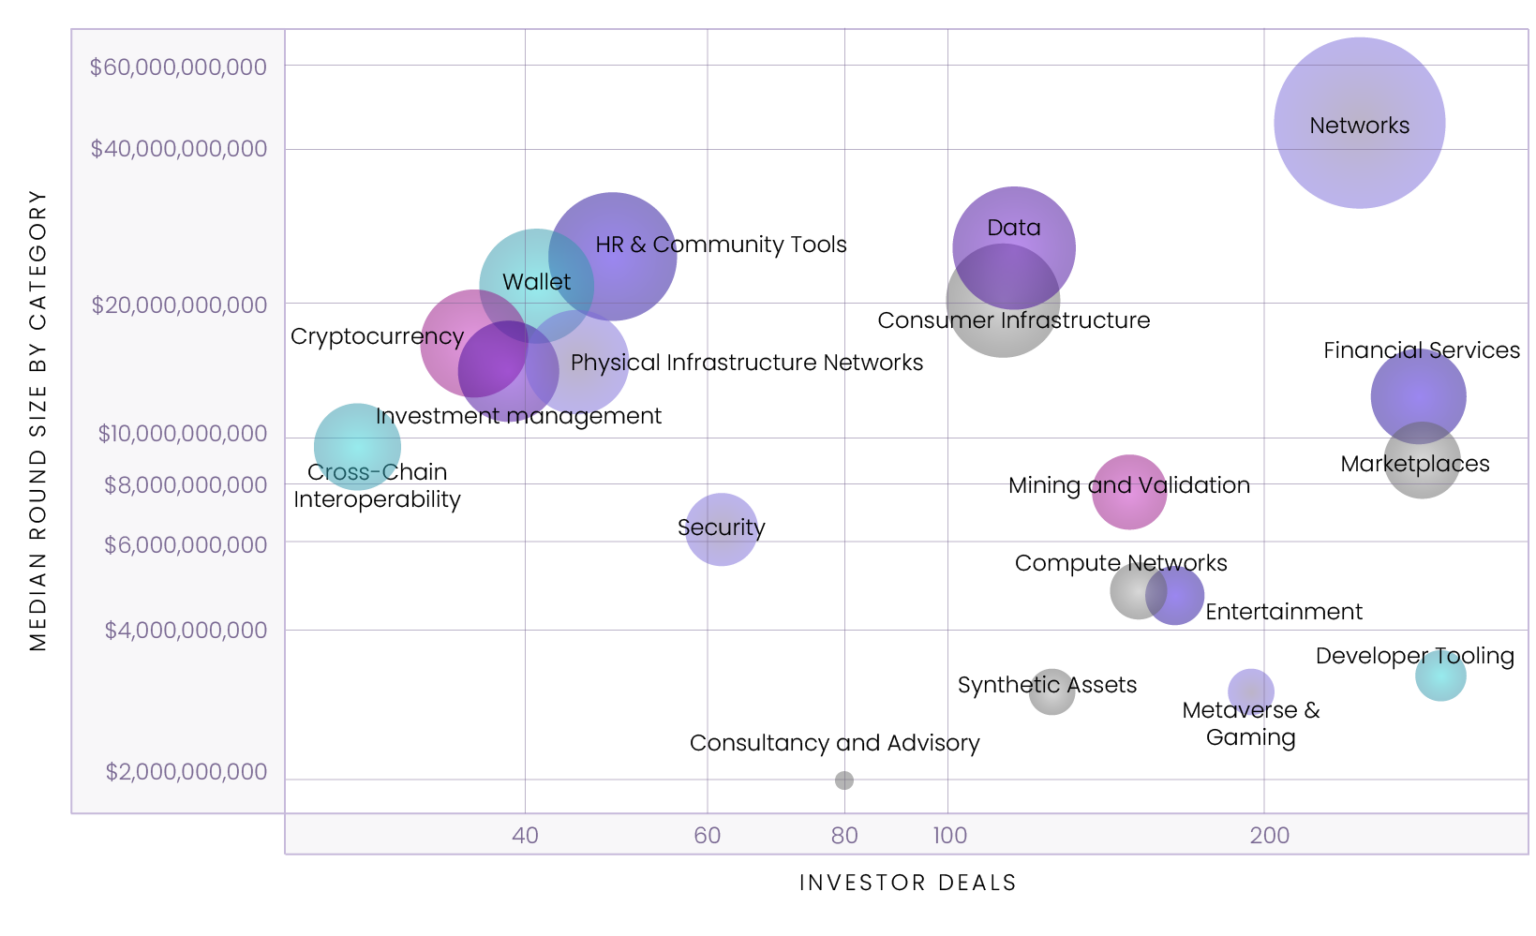
Chart 4: Average Financing Stage and Round Size by Category in Q1 2025
Source: Outlier Ventures, Messari
Note: "Investor Transactions" refers to the total number of investor participations within a category, not the number of unique investors. If one investor participates in three financings, this will be counted as three investor transactions.
Developer Tooling attracted the most investor participation, with 290 investor transactions, but its median financing was only $3.1 million. This contrast highlights the role of developer tools as infrastructure's "long tail": high interest, low risk, and modular potential. These are typically smaller, faster transactions - engineer-led, protocol-aligned, and sometimes subsidized.
On the consumer side, Metaverse and Gaming recorded 193 investor transactions with a median financing of only $2.9 million, reflecting a shift from content-intensive investment to "infra-for-fun" investment. The Entertainment sector showed a similar pattern - with a median financing of $4.65 million and 164 investor transactions - again indicating that VCs are still interested in Web3 projects centered on audience, but cautiously.
Marketplaces and Financial Services were also notable for high investor participation, with 279 and 277 investor transactions respectively, but with different capital intensities. The Marketplaces sector's median financing of $9 million shows emerging interest in transaction-type infrastructure and tokenized commerce. The Financial Services sector's median financing of $11.98 million made it one of the highest-funded consumer categories this quarter.
In the infrastructure categories, Consumer Infrastructure ($19.3 million), Wallets ($20.7 million), and Data ($24.3 million) showed higher median financing and moderate investor participation, indicating that despite being less prominent than Networks or Compute, they benefit from returning to fundamentals: user experience (UX), composability, and data liquidity.
At the other end, Consultancy & Advisory and News & Information categories had lower median financing (around $2 million) and fewer investors - these categories struggle to prove venture capital-scale potential and may be squeezed by public goods funding or native monetization models.
The "mid-weight" highlights this quarter - Cross-Chain Interoperability ($9.7 million), Security ($6.4 million), and Compute Networks ($4.8 million) - reflect that technically strong, low-visibility infrastructure layers continue to receive important support. These are no longer frontier areas but have become expected parts of the technology stack.
Token Financing Strongly Rebounds: Strategic Private Placements and Public Sales Move in Tandem
In Q1 2025, token financing showed a clear reversal of 2024 trends, with high-value, high-risk private sales making a strong comeback, while large-scale public sales also resurged.
This quarter saw 69 public token sales, raising a total of $798 million, with World Liberty Financial leading at $590 million, accounting for nearly 74% of the quarter's public token financing. Simultaneously, private token sales raised $771 million through just 27 transactions, with the TON Foundation's $400 million financing at the forefront. Overall, token financing for the first quarter reached $1.6 billion, far exceeding any quarter in 2024.
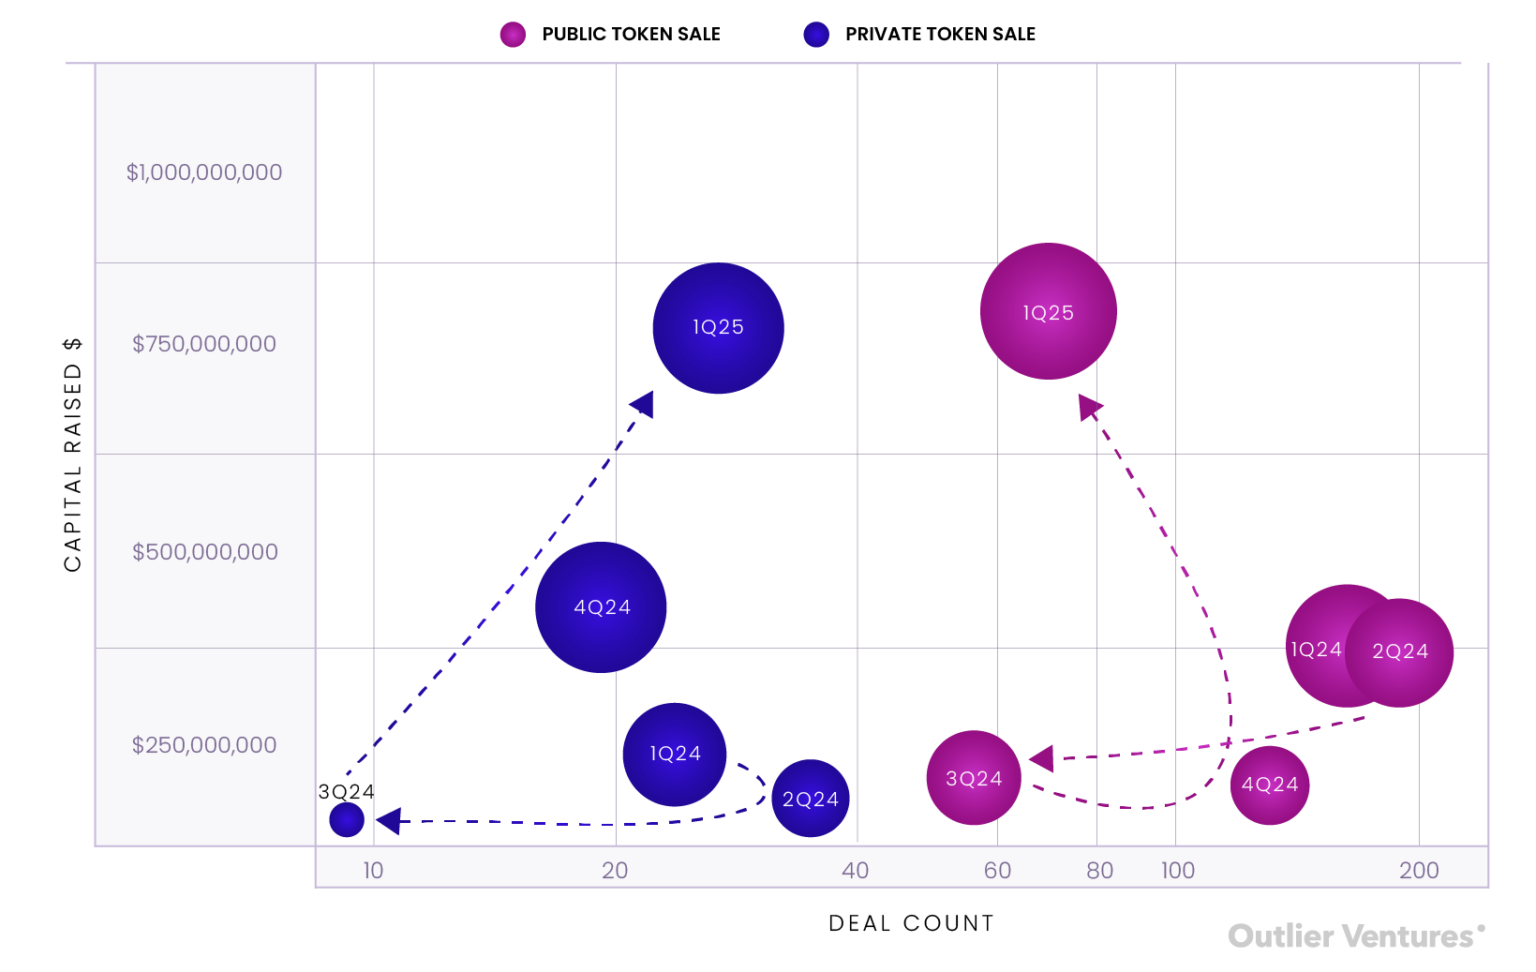
Chart 5: Comparison of Private and Public Token Sales by Fundraising Amount and Transaction Count from 2022 to 2024
Source: Outlier Ventures, Messari
In comparison to last year: In Q1 2024, public sales far outnumbered private sales in transaction count (163 vs. 24), but with lower overall fundraising ($296 million vs. $140 million). The market then favored liquidity issuance, retail participation, and community-driven tokenomics. Q1 2025, however, shows the other end of the market pendulum: centralized, institution-led token allocation is back in force - a signal of rising market confidence and a reflection of preferences for control, lock-up mechanisms, and over-the-counter pricing.
Most notably, it's not just absolute growth, but structural change: public sales now account for less than 60% of total token financing transactions but have only slightly raised more funds than private sales, despite having more than double the transaction count. This per-transaction capital difference reveals market transformation.
Private token transactions have become popular again, larger in scale, deeper, and more strategic. These are no longer ordinary initial DEX offerings (IDOs) or quick hype machines, but important ecosystem positioning - closely integrated with Layer 1 treasuries, foundation missions, or cross-border capital flows.
Meanwhile, public offerings seem top-heavy. Excluding World Liberty's financing, the average financing amount for the remaining 68 public rounds is only $3 million - indicating that despite expanding market access, large-scale retail demand remains concentrated in a few high-trust, high-brand projects.
Summary Reflection: Navigating a Fragmented Market
The first quarter of 2025 validated many industry insiders' feelings: this is not a bear market, but a more focused market. Capital has not disappeared, but has become more selective, more strategic, and more inclined to support infrastructure construction, actual results, and long-term narratives.
This quarter also marked the return of a healthy dual-track dynamic: private rounds used for strategic control, while public rounds build market image and liquidity framework. This is the first time in over a year that both private and public rounds have simultaneously flourished.
For founders, the future path is now clear: you don't need to "time the market," you need to build things that will "inevitably be realized".


