
Get the best data-driven crypto insights and analysis every week:
Evaluating Precog Subnet 55 Forecast Performance via Simulated Trading
By: Uriel Morone
Key Takeaways:
The Precog subnet has been running successfully on Bittensor for over two months. With the initial data pipeline in place, we can begin analyzing the relationship between its forecasts and market performance.
We simulate two types of trade scenarios: Access to finite capital to trade, and access to unlimited positive and negative liquidity. In both cases we observed positive returns in the trade simulation
Across multiple different time periods, during periods of price rises and falls, a basic strategy determined by the subnet forecasts repeatedly shows positive return over holding the asset.
Trading simulation also tends to show lower draw-down than a simple buy-and-hold approach.
Strategy used was as naive as possible, demonstrating positive value comes from the information contained in the subnet forecasts
Current analysis only depends on Point Forecast, we are developing a similar analysis using the Interval Forecast to scale the size of the trades according to confidence.
Introduction
In February, we introduced the Precog Subnet, Coin Metrics’ first venture into the Bittensor ecosystem, designed to harness collective anonymized intelligence to generate a new category of market data. Our design focused on price forecasts for Bitcoin, the historical data for which we are a first in class provider. By aggregating these forecasts, the Precog subnet produces a forward looking signal that incorporates the latest industry news, market sentiment, and advanced analytics developed by participants themselves.
The Bittensor architecture eliminates the need to judge miner motivations; the results and rewards speak for themselves. Precog was designed with these principles:
Focus on problems Bittensor is uniquely suited to solve
Produce actionable and human-readable output
Opt for simplicity in mechanisms
This simplicity reduces unintended consequences and encourages participant understanding. The result was a subnet that asks miners for two things: the Bitcoin price one hour from the request time, and minimum to maximum range of the price over the ensuing hour. The former is called the Point Forecast and the latter is referred to as the Interval Forecast.
The key question is: "Can I make money trading with this?" This article evaluates the Point Forecast, with future analyses planned for the Interval Forecast
We recently published a research report exploring exactly these questions, with some satisfying conclusions regarding the value of our Subnet outputs. Since then, as of this writing, the amount of TAO token staked in our Subnet has more than tripled. In this issue of Coin Metrics’ State of the Network, we share major parts of the paper, and repeat portions of the analysis using updated data.
Motivation & Methodology
Our goal in this investigation was to determine whether there is profitable information contained in the Precog Subnet's forecasts. To answer this, we simulated a trading strategy that decided whether to "buy" or "sell" Bitcoin by comparing the predicted future price to the latest observed price at each time point.
There are many ways to aggregate a forecast and fine-tune a trading strategy, but our intention was the opposite: to use the simplest possible approach to show that the inputs alone contain signal. The strategy uses no history or external data, only the subnet’s point forecast and the Bitcoin price to make a binary decision to buy or sell $1 worth of BTC.
Procedure
To obtain a single "Forecast" for one hour in the future, at a given prediction time point, we average responses from the top 20 miners, determined by the largest rewards from the previous evaluation. In other words the most recent top 20 performing miners.
The trading strategy follows a very simple algorithm:
Assume there are both USD and BTC wallet balances. These can be positive and negative.
At each prediction time if the predicted price is greater than the current Bitcoin price then "buy": reduce the USD balance by $1.00 USD and increase the BTC balance by $1.00/[BTC Price] BTC.
If the prediction is less than the latest observed price, do the opposite: increase USD balance by 1.00 and reduce BTC balance (i.e. sell) an equivalent amount.
Repeat this process every 5 minutes, at each prediction time.
An important design decision was whether to simulate finite or unlimited capital. In the former case, buying would stop if the USD-balance reached 0, introducing another subjective parameter (ie., initial balances). So, for the first sections that follow, we instead allow for negative balances and initialize both wallets at $0.00, treating performance as the difference from any initial capital. Later, we explore the case of a finite bankroll and compare it to holding an equivalent amount of BTC.
A “negative” balance is interpreted debt, which in principle needs to be repaid, but allows one to short or sell an arbitrary amount of one asset. If the debt's value is lower than the credit of the other asset, the portfolio has made money. The strategy's performance is evaluated in a straightforward way: When the net USD-value of both the USD balance and BTC balance is positive, this is considered good.
There are several technical caveats to keep in mind when interpreting the results, not least the fact that only about a month of price history is shown. We discuss these in more detail in the paper linked above, but will skip them here for space considerations.
Performance
24-day Performance
The first evaluation is overall performance over the longest available time frame. Although 24-days is not an extraordinarily long time, it is the longest period we felt was reliable at publication. In Figure 1, we see that the strategy results in a net positive return for almost the entire period. This is true despite the fact that the Bitcoin price (in orange, right axis) returns to its initial price and remains below it for significant periods of time.
When the Bitcoin price drops, the trading strategy sees a modest decrease in worth. But when the price rises, the strategy captures proportionally more gains. Note that this works with the very basic trading algorithm as described above, which does not include any adjustment to the size of trade, the magnitude of the prediction, or the history of the price time series.
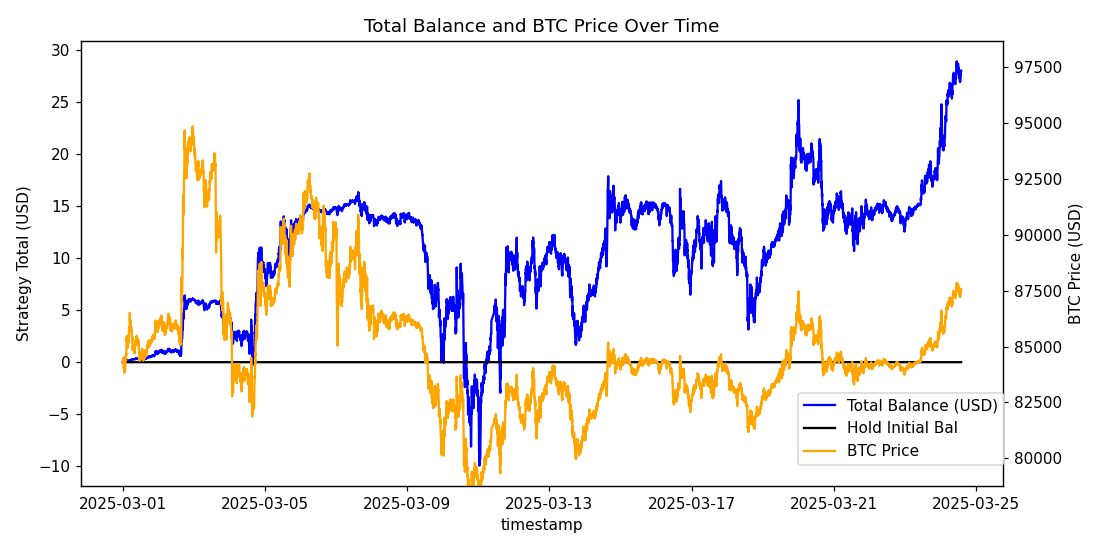
Figure 1
The plot in Fig 2 shows the relative value of USD vs BTC balance held by the portfolio (both in units of USD). In the first nine days or so, the Precog Forecasts led the strategy to buy BTC as the price rose, and sell as it fell. However, the forecasts were timely enough that our strategy locked in some gains by 03-06 before the price reached its lowest point. Then, a period of acquisition begins and with the exception of a few brief periods, continues unabated.
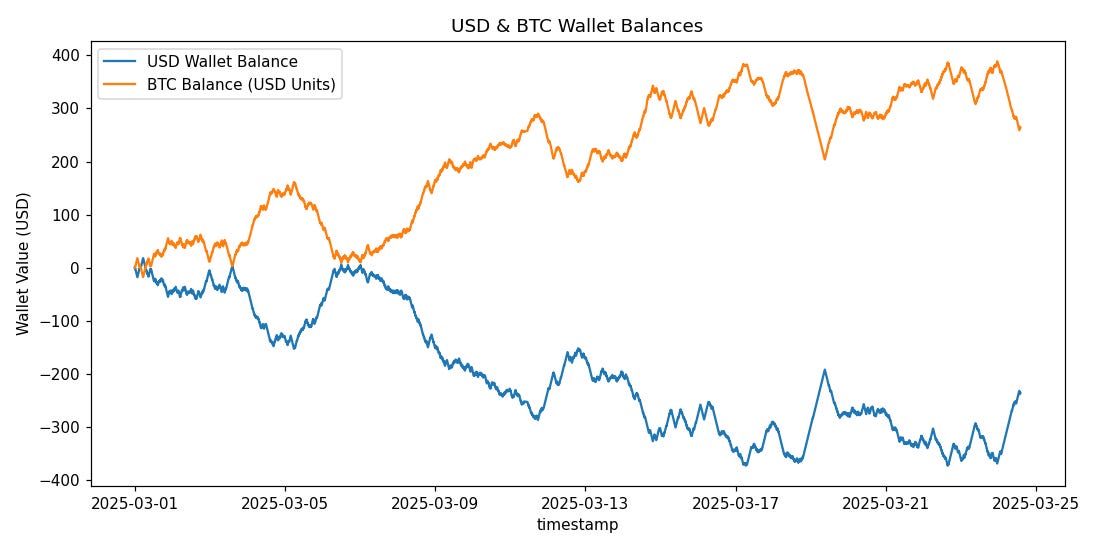
Figure 2
The net effect is that this simplistic approach, when guided by the Precog Forecasts accumulates BTC while the price rises and locks in gains before it falls. This in turn means the portfolio values appear to jump substantially when the price goes up and drop modestly when the price goes down.
Money in a Bear Market!?
Instead of looking at the longest period available, we also considered shorter overlapping windows to see how the strategy performs when initialized across different market regimes. This also controls for the possibility that the longer time frame above had some kind of lucky streak that carried it the rest of the way.
Perhaps the most exciting simulations are periods during which the Bitcoin price decreases, yet the portfolio value is positive. We go through a larger sample set in the paper, but here we’ll limit ourselves to these short-term “bear” markets. The behavior observed implies that the Precog forecasts contain enough intelligence to short Bitcoin during bear markets, and potentially make a profit.
The overall time series looks different in each window, but the fact that the strategy was successful more than once, is encouraging. The four charts in Fig 3 show examples where the strategy performs well despite an overall decrease in price. Typically, we see a muted impact when the price falls and a big recovery when it rises again.
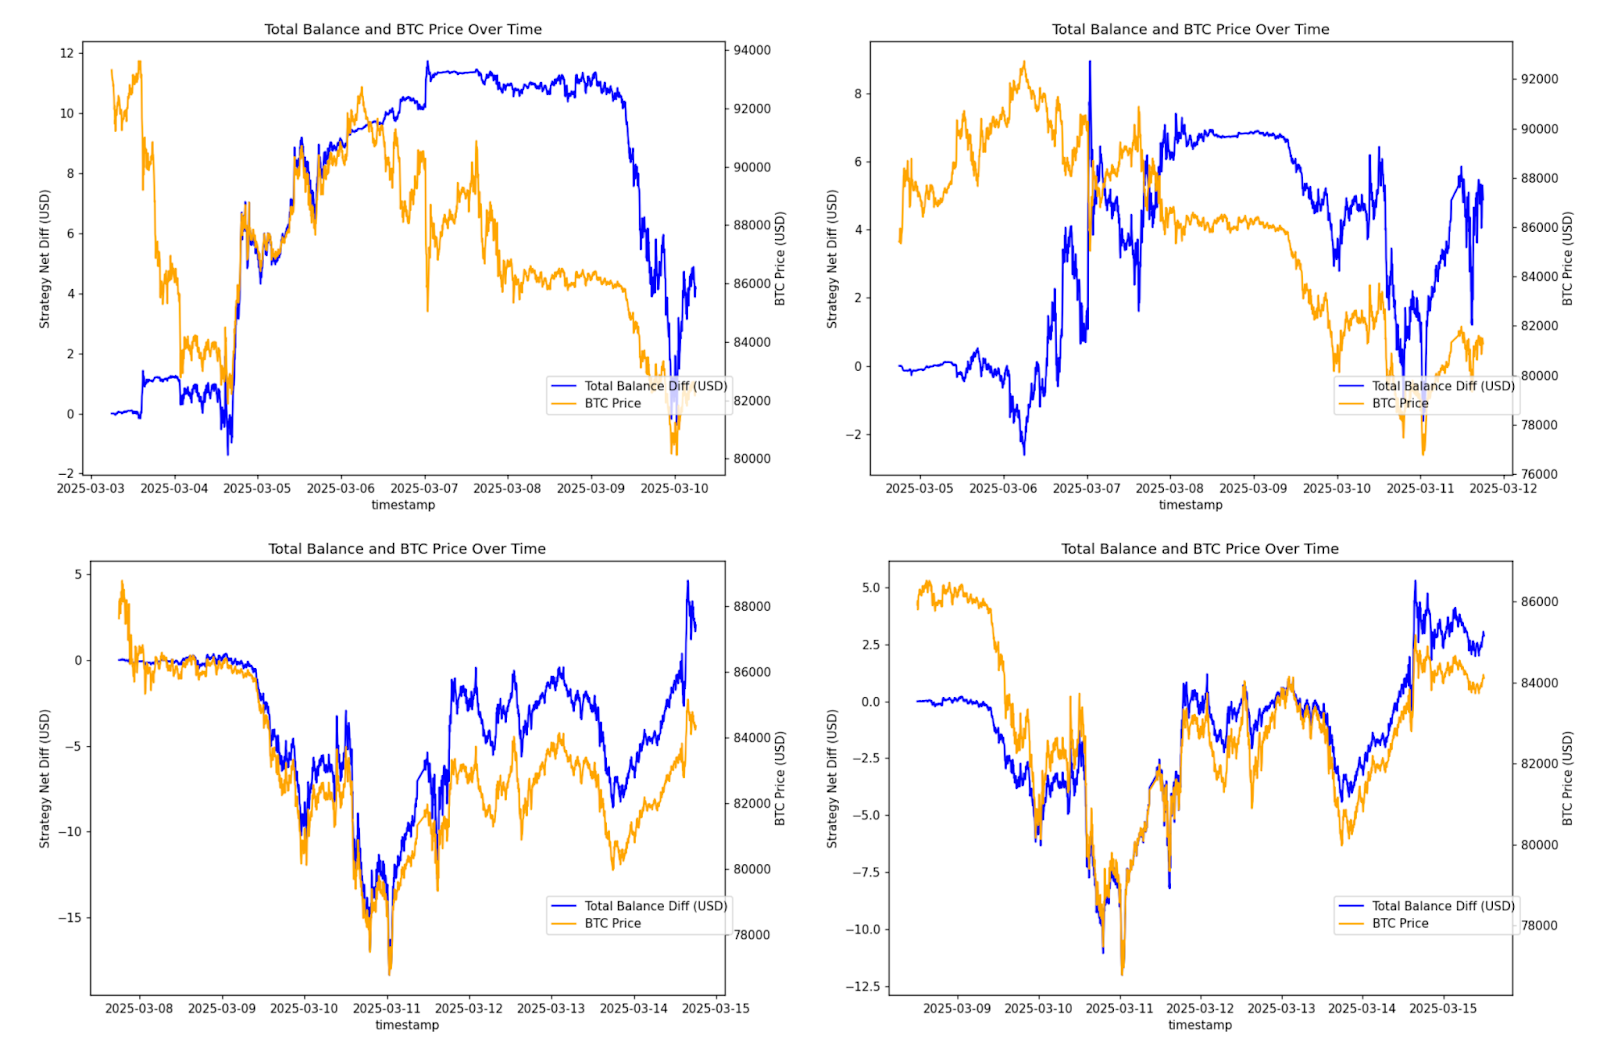
Figure 3
Behind the scenes, the strategy sells or shorts BTC to accumulate USD from 3/05–3/06, rapidly buys BTC between 3/08–3/09, continues accumulating at a moderate pace, then sells again from 3/12–3/13. While the strategy isn’t perfect, the timing is generally effective, selling before major price drops and slowing down purchases before peaks.
Comparing Trading a Bankroll to Buy-and-Hold
We can adjust some of the simulation parameters to compare the performance of our strategy to a simple buy-and-hold approach, or no buy at all in the USD-only case. To replicate a plausible real-world situation, we initialized the portfolio with $1000, entirely in either USD or BTC. If the trading strategy at some point runs out of USD it will no longer be able to buy BTC, and if it has no BTC the strategy cannot sell it.
The results are shown in Figure 4. Each plot represents two comparisons across a different time period. The Orange vs Red lines show the performance of holding BTC compared to a trading strategy that is given the same amount of BTC initially. The Black vs Blue lines show the value holding 1000 USD in cash compared to the value of a portfolio that starts with the same USD. The top plot shows a time period during which BTC ends above the initial price, while the bottom shows a time period (shifted 4 days), when BTC ends significantly below its initial price
The most striking thing about this simulation is that in each case a trading strategy based on Precog Forecasts outperforms holding an equivalent amount and type of initial capital. That is, a trading strategy that starts with a balance of 1000 USD results in more than 1000 USD of total value at the end of both periods. At the same time, a trading strategy initialized with a BTC balance worth 1000 USD outperforms simply holding that BTC over both periods.
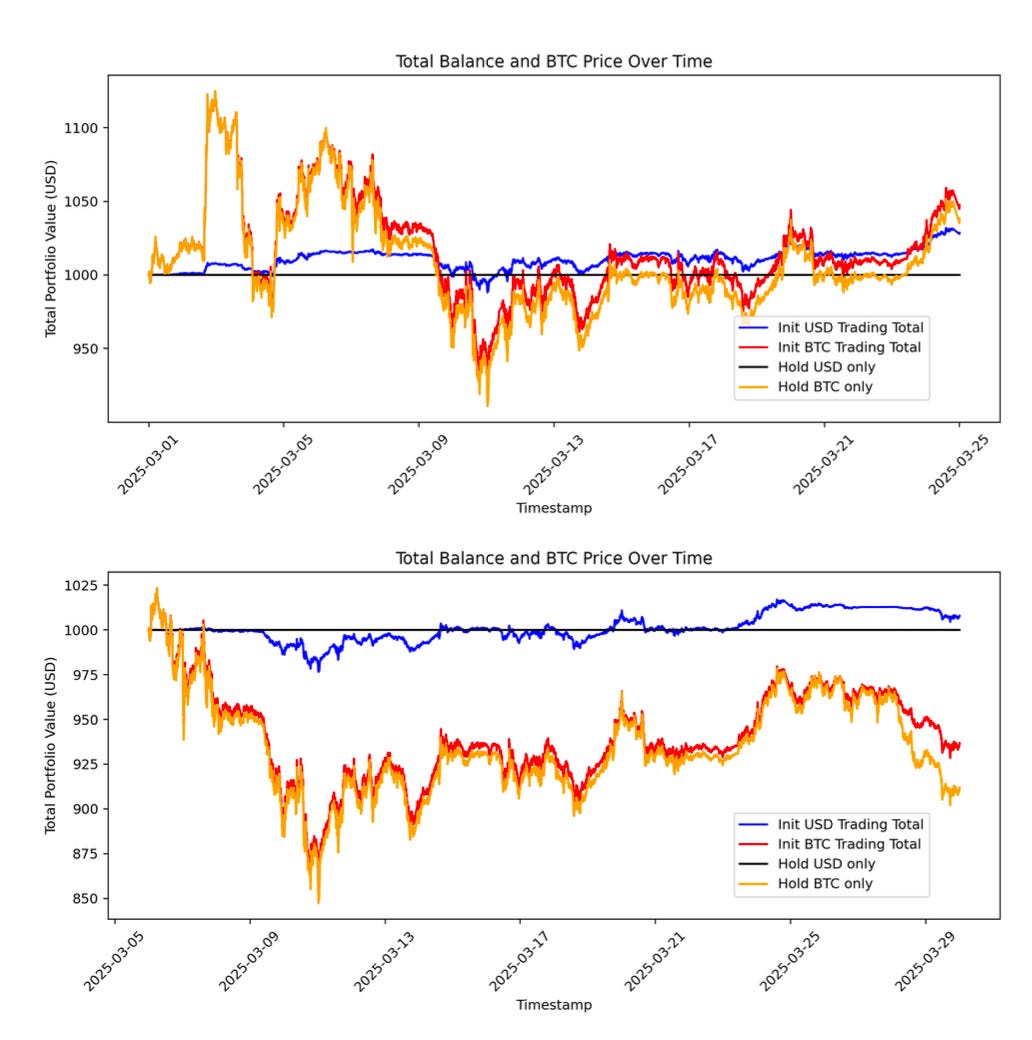
Figure 4
It is worth a moment to emphasize how impressive this is. It would be unsurprising if a trading strategy makes a profit over simply holding the initial 1000 USD, during a period when Bitcoin's price increases from 3/01 to 3/24. However, the fact that the same strategy results in a profit when the Bitcoin price decreases by 10% from 3/06 to 3/30, is nontrivial.
Perhaps most impressive of all is that the same strategy, given an initial balance of pure BTC, not only increases returns when the price goes up, but also reduces losses when the prices go down. It would make sense if our trades increased volatility and required accepting lower dips for greater returns. However this is not the case. In fact, we see in Table 1 that trading actually reduces risk slightly by having a higher minimum portfolio value as compared to a constant 100% BTC allocation. This implies to us that there is true intelligence behind the forecasts, as we are obtaining a "free lunch" in some sense regarding risk and returns.
Table 1
Recent Performance
We hope to add parts of the previous analysis to our subnet dashboard (precog.coinmetrics.io) soon. Continuing to model this experiment will give us a greater understanding of how our miners collectively perform, and interpret results in a different period. Notably, the last few weeks have seen some of the largest macroeconomic headwinds in recent history. Bitcoin itself has seen its fair share of volatility, so below we re-run a portion of the analysis to see how our strategy would perform in the challenging environment starting April 1st. These recent conditions show interesting behavior that highlight the importance of looking at performance in different contexts.
Unlimited Liquidity
In a scenario where our trader has unlimited BTC reserves to sell, we see the performance observed in Fig 5. There is a period of several days when our strategy is in the red, the forecasts led us to purchase Bitcoin which lost value over time. However afterwards we start gaining value and don’t really look back. Over a 17-day period we end up $20, which is to say 20x the trade volume we use at each time point.
Overall 3694 / 4830 observed points, or 76% of the window, show a positive result from an initially balanced trading strategy. Remember, in this case we start with a $0 balance in both USD and BTC and always “borrow” one to buy the other. Fig 6 shows the relative balance, we buy BTC until 4/11, when we start selling and eventually end up with a net short position after 4/14.
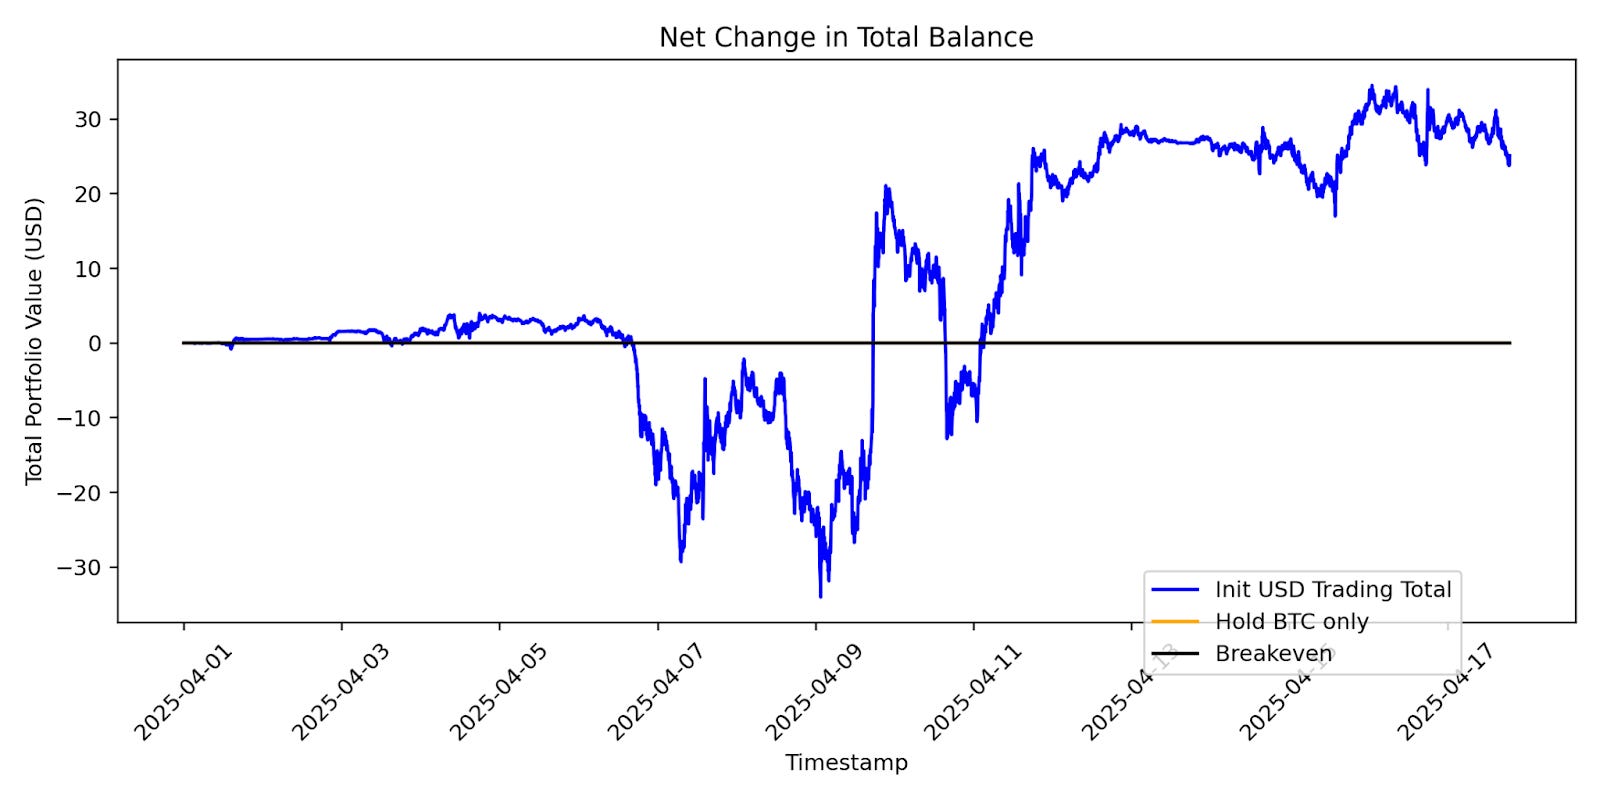
Figure 5
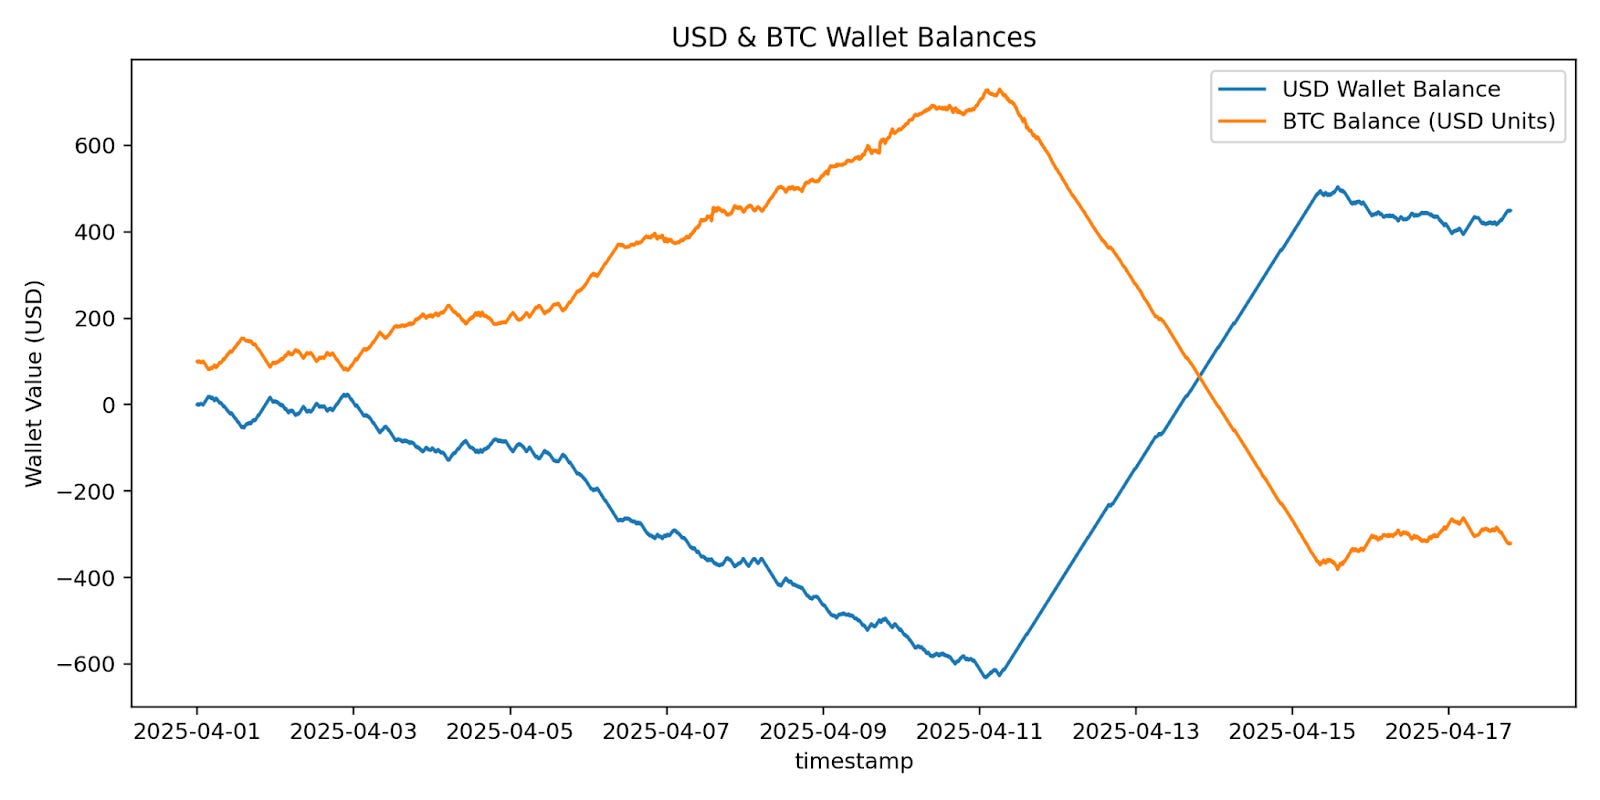
Figure 6
Limited Capital - Start w/ $1000
In order to compare to a concrete baseline, we also consider a scenario where the trader starts with $1000 and is restricted to the assets in their portfolio. In this case, the results look a bit different than the previous month’s. Although both the USD-initialized and BTC-initialized strategies were outperforming a simple BTC hold until around 4/11, a few days later trading strategies flatline in value.
What actually happens is the portfolio sold all its BTC around 4/13 and is left with dollars. Despite the fact that the actual BTC price continues to rise, the miners on our subnet continue to predict an impending drop. They were days of pessimism. On 4/15 we start to occasionally get a buy signal from the forecasts; this results in approximately ~10% BTC allocation so the fluctuations in portfolio balance remain small.
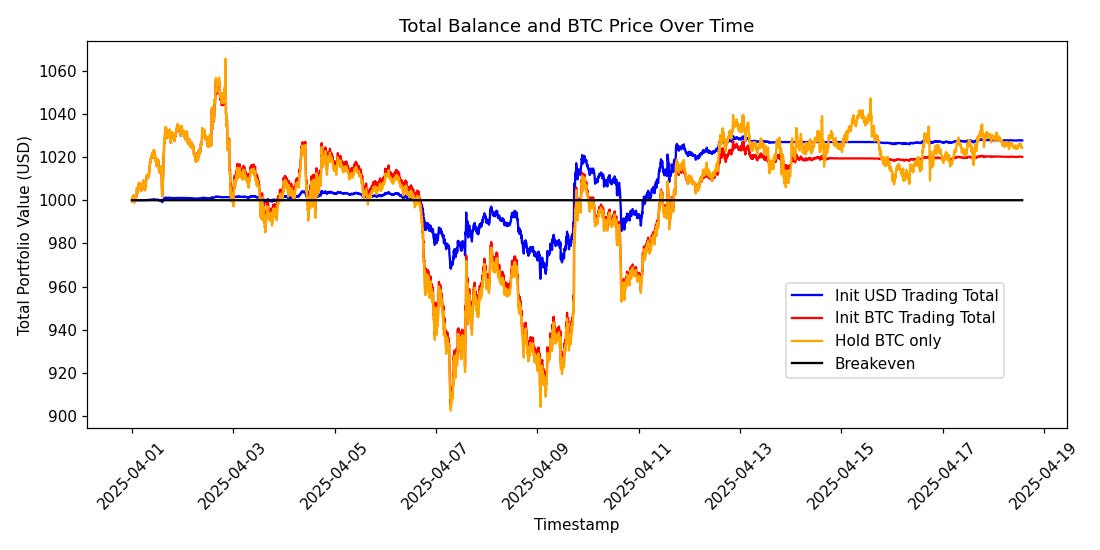
Figure 7
This pessimistic signal is reflected in the previous Figure 6 which, although using different assumptions, is based on the same forecasts. Figure 6 shows a long stretch of non-stop “sell BTC” signal. The impact in the current simulation is to leave us without any BTC left in our portfolio, so we’re unable to profit from the bumps in price the last several days. That said it is worth noting that we still don’t lose much. At the same time the forecasts insist on selling BTC the price begins several days of sideways movement. It will be interesting to see in which direction it breaks out and how quickly the Precog community catches on.
Although the net result over the period under-performs the pure BTC asset, the results are not all bad. First of all, 3047 / 5056 observed points, or 60% of the time period shows the forecast-based trading strategy out-performing simple buy-and-hold. This gives us some evidence to justify this simply as an unlucky stretch for the miners’ predictions. Additionally, the downside risk was a bit less when trading. Holding BTC led to a minimum portfolio value of $902.62 in the period, whereas trading the same amount of initial BTC gave a minimum value of $905.02. This difference may seem irrelevant, but is roughly comparable to the final difference in returns; which ends up being a $4.28 advantage to “hold BTC” strategy.
We should also mention that the best performing strategy of all is in fact an active trader who started the period allocated to USD (blue line in Fig 7). This person would beat out a “conservative” holder who kept their money allocated to USD throughout the period, and would also beat the BTC-holder, albeit slightly, even after the price recovers.
Conclusion
To answer the question “is this subnet doing something valuable,” we simulated trades based on actual Bitcoin market movements during March. The strategy used only the Precog forecast and the 1-minute Bitcoin price at prediction time, without considering historical data.
Simply using the direction of the forecast relative to the price at the prediction time to determine a binary "buy or sell" decision, we obtained positive returns over several periods. We showed positive performance over a 24-day period, particularly when the trader could continue buying or selling as forecasts dictated. In the real world this could be through access to debt in either asset, or simply a large capital reserve.
The strategy traded a fixed amount (1.00 USD) every 5 minutes, so the performance reflects the net effect of many small trades. The 24-day period from 3/01 to 3/24 saw a net growth of 25x the trade size. This strategy can certainly be improved by incorporating historical context, volatility-based sizing, or more precise ways of utilizing the forecasted price. In our next investigation, we intend to use the Interval Forecast to adjust the size of trades based on how much uncertainty is expected in the next hour.
We also tested whether these results were a consequence of specific market conditions. However, when we looked at shorter time periods during which the price decreased, we observed that the Precog forecasts tended to respond appropriately. In the full paper, we bootstrapped several 1-week samples and 15/18 showed positive net returns. In this article, we included four examples where BTC price declined, and the strategy still captured upside and limited losses.
As a final test we considered a more concrete simulation: a trader with only $1000 of starting capital. We were impressed to find that even during a 24-day period when Bitcoin's price steadily increased, the Precog forecasts helped the trader capture additional returns. When shifting the timeframe to one with a net price decline, the strategy also reduced losses.
Latest Results
Re-visiting these analyses with the most recent data demonstrates the importance of testing on a variety of data sets. The macroeconomic conditions since April have been very different in both behavior and sentiment compared to March. Because our subnet depends on miner expectations and not just observed trends, it may be especially sensitive to such changes. The results are nevertheless encouraging. With access to enough liquidity to buy and sell as necessary, the Precog forecasts still guide us to a net positive result.
When limiting ourselves to a fixed bankroll, we see a new outcome not seen in earlier tests. Over the past week or two, the forecasts consistently anticipated price drops. This led our simulation to liquidate all its Bitcoin and the portfolio was not able to ride the recent bumps up in price. At the same time, the Bitcoin price has been relatively flat for several days, and it is possible our hypothetical trader will end up grateful their allocation is in USD if the market takes another downturn.
Coin Metrics Updates
Follow Coin Metrics’ State of the Market newsletter which contextualizes the week’s crypto market movements with concise commentary, rich visuals, and timely data.
As always, if you have any feedback or requests please let us know here.
Subscribe and Past Issues
Coin Metrics’ State of the Network, is an unbiased, weekly view of the crypto market informed by our own network (on-chain) and market data.
If you'd like to get State of the Network in your inbox, please subscribe here. You can see previous issues of State of the Network here.