A. Market Perspective
I. Macro Liquidity
Monetary liquidity is improving. The chaotic implementation of Trump's tariff policy has rapidly weakened market confidence in the US economy and may continue to disrupt markets in the next three months, regardless of the final outcome. US Treasury bonds and the US dollar have returned to a spiral decline, with historic stock market surges often occurring in the mid-term bear market. The crypto market follows the violent fluctuations of US stocks.

II. Overall Market Situation
Top 300 Market Cap Gainers and Losers:
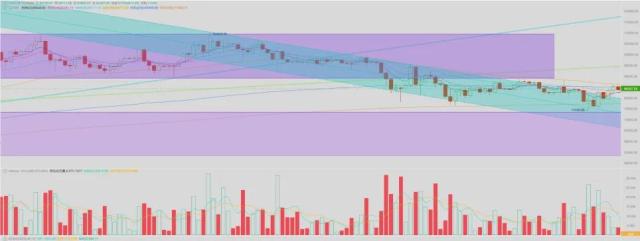
This week, BTC rebounded from overselling, while small coins were heavily sold off. The market lacks a main theme.
Top 5 Gainers | Gains | Top 5 Losers | Losses |
XCN | 110% | BERA | 40% |
FARTCOIN | 100% | EOS | 20% |
Gas | 60% | MEW | 20% |
LAYER | 40% | W | 20% |
UXLINK | 30% | NEAR | 20% |
- BERA: DeFi public chain plummeted to a new low, breaking through the long-term oscillation support level. Stablecoin on the chain decreased by $300 million in the past week.
- FARTCOIN: A meme coin on the SOL chain that rose several times at the bottom against the market trend, leading this round of rebound.
- BABY: The leading BTC ecosystem staking project, with market value returning to $800 million after the last institutional investment. The re-staking track has been disproven.
III. On-Chain Data
Capital inflow in the BTC market has stalled. Liquidity is rapidly shrinking, with Altcoin market value declining from $1 trillion at the end of 2024 to $600 billion. This downturn seems to be universal, with all sectors experiencing significant devaluation.

Institutional funds are experiencing a slight net outflow, with global markets in panic.

Stablecoin market value slightly declined, with investors showing clear risk-averse sentiment.


The long-term trend indicator MVRV-ZScore, based on the total market cost, reflects the overall market profitability. When the indicator is above 6, it is in the top range; when below 2, it is in the bottom range. MVRV has fallen below the key level of 1, with holders generally in a loss state. The current indicator is 1.6, approaching the bottom range.
IV. Futures Market
Futures Funding Rate: This week's rate is 0.00%, which is low. A rate of 0.05-0.1% indicates high long leverage, signaling a short-term market top; a rate of -0.1-0% indicates high short leverage, signaling a short-term market bottom.

Futures Open Interest: BTC's open interest continues to decline this week, with market main players exiting.

Futures Long-Short Ratio: 1.9, indicating a greedy market sentiment. Retail investor sentiment is often a reverse indicator, with below 0.7 considered fearful and above 2.0 considered greedy. The long-short ratio data is highly volatile, reducing its reference value.

V. Spot Market
BTC experienced severe volatility this week, with Altcoins lacking new narratives. Influenced by the increasing uncertainty of the US tariff system, global financial market pressure continues to intensify. This weakness has spread to almost all asset classes, with the crypto asset market deeply trapped in a bear market.