

The 2025 tariff war escalates comprehensively, with the Trump administration announcing a minimum 10% tariff on goods from almost all countries and additional higher tariffs on approximately 60 countries with the largest trade imbalance with the United States, causing global market panic, with the main logic being
Increased tariffs raise enterprise costs and compress profit expectations
Disrupt global supply chains, deepening economic uncertainty
Trigger retaliatory tariffs, expanding trade war risks
In such an environment, capital market participants will:
Reduce risk asset allocation (such as stocks, cryptocurrencies)
Increase safe-haven asset allocation (such as gold, US dollar, Japanese yen)
Raise volatility expectations → VIX surge
Tariffs → Cost increase + Global supply chain disruption + Retaliation risk + Investment withdrawal + Safe-haven capital flow → Market panic
The panic index VIX soared to 60 on April 7th, which is a rare occurrence. Historically, this has only happened three times, with the previous instance on August 5th, 2024, and the first time during the COVID-19 pandemic in 2020.
We can confirm that the current VIX index is in a historically extreme environment. Facing such a situation, how can we predict the market through VIX?
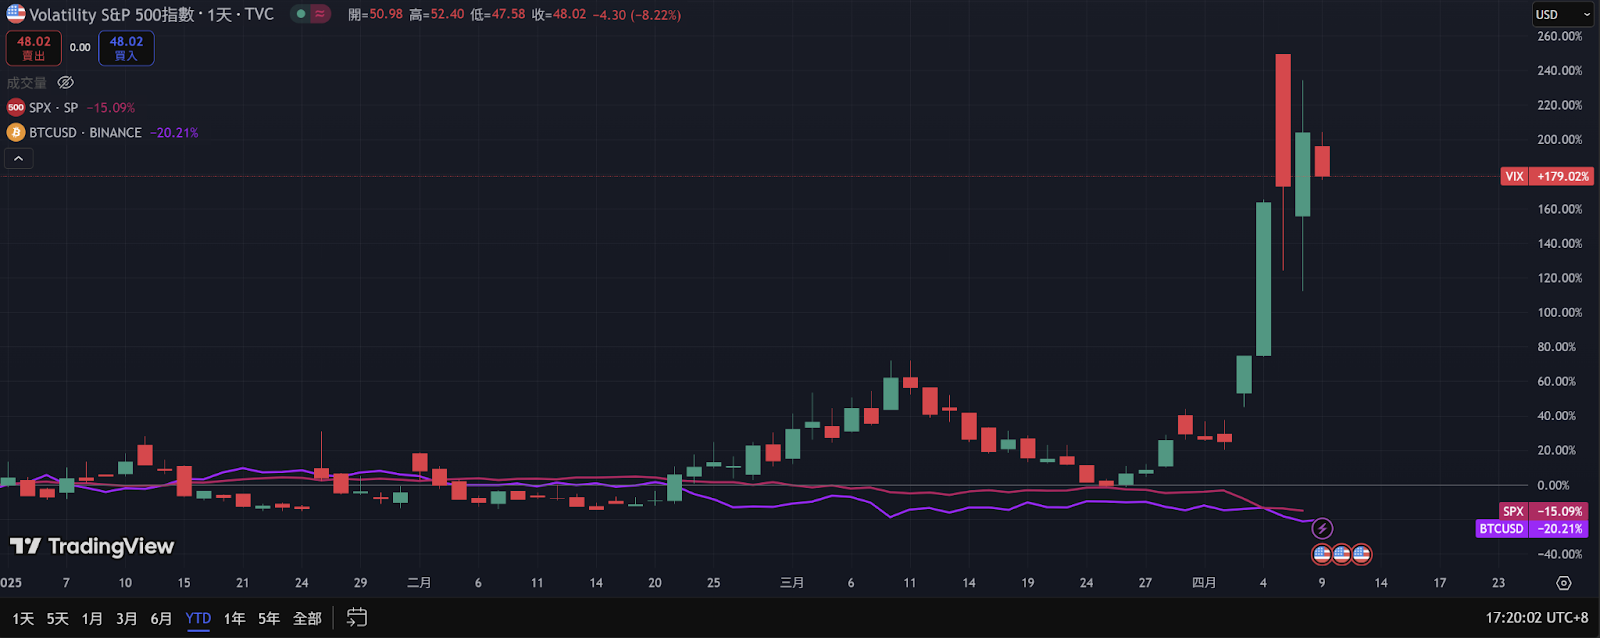
Reference: Tradingview
What is VIX?
VIX is calculated based on S&P 500 index option prices to estimate the expected market volatility for the next 30 days, and is considered an indicator of market uncertainty and panic sentiment.
Simply put, a higher VIX represents greater expected market volatility and stronger panic sentiment; a lower VIX indicates a calm market with higher confidence. Historical experience shows that VIX typically surges during significant stock market declines and falls when the stock market rises steadily. Due to this inverse relationship with the stock market, VIX is also known as the "Panic Index" or the market's emotional thermometer.
[The translation continues in the same manner for the rest of the text, maintaining the original structure and translating all text except for the HTML tags and specific terms like BTC, VIX, etc.]Therefore, the predictive value of low VIX for BTC's subsequent trend is not obvious, and it must be combined with the capital sentiment and cycle of the crypto market itself. Overall, when VIX is below 15, S&P 500 tends to continue its existing trend (mostly a gradual upward movement), but the magnitude of increase and win rate are significantly lower than the rebound after panic. BTC lacks a unified response pattern in this environment, showing that low traditional market volatility does not necessarily mean synchronization in the crypto market. Conclusion: Risks and Opportunities Coexist, Measuring a Boat's Ruler is Only for Reference When VIX surges to the 30-40 range - Short-term risks may exist, but potential reversal opportunities are also present. - BTC usually falls in sync during panic selling, but as panic emotions gradually subside, excessive short positions can easily trigger a strong technical rebound. - If VIX is observed to peak and start falling (slowly returning from 35 to below 30), it could be a potential short-term buying opportunity for BTC. - The severity of the event itself must be simultaneously examined; if a major financial risk erupts, the market may continue to decline. When VIX ≥ 40 - Represents the market is in extreme panic, including possibilities of liquidity drought and massive capital withdrawal. - BTC has an extremely high probability of a short-term sharp decline, but often one to two weeks later, if panic slightly eases, the expected BTC rebound magnitude will be relatively stunning. - In this environment, short-term speculators are advised to maintain high risk control and strictly adhere to stop-loss, as "licking the knife's edge" involves both profits and risks. - From a larger cycle perspective, it is a relatively low point. When VIX ≤ 15 - The market is generally in a natural state. Whether BTC rises often depends more on the crypto market's own cycle, capital flow, or technical trend. - In an overly calm environment, be alert that if sudden changes or black swan events occur, VIX could rapidly jump, and BTC might follow with a correction. - Consider retaining some cash/stablecoins as preparation during this period, always paying attention to risk direction. The middle area of VIX 15-30 - Generally viewed as the "normal fluctuation" range. BTC will also be influenced by crypto cycles and macro capital flow, with VIX serving as an auxiliary indicator. - If VIX rises from above 20 to near 30, it indicates growing panic and requires moderate risk prevention; conversely, if VIX gradually falls from 25 to below 20, it shows panic fading, and BTC might be relatively stable. At the time of writing, VIX is at 50, facing the uncertainty of US tariffs, and market sentiment remains in extreme panic. However, trends are often born in despair. During the 2020 pandemic, VIX peaked above 80. At that time, S&P 500 was around 2300 points, and even after recent panic selling, S&P 500 is still around 5000 points, achieving over 100% ROI within five years. Meanwhile, Bitcoin was at an excellent buying point of just 4800 USD, with this bull market's high point reaching 110,000 USD, with a maximum increase of nearly 25 times. Each major decline is often accompanied by market repricing and capital flow. Chaos is a ladder, and the key issue in this period is whether one can climb and leap using it.


