

Recently, after experiencing a bull market boom, the crypto asset market has begun to show signs of liquidity contraction and changes in investor risk appetite. On-chain data and key derivatives market indicators suggest that the market is transitioning from a high-volatility, high-speculation state to a more cautious, low-liquidity phase. On-chain activities of BTC and ETH show a significant decrease in hot supply, with notably reduced exchange fund inflows.
Is the market currently at a turning point? Is it a bull market reversal or the end of a bull run? How can investors seize opportunities amid shrinking liquidity and adjusting risk appetite? This article aims to analyze the current market environment based on on-chain activities of BTC and ETH, exchange fund flows, and market dynamic data.
Overall Liquidity Tightening and Decreased Market Activity
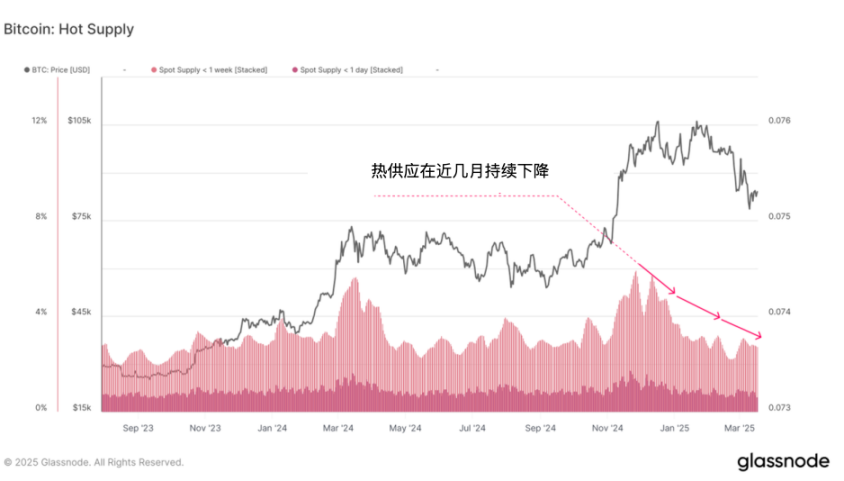
According to glassnode data, BTC on-chain activity has dropped to levels unseen in months, with a significant decrease in transaction volume, often indicating a consolidation period after high volatility. BTC's "Hot Supply" - an indicator measuring active market capital, representing Bitcoin held for less than a week - has dropped from 5.9% to 2.8% over the past three months, showing over 50% decline, further substantiating the liquidity contraction phenomenon.
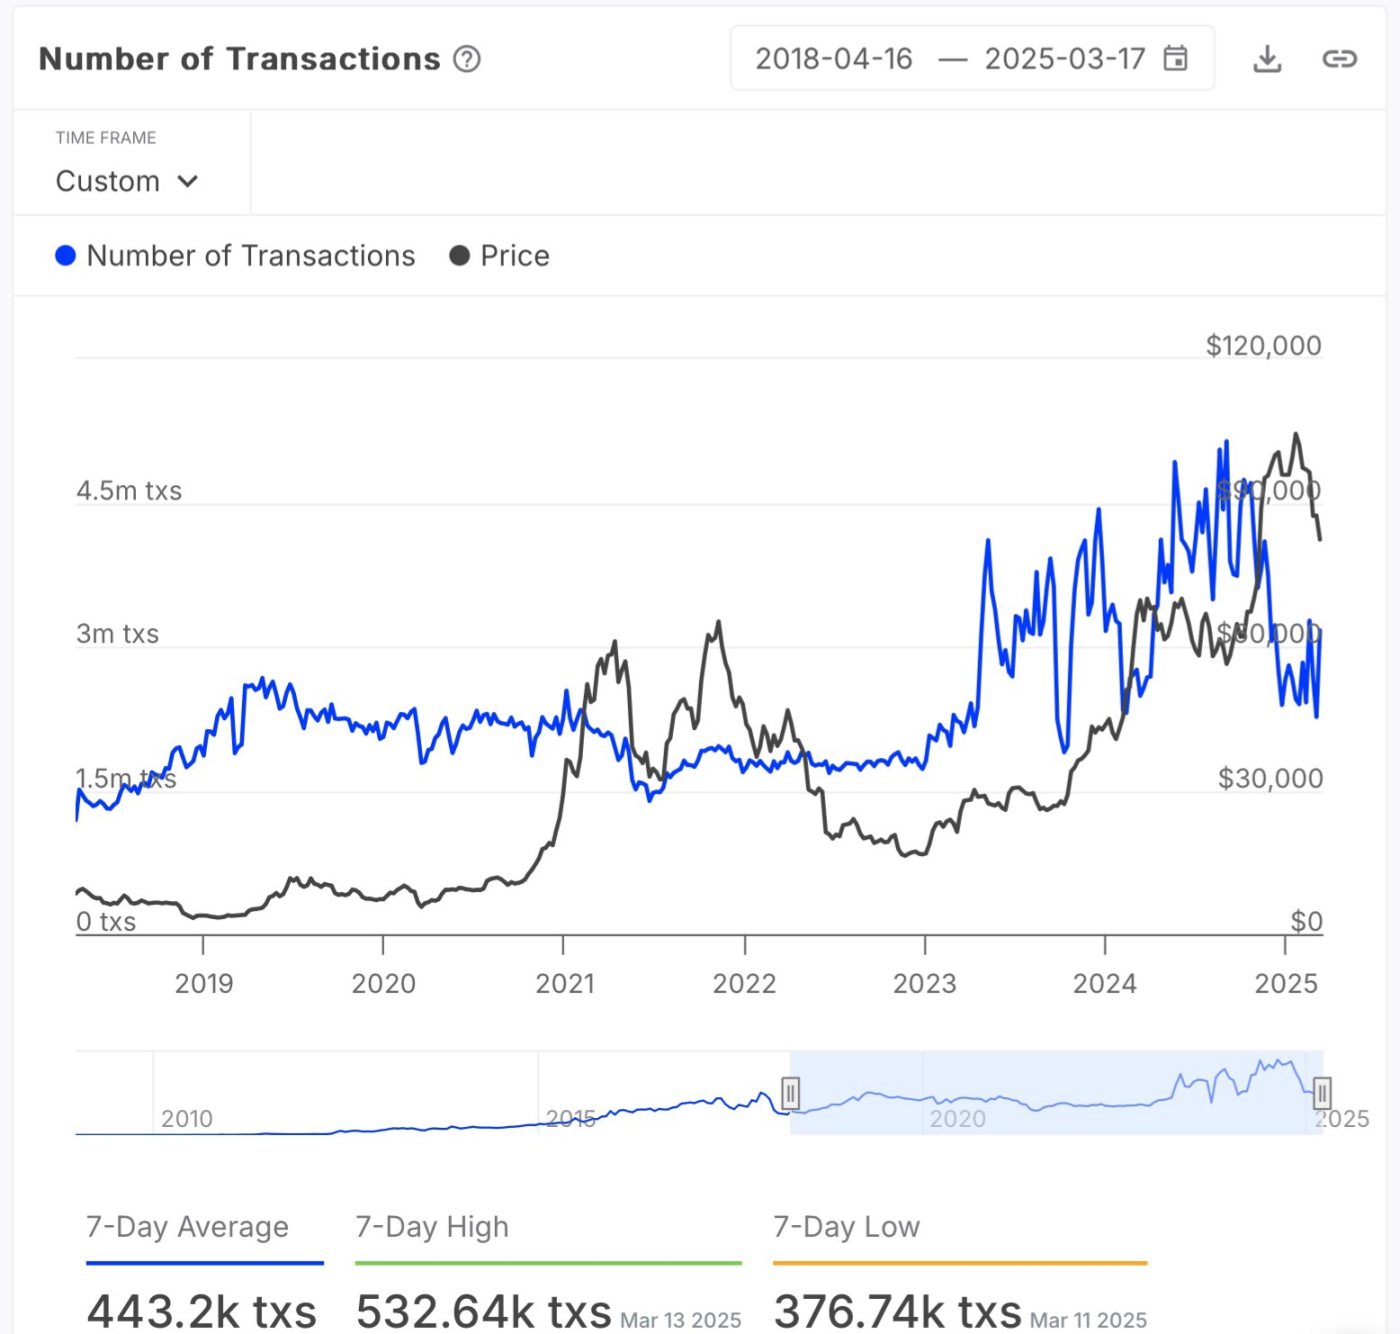
From on-chain transaction numbers alone, BTC on-chain activity has also fallen to months-low levels, indicating a cooling period or short-term interest decline. The reduction in transaction volume seemingly implies decreased speculative activity. If long-term holders are not selling and new fund inflows are limited, the market might enter an accumulation phase.
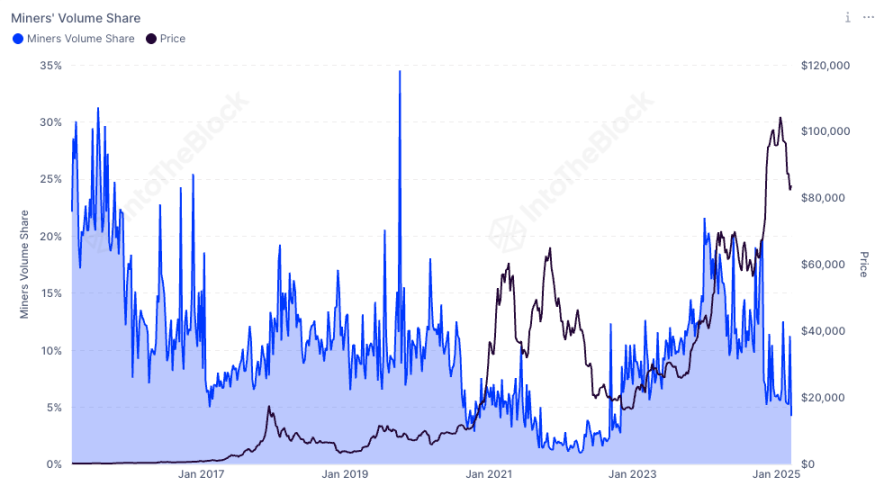
Simultaneously, BTC miners' share of total on-chain transactions dropped to 4.23%, the lowest since November 2022. This data reflects a significant decrease in miners' on-chain transaction participation. The lower transaction share might indicate miners are reducing selling behavior, preferring to hold coins to manage market volatility, thus reducing selling pressure from miner liquidations.
The relative decline in miner transaction volume could also mean increased activity from other market participants like long-term holders or institutional investors, signaling a change in overall on-chain transaction structure. Against the backdrop of market changes and declining mining revenues, miners might be adjusting strategies, reducing frequent on-chain transactions and focusing on optimizing revenue structures.
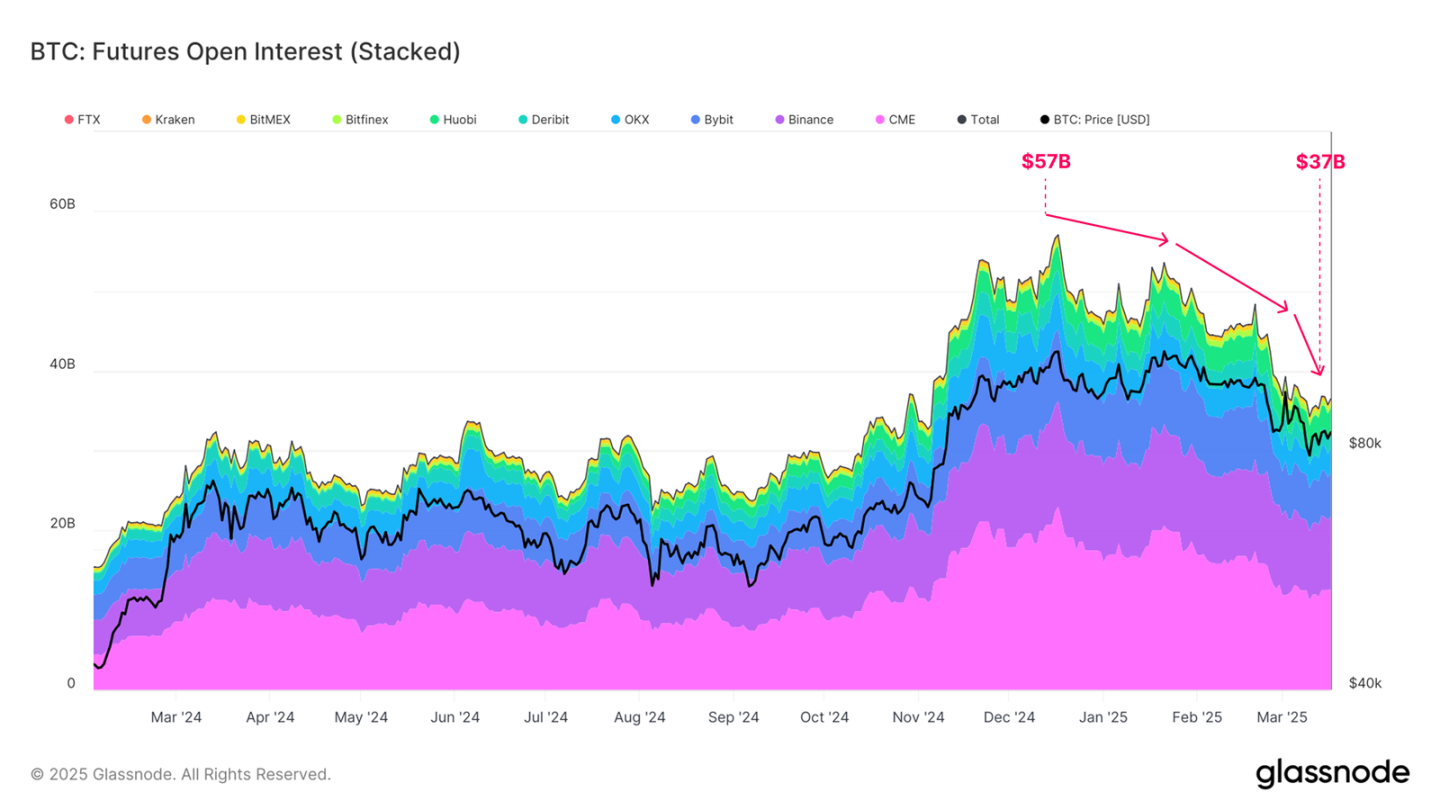
In the futures market, total open interest has declined from the ATH of $57B to $37B, a drop of approximately 35%, indicating significantly reduced hedging and speculative activities.
Concurrently, after the US spot ETF launch in 2024, institutions previously gained arbitrage profits through cash arbitrage (Longing ETF + Short futures) in upward markets. However, with weakening market confidence and Long-side arbitrage unwinding, arbitrage trades are gradually withdrawing, causing ETF fund outflows and further downward pressure on the spot market.
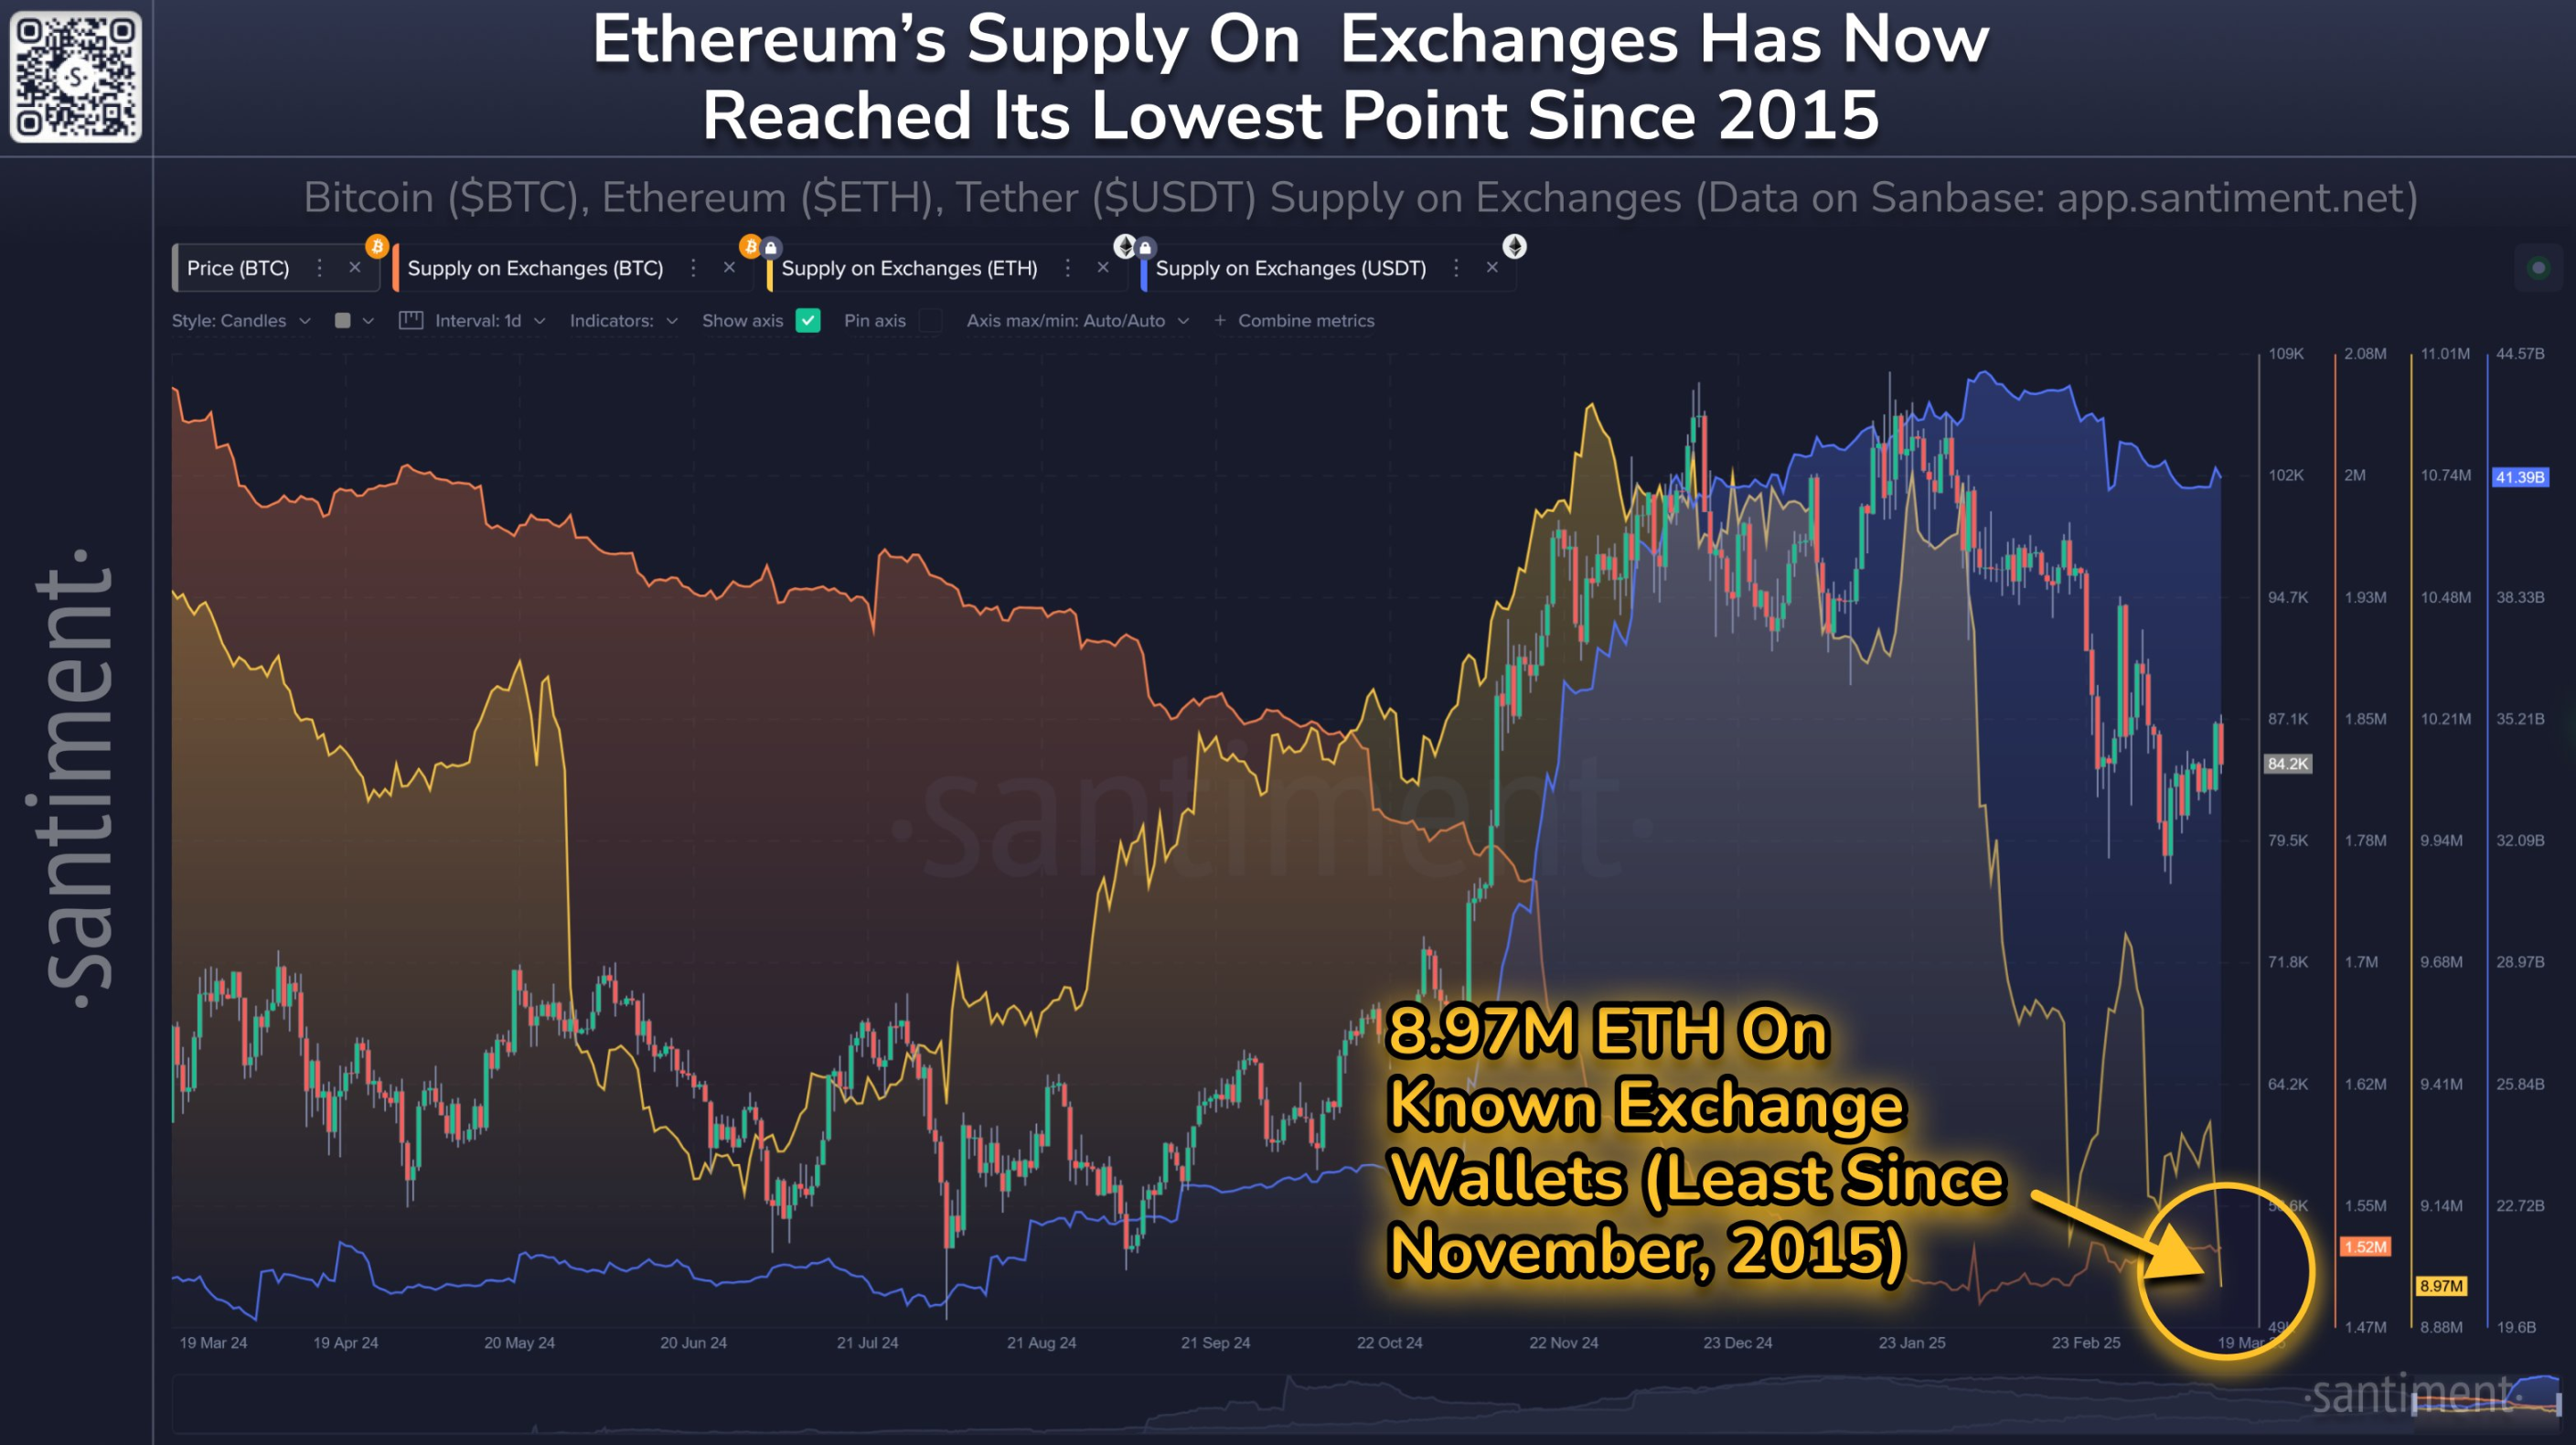
Ethereum Exchange Supply Drops to Near 10-Year Low
According to crypto market analysis institution Santiment, due to DeFi protocols and staking products, available ETH exchange supply has dropped to 8.97 million (equivalent to $18 billion at current prices, less than 7.5% of Ethereum's current market cap), the lowest in nearly 10 years (previous low was November 2015). Compared to just 7 weeks ago, ETH on trading platforms has reduced by 16.4%.
The drop in Ethereum exchange supply to a near 10-year low indicates significant market liquidity tightening. Lower exchange supply means reduced ETH available for selling, decreasing potential selling pressure, but also making prices more susceptible to large transactions and increasing volatility.
However, in the current state, despite decreased exchange supply showing enhanced asset locking effects, overall market environment and multiple factors still exert downward price pressure. Current macroeconomic uncertainty, shifting market risk appetite, and partial institutional fund withdrawals further tighten market liquidity.
Simultaneously, DeFi sector volatility and competitive public chain developments negatively impact Ethereum's market expectations. In this context, while lower exchange supply reduces potential selling pressure, unfavorable market sentiment and external environment continue to drive prices downward.
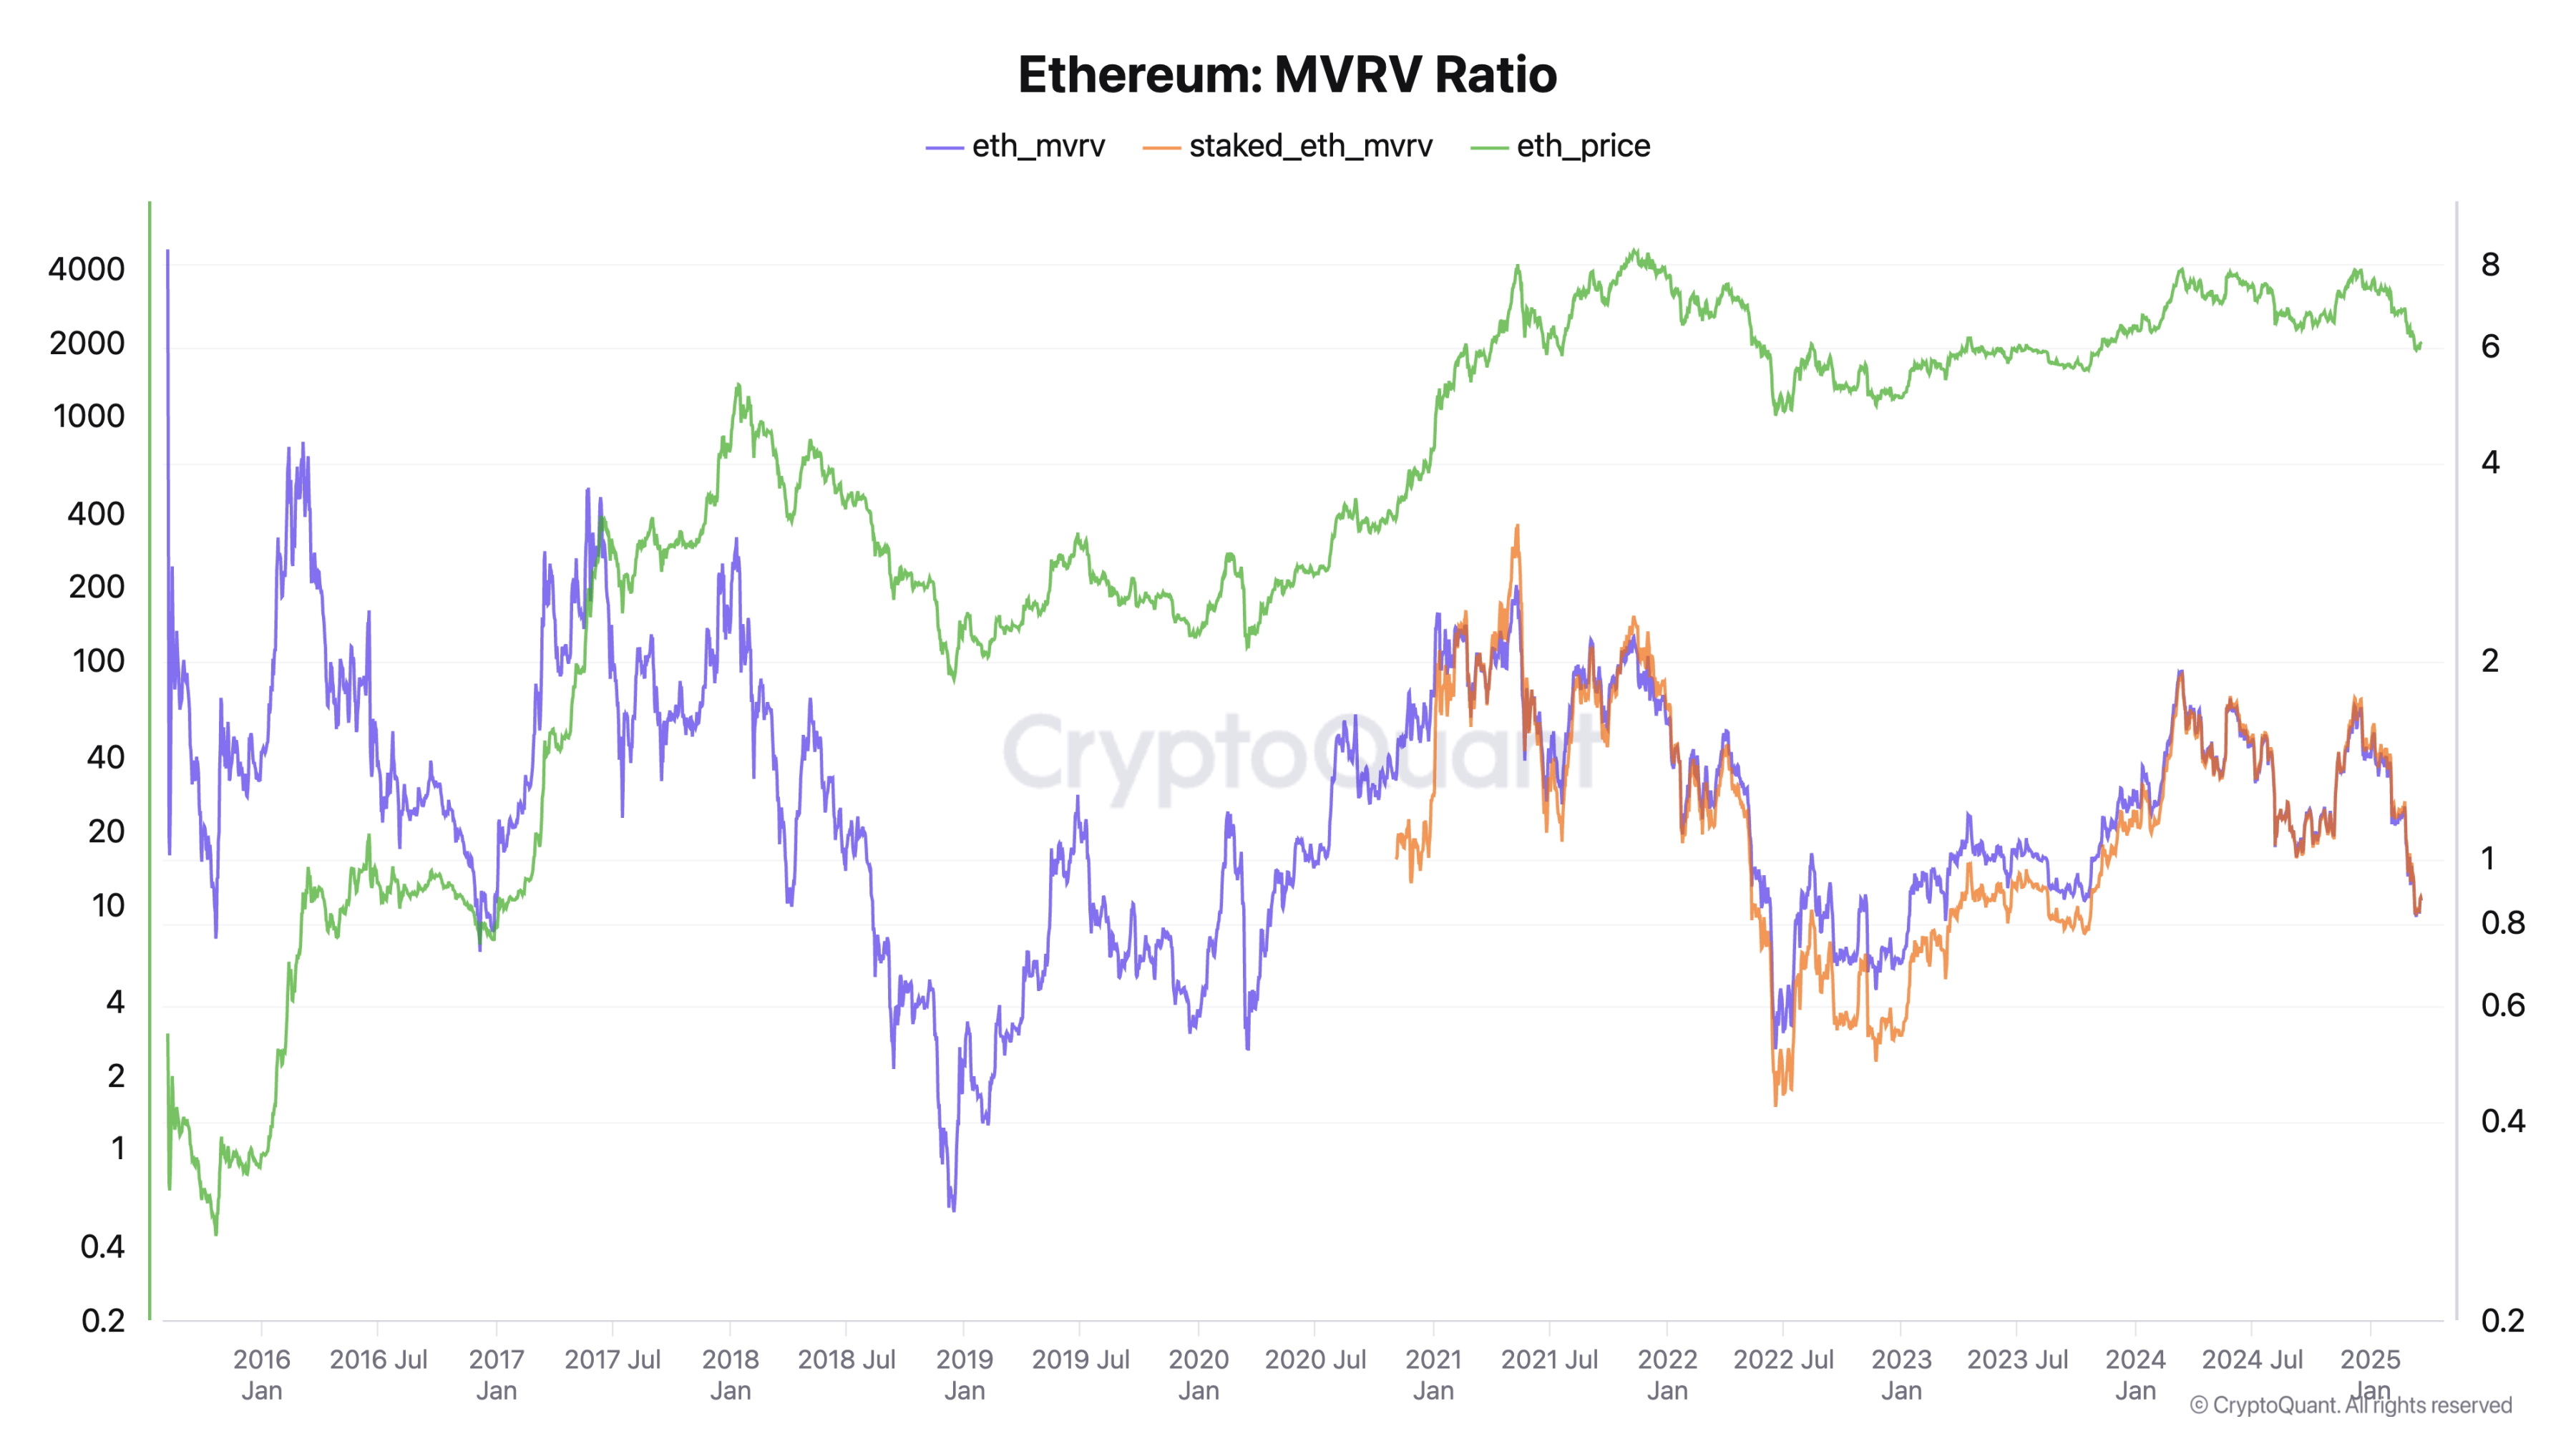
Using indicators to assess its current state, according to IntoTheBlock data, ETH's MVRV (Market Value to Realized Value) has dropped to around 0.8. This level is uncommon in Ethereum's history, typically occurring during bear markets.
MVRV is usually used to compare the relationship between a token's market value and realized value, reflecting the supply-demand dynamics and helping detect whether the token is currently undervalued or overvalued. It's also used to identify potential market tops or bottoms.
Summary
Historically, BTC experienced a stage of consolidation before a rally in October 2023. Whether the market is repeating a similar pattern requires further observation. Some analysts like Ki Young Ju, CryptoQuant's founder and CEO, suggest the short-term bull market cycle might be nearing its end, with prices more likely to trend bearish or sideways in the next 6 to 12 months.
However, the Federal Reserve's recent signals of loose monetary policy and market expectations of quantitative tightening ending and potential quantitative easing restart have also brought some liquidity. BitMEX co-founder Arthur Hayes tweeted, "Powell has fulfilled his promise, quantitative tightening (QT) essentially ends on April 1st. To truly drive the market into a bull market, either restore SLR exemption or restart QE. $77,000 might be Bitcoin's bottom, but the stock market might need more volatility before Jay fully leans towards Trump's team. So everyone should stay flexible and keep cash on hand."
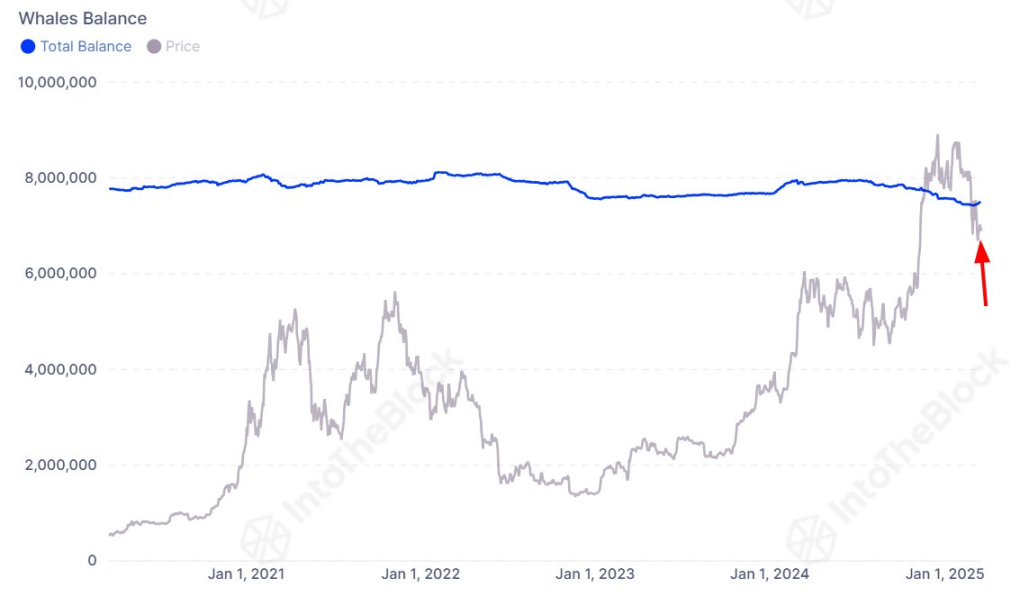
In this environment, the market's bottom and subsequent reversal remain uncertain. Investors still need to closely monitor overall market liquidity, on-chain fund flows, and further changes in institutional whale behavior. For instance, IntoTheBlock detected that although whale balances have been declining over the past year, March data hints at a potential reversal. Currently, whales' holdings have increased by approximately 62,000 BTC compared to early this month, showing signs of re-accumulation.
Overall, the current market is transitioning from a high-risk, high-volatility bull market to a low-liquidity, risk-averse situation. Short-term market sentiment leans pessimistic, with insufficient fund inflows and arbitrage trade unwinding continuing to exert downward price pressure. However, the stability of long-term holders and re-accumulation by some whales may provide necessary support for the market in the future.


