

Each bull market not only creates wealth, but also manufactures countless wealth illusions. When the market is exuberant, few can remain clear-headed and elegantly "escape the top". Faced with a market of rapid rises and falls, how to exit at the right time near the peak and avoid the asset shrinkage caused by deep corrections requires us to comprehensively analyze multiple market indicators.
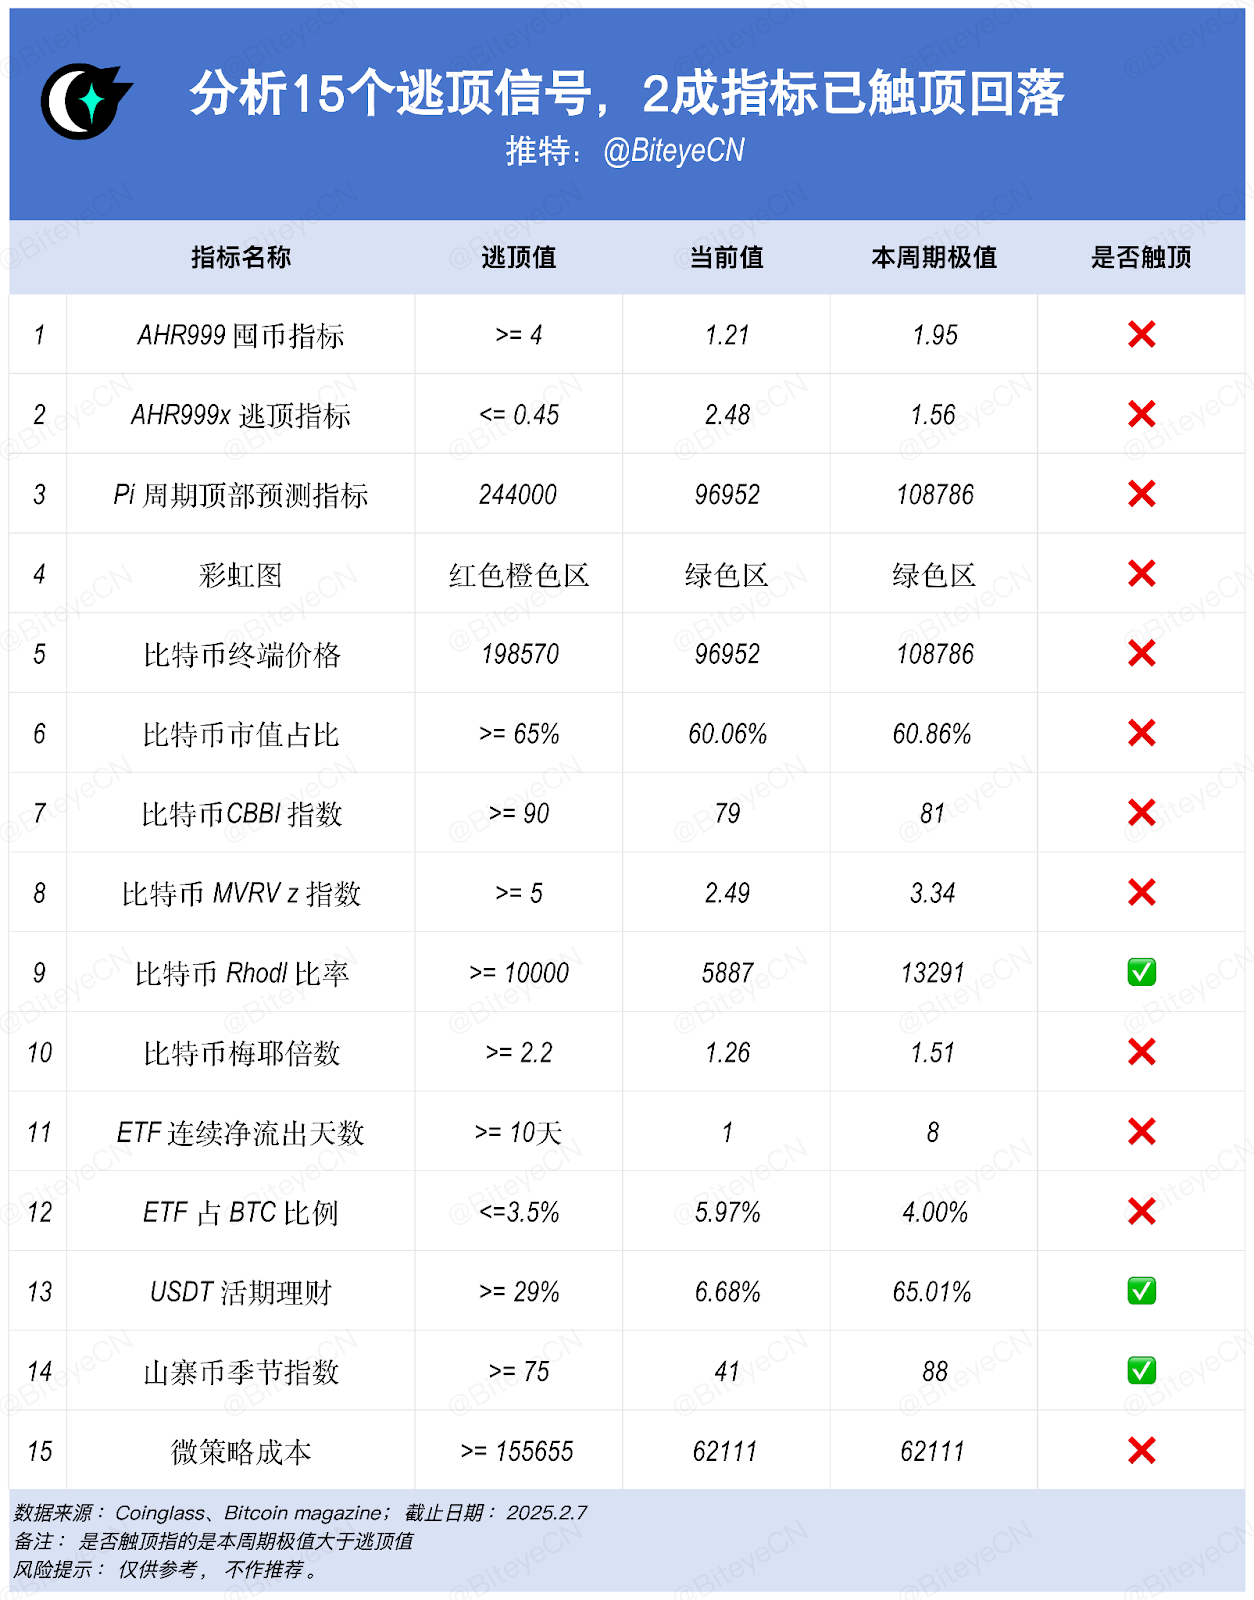
This article analyzes 15 commonly used escape-the-top indicators and finds that one-fifth of the indicators have already reached the escape-the-top range in 2024, including the Bitcoin Rhodl ratio, USDT demand deposit, and the altcoin seasonal index. In this case, how should we respond to the subsequent market developments?
I. Indicator Introduction
1. AHR999 Hoarding Indicator
This indicator was created by Weibo user ahr999, and helps Bitcoin dollar-cost averaging users make investment decisions based on timing strategies. The indicator implies the short-term return on Bitcoin dollar-cost averaging and the deviation of Bitcoin price from expected valuation.
Indicator range:
- >4: Suggest significantly reducing positions
- 1.2-4: Observation zone, remain vigilant
- 0.45-1.2: Dollar-cost averaging zone, can gradually build positions
- <0.45: Strong buy the dips zone
🔥 Current status: The indicator value is 1.21, not yet at the top, in the observation zone, and it is recommended to remain cautious.
Link: https://www.coinglass.com/zh/pro/i/ahr999
2. AHR999 Escape-the-Top Indicator
The AHR999 escape-the-top indicator is a sister indicator of the hoarding indicator, specifically used to identify the market top area. This indicator judges whether the market is overheated by observing the degree of deviation of the price from the long-term trend line. It provided accurate warning signals at the tops of the two major bull markets in 2017 and 2021, and is an important tool to avoid chasing highs.
Indicator range:
<=0.45: Seriously overheated, consider escaping the top
🔥 Current status: The indicator value is 2.48, and no top signal has appeared in the current cycle.
Link: https://www.coinglass.com/zh/pro/i/ahr999-escape
3. Pi Cycle Top Indicator
The Pi Cycle Top Indicator predicts potential market tops by comparing the relationship between the 111-day moving average and the 350-day moving average. Historically, when the moving averages cross, Bitcoin's price is usually close to the cycle top, indicating a potential market reversal.
Signal characteristics:
- Two lines cross: Top signal triggered
- Rapid divergence: Bearish outlook
- Gradual approach: Prompt vigilance
🔥 Current status: The two moving averages still have a large distance, and no top signal has appeared yet. The next cross is expected in October 2025.
Link: https://www.bitcoinmagazinepro.com/charts/pi-cycle-top-prediction/
4. Bitcoin Rainbow Chart
The Rainbow Chart is a visual long-term valuation model that divides the Bitcoin price range into 9 different color bands. The model is based on logarithmic regression and considers Bitcoin's long-term growth characteristics and cyclical features. In past market cycles, the Rainbow Chart has shown good guidance, especially in identifying extreme regions.
Indicator range:
- Red: Bubble zone, sell signal
- Yellow: Overheated zone, remain vigilant
- Green: Healthy zone, hold zone
- Blue: Value zone, buying opportunity
🔥 Current status: The price is in the green zone, indicating that the valuation is relatively reasonable and no top signal has appeared.
Link: https://www.coinglass.com/zh/pro/i/bitcoin-rainbow-chart
5. Bitcoin Terminal Price Indicator
The terminal price is the transfer price multiplied by 21. The transfer price needs to be the destroyed coin days divided by the current Bitcoin supply and its circulation time. This indicator can effectively filter out market speculation factors and reflect the true value of the Bitcoin network.
Signal characteristics: The closer the Bitcoin price is to the red line, the closer the market is to the top.
🔥 Current status: Not yet at the top
Link: https://www.bitcoinmagazinepro.com/charts/terminal-price/
6. Bitcoin Market Cap Dominance
The market cap dominance indicator reflects Bitcoin's leading position in the entire cryptocurrency market. This indicator is usually used to judge the market cycle and capital flow, and when Bitcoin's market cap dominance declines, it usually means that capital is starting to shift to altcoins. Historical data shows that changes in Bitcoin's market cap dominance often foreshadow the turning points of the entire cryptocurrency market.
Indicator range:
- 65%: Bitcoin strong period
- 40-65%: Balanced period
- <40%: Altcoin active period
🔥 Current status: The market cap dominance is around 60%, in a relatively balanced range.
Link: https://www.coinglass.com/zh/pro/i/MarketCap
7. Bitcoin CBBI Index
CBBI (Combined Bitcoin Binary Index) is a composite index that integrates multiple technical indicators and on-chain data, and can better identify the turning points of bull and bear cycles. Its advantage lies in reducing the limitations of a single indicator through multi-dimensional data.
Indicator range: Greater than 90 means the market has reached the top.
🔥 Current status: The index value is 79, indicating that the market is slightly overheated, but has not yet reached the top.
Link: https://www.coinglass.com/zh/pro/i/cbbi-index
8. Bitcoin MVRV Z-Score
The MVRV Z-score is an important on-chain analysis indicator that judges the market cycle by comparing the deviation between market value and realized value. When this indicator is too high, it means that Bitcoin's market value is overvalued relative to its actual value, which is unfavorable for Bitcoin prices; conversely, it is undervalued. According to past experience, when this indicator is at a historical high, the probability of a downward trend in Bitcoin prices increases, and the risk of chasing highs should be noted.
Indicator range: Greater than 5 means the market has reached the top.
🔥 Current status: The index is 2.5, not yet at the top.
Link: https://www.coinglass.com/zh/pro/i/bitcoin-mvrv-zscore
9. Bitcoin Rhodl Ratio
The Rhodl ratio is a composite on-chain indicator that judges the potential turning points of the market by comparing the behavioral characteristics of holders in different periods. When the Rhodl ratio approaches the red band, it may indicate that the market is overheated. Historically, this has been a good time for investors to realize profits in each cycle.
Indicator range: Approaching the red band may indicate that the market is overheated. Ratio >= 10000 when the market is approaching the top.
🔥 Current status: It has not yet entered the red band, but the indicator entered the top range in November 2024.
Link: https://www.coinglass.com/zh/pro/i/r-hodl-ratio
10. Bitcoin Mayer Multiple
The Bitcoin Mayer Multiple is a technical indicator for analyzing the market condition of Bitcoin, proposed by Trace Mayer. It evaluates the relative valuation level of the market by comparing the current Bitcoin price with its 200-day moving average (200DMA).
Indicator range:
- Mayer Multiple > 1: Indicates that the current Bitcoin price is higher than its 200-day moving average, and the market may be in an overbought state.
- Mayer Multiple < 1: Indicates that the current Bitcoin price is lower than its 200-day moving average, and the market may be in an oversold state.
- Mayer Multiple ≈ 1: Indicates that the current Bitcoin price is close to its 200-day moving average, and the market may be in a relatively balanced state.
Historically, when the Mayer Multiple exceeds 2.4, it usually indicates that the market is overheated and a correction or bear market may occur. When the Mayer Multiple is below 0.8, the market may be undervalued, which may be a good buying opportunity.
🔥 Current status: The index is 1.26, the market is in an overbought state, but has not yet reached the top.
Link: https://www.coinglass.com/zh/pro/i/mayer-multiple
11. Number of Consecutive Net Outflow Days of Bitcoin ETF
This indicator tracks the capital flow of Bitcoin ETFs, and consecutive net outflow days often reflect the confidence status of institutional investors. This is a relatively new indicator that has gradually gained market attention since the launch of spot ETFs.
Signal characteristics:
- 10 days: Significant bearish signal
- 5-10 days: Need to be vigilant
- <5 days: Normal fluctuation
🔥 Current status: 1 day of consecutive net outflow, within the normal market fluctuation range. The maximum consecutive days in this cycle is 8 days, and there has been no 10-day occurrence.
Link: https://www.coinglass.com/zh/bitcoin-etf
12. Proportion of BTC Held by ETFs
This indicator reflects the proportion of Bitcoin held by ETFs to the total circulating supply, used to assess the degree of institutional participation. This indicator can reflect the acceptance and participation depth of traditional financial institutions in Bitcoin.
Signal characteristics: <=3.5% is a top-selling indicator, also implying low institutional participation
🔥 Current status: The proportion is close to 6%, indicating that institutional participation is in a healthy growth stage.
Link: https://www.coinglass.com/zh/bitcoin-etf
13. USDT Demand Deposit Yield
The USDT demand deposit yield is an important indicator for measuring the cost of market capital. This indicator reflects the overall liquidity conditions in the cryptocurrency market.
Signal characteristics: >=29% is in the top-selling range
🔥 Current status: The yield is around 6.68%, at a normal level. However, during the period of March 2024, this indicator entered the top-hitting range, reaching 65%.
Link: https://www.coinglass.com/zh/pro/i/MarginFeeChart
14. Altcoin Season Index
This indicator is used to judge whether the market has entered the Altcoin active period. By comparing the performance of Bitcoin and major Altcoins, it can be determined whether capital is starting to shift towards riskier small-cap coins.
Indicator range:
- 75: Altcoin season, exceeding 75 means the market is approaching the top
- 25-75: Balanced period
- <25: Bitcoin dominance period
🔥 Current status: The index is 41, however, during the period of December 2024, this indicator entered the top-hitting range, reaching 88.
Link: https://www.coinglass.com/zh/pro/i/alt-coin-season
15. MicroStrategy Cost Basis Indicator
This indicator tracks the average Bitcoin holding cost of MicroStrategy, as a reference benchmark for institutional investors. As one of the largest corporate Bitcoin holders, its cost basis often becomes an important psychological price level for the market.
Indicator range:
- Current price higher than cost: Institutional profit zone
- Current price close to cost: Support level
- Current price lower than cost: Potential buying opportunity
🔥 Current status: MicroStrategy's average cost is around $60,000, in the institutional profit zone.
Link: https://www.coinglass.com/zh/pro/i/micro-strategy-cost
II. Summary
"Bear markets make you bankrupt, bull markets make you poor." Maintaining rationality during market frenzy and withdrawing completely during madness is much more difficult than buying at the bottom. Currently, only some indicators show top-selling signals, which does not mean that the entire market is definitely at the top. If you think the market has a risk of reaching the top, you can also consider:
- Set up phased profit-taking points, don't expect a perfect top.
- Convert profits into stablecoins or fiat currencies, rather than shifting to riskier Altcoins.
- It's better to sell early at high levels, don't sell late. Realizing profits is not the end, but to accumulate ammunition for the next round.
Remember, every top is an opportunity for some to get rich, but a wealth trap for the majority. The market provides equal opportunities for everyone, but those who can seize the opportunity are often the ones who are prepared.


